© 2017 Ramalingam Peraman et al. This is an open access article distributed under the terms of the Creative Commons Attribution License -NonCommercial-ShareAlikeUnported License (http://creativecommons.org/licenses/by-nc-sa/3.0/).
Journal of Applied Pharmaceutical Science Vol. 7 (09), pp. 085-093, September, 2017 Available online at http://www.japsonline.com
DOI: 10.7324/JAPS.2017.70912 ISSN 2231-3354
Stability-indicating RP- HPLC -DAD method for the simultaneous
estimation of Tramadol HCl and Diclofenac sodium
Ramalingam Peraman
1, D. Subba Rao
2, Rajesh Reddy Kadiri
1*, Amaranatha Reddy Bommireddy
31
Analytical Research Laboratory, Raghavendra Institute of Pharmaceutical Education and Research (RIPER), K R Palli Cross, Near SK University, Anantapur Dt, Andhra Pradesh, India. 2Department of Chemical Engineering, Jawaharlal Nehru Technological University Anantapur¸Andhra Pradesh, India. 3Analytical research and development, Apotex Research Private Limited, Bangalore, Karnataka, India.
ARTICLE INFO ABSTRACT
Article history: Received on: 21/12/2016 Accepted on: 21/02/2017 Available online: 30/09/2017
A Specific stability-indicating high performance liquid chromatographic method was developed and validated for the determination of Tramadol HCl and Diclofenac sodium in a tablet dosage form. The separation was achieved on a reverse phase C18 column (Agilent ODS) (250 × 4.6 mm, 5 µ m) with mobile phase consisted of methanol:water (61:39 % v/v containing 0.2 % HSA, pH 3.0 adjusted with Orthophosphoric acid) and the eluents were detected at 219 nm. The retention time of Tramadol HCl and Diclofenac sodium was 5.9 min and 26.30 min respectively with the flow rate of 1ml/min. Drugs were subjected to stress conditions of acidic, basic, oxidation, photolytic, neutral and thermal degradation, considerable degradants were detected in all stress conditions. The method resulted in detection of 17 degradation products (D1 – D17), among those products, structures of D2, D9, D10, D12, D14, D15 and D16 were identified. The response of linear was in the range 5-50 µg/ml for Tramadol HCl and 10 to 70 µg/ml for Diclofenac sodium, respectively. Intra day precision was the range of 0.83-1.34(% RSD) for Tramadol and 0.27-0.93(% RSD) for Diclofenac. Inter day precision was the range of 1.33-1.81(% RSD) for Tramadol and 0.96-1.32(% RSD) for Diclofenac. Recoveries ranged in between 98-102 %.
Key words:
RP-HPLC, Simultaneous, Tramadol, Diclofenac, stability-indicating.
INTRODUCTION
Diclofenac Sodium (DIC) is chemically, sodium;2-[2-(2,6-dichloroanilino)phenyl]acetate, used as non-steroidal anti-inflammatory agent and is official in BP, USP. It acts by the
inhibition of leukocyte migration and the enzyme
cyclooxygenase (COX-1 and COX-2), leading to the peripheral inhibition of prostaglandin synthesis. Tramadol HCl (TRA) is
chemically, cis-2-[(dimethyl amino) methyl]-1-(3-methoxy
phenyl) cyclohexanol HCl, used mainly as analgesic and narcotic and is official in IP, BP & USPNF. It is a centrally acting opioid like drug and acts by binding to the µ opiate receptors, where it is
a pure agonist like morphine. Its mechanism of action is to
.
* Corresponding Author
Email: rajeshreddy.kadhiri @ gmail.com
weakly increase both serotonin and nor-adrenaline spinal cord concentrations by re-uptake (PubChem). The literature for various
analytical methods for DIC revealed that some UV
Spectrophotometric (Patel et al., 2012; Ali et al., 2012) and
simultaneous HPLC assay methods (Panda et al.,2012, Rathnam et
al., 2010), Bioanalytical LC method (Degwy et al., 2013) stability
indicating HPLC methods (Jadhav et al., 2015) and GC methods
(Rajeevkumar et al., 2011) have been reported for Diclofenac
Sodium alone or along with other drugs such as Paracetamol,
camylofin, Chlorzoxazone, Methocarbamol, Ibuprofen,
Metaxalone, Thiocolchicoside and Drotaverine. Reports on
analytical methods for TRA revealed that an UV
Spectrophotometric (Jignesh et al., 2011 ) and simultaneous HPLC
assay methods (Keyur et al., 2012, Chandra et al., 2012) and
stability indicating HPLC method (Rajesh et al., 2012) have been
However, few UV (Patel et al., 2012, Anantha et al.,
2009) HPLC methods (Teja deepthi et al., 2013) for simultaneous
estimation of these drugs have been reported. Detailed study revealed that none of the method revealed all possible impurities nor attempted for identification of degradants. An extensive review of literature did not revealed any stability indicating RP-HPLC method for the simultaneous analysis of DIC and TRA. Hence there is a need to develop stability indicating assay method for simultaneous analysis of DIC and TRA and to demonstrate and identify possible degradation products which are likely to form in long term storage conditions of their products. The tablet dosage form containing DIC (75 mg and TRA 50 mg) was approved in November 2011 by Central Drugs Standards Control Organization (CDSCO), Government of India. The formulation is approved as bilayer tablet in which DIC incorporated in sustained release layer and TRA incorporated immediate release layer. It is under development stage for the symptomatic treatment of moderate to
severe pain in adults. However, few UV (Patel et al., 2012,
Anantha et al., 2009) HPLC methods (Teja deepthi et al., 2013)
for simultaneous estimation of these drugs have been reported. To date, no stability Indicating HPLC method has been reported, so there is a need to develop stability indicating assay method for simultaneous analysis of DIC and TRA.
EXPERIMENTAL
Materials and Reagents
Samples of Tramadol HCl and Diclofenac Sodium were obtained as gift sample from Aurobindo Pharma Ltd, Hyderabad Pvt. Ltd (India). Tablet formulation of Tramadol HCl and Diclofenac Sodium were procured from commercial market. All the solutions were protected from light and were analyzed on the day of preparations. Glass wares used in each procedure were soaked overnight in a mixture of chromic acid and sulphuric acid rinsed thoroughly with double distilled water and dried in hot air oven. All the reagents were of analytical-reagent (AR) grade unless stated otherwise. Millipore water, HPLC grade methanol, n-heptane sulfonic acid (HSA), ortho phosphoric acid (OPA) solution were procured from Merck, India. Borosilicate (Class – A) glass wares were used. The impurities D2, D14, D16 procure from Sigma Aldrich Ltd, wheras D9, D10, D12, D15 are well established impurities (RS) and are official in pharmacopoeia. These impurities were isolated through flash LC system and were used for identification.
Instrumentation
HPLC analysis was performed with Agilent-1200 binary pump plus manual sampler and Agilent photo diode-array detector (PDA). The output signal was monitored and processed using Ezchrome Elite software resident in a Pentium computer (Digital Equipment). Compounds were separated on a 250 mm-4.6 mm(id),
5µm particle size, Agilent C18 column with methanol and water
(61:39 v/v) with 0.2 % (w/v) n-heptanesulfonicacid (HSA), and pH
of aqueous phase was adjusted to 3.0 with ortho phosphoric acid
(OPA) as mobile phase. The injection volume was 20 µL and eluents detected at 219 nm with the flow rate 1.0 ml/min.
Analysis of Formulation
The assay of commercial tablets was established with present chromatographic condition developed and it was found to be more accurate and reliable. To determine the content of TRA and DIC in conventional tablet (50mg TRA/75mg DIC) twenty tablets were weighed; their mean weight was determined and was finely powdered. Tablet powder equivalent to 20 mg TRA with relevant quantities of DIC was weighed and transferred to a 100 ml volumetric flask, extracted for 30mins with methanol and volume was made up to 100 ml with diluents(methanol). 1 ml of above solution was taken in 10ml volumetric flask and volume was made up to 10 ml with mobile phase, and final solution (20µg TRA, 30µg DIC/ml) was filtered through 0.45 µ millipore filter and it was analyzed by HPLC system, as shown in Table 1.
Table1: Analysis of Commercial Formulation (n =6).
Label claim (mg/tablet)
Amount Found (mean ± SD)
Assay (%) % RSD TRA-50 DIC-75 49.12±0.66 74.17±0.65 98.2 98.8 1.31 0.83
Preparation of standard drug solutions
Stock solution of Tramadol HCl and Diclofenac Sodium was prepared by dissolving 10 mg of each in separate 10 mL of volumetric flask with small quantity of methanol. The mixture was sonicated for about 5min and then made up to volume with methanol. From the stock solution final concentrations was prepared.
Forced Degradation Studies
Forced degradations of drug substances were carried out under neutral, acidic, basic, oxidative, thermal and photolytic stress conditions. In stress study, aliquots of stress sample were diluted with mobile phase to a concentration of 100 μg/ml. The pH of stress sample was adjusted to 3 - 4 and injected in optimized condition with appropriate blank. The samples from acid hydrolysis were neutralized with 1N NaOH and the samples from base hydrolysis were neutralized with 1N HCl.
Preparation of Stock Solution for stress studies
10 mg of each drug substance was accurately weighed and transferred in to 10 ml volumetric flask, dissolved completely in methanol and the volume was made up to get 1000 μg/ml. The same procedure was adapted to prepare stress solutions of acid hydrolysis, base hydrolysis and oxidative stress respectively with
1N HCl, 1N NaOH and 3% H2O2. Thermal degradation was
carried out for solid state samples by heating in hot air oven at 100º C for a period of 2 hr. Photo degradation was carried for solution samples under sunlight. In all stress studies, stress was induced for TRA (control), DIC (control) and for combination of both. Result of degradation studies of TRA and DIC was
Hydrolysis
The stock solutions of 1000 μg/ml were prepared in 1N NaOH (Basic), 1N HCl (Acidic) and water (neutral) at room temperature. 1 ml volume of sample was withdrawn at different time points and made to 10 ml with mobile phase (100 μg/ml). The samples were neutralized to pH 3-4 to protect the silica based column. Blank solutions for each hydrolysis were prepared at the same time of preparation of stock solutions. Both blank and samples were injected in optimized condition.
Hydrogen Peroxide-Induced Degradation
1 ml of sample solution was withdrawn from stock
solution (1000μg/ml) containing oxidizing agent (H2O2) and
transferred into 10 ml volumetric flask. The volume was made up to the mark to get the 100 µg/ml and injected in optimized conditions at various time intervals against blank.
ThermalDegradation
For, Solid state stability, it was performed on preheated sample at 100º C. At various time intervals, 10 mg of samples were weighed, dissolved in methanol and suitably diluted to a concentration of 100 μg/ml and injected into the system.
Photochemical Degradation
Photo degradation studies were conducted by exposing the solution sample in sunlight for a total period of 12 hr. After degradation, sample was suitably diluted in mobile phase to a concentration of 100 μg/ml and then injected.
Identification of impurities
Impurities namely, 3-hydroxybenzoic acid (D2), 3-( (dimethyleamino) methyl) cyclohexanone (D9), (2(4-methoxyphenyle) cyclohex-2enyle)-N,N-dimethyle methanamine (D10), ( 2-(2,6-dichlorophenyleamino)phenyl) methanol (D12),
2(2-hydroxyphenyle) acetic acid D(14),
1-(2,6-dichlorophenyle)indolin-2-one D(15), 2,6-dichlorobenzeneamine D(16) suitably dissolved and diluted in mobile phase at a
concentration of 100 μg ml-1
and spiked with injection of standards of DIC and TRA under optimized chromatographic conditions. Retention time of the impurities was compared with the degradation products of stress studies. It was identified that D2, D9 and D10 belong to tramadol, while D12, D14, D15 and D16 belong to diclofenac.
RESULTS
Optimized conditions
In this communication, the method was optimized on Agilent Qualisil ODS column C18 (25 cm × 4.6 mm; particle size 5 µm) with a mobile phase composition methanol – water 61: 39
% v/v, containing 0.2 % n-heptanesulphonicacid (HSA); pH
adjusted to 3.0. The flow rate was 1 ml/min and the photo diode array (PDA) detection wavelength was 219 nm. Retention times were optimized to 5.90 ± 0.2 min and 26.3 min, respectively for
TRA and DIC. The retention time of diclofenac window was observed between 24.5 to 27.5 min. It is absolutely due to effect of HSA concentration, pH and varied void volume. However the specificity and %RSD for diclofenac were within the limit.
Validation of the Stability-Indicating Method
Method was validated as per ICH (Q2) guidelines with respect to specificity, linearity and range, accuracy, precision, robustness, limit of detection and limit of quantification (ICH Q2).
Specificity
Forced degradation studies were performed on TRA and DIC to support the specificity of the stability- indicating method. The study was employed on degradation of TRA and DIC by exposing to sun light (for 12 hr), heat (100 °C for 2 hr), acid
hydrolysis (1 N HCl, kept at RT for12 hr), base hydrolysis (1 N
NaOH, kept at RT for 48 hr), water hydrolysis (kept at RT for 5
days) and oxidation (3% H2O2, kept at RT for 3 days). All
degradants adequately separated from
TRA and DIC, thus the specificity of the method was proven. The peak purity was assessed based on purity angle and purity threshold in which both degraded and control samples chromatogram showed peak purity in the range of 0.9981-0.9998.
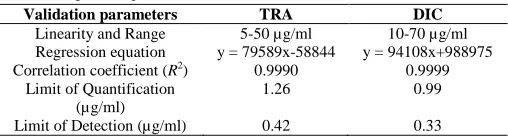
LinearityandRange
The linearity of the method was proven at concentrations of TRA and DIC in the range 5- 50 μg/ml and 10-70 μg/ml, respectively (Table 2). The correlation coefficient (r2 value) obtained was 0.9990 for TRA and 0.9999 for DIC, as shown in Table 2.
Table 2: Regression parameters, LOD and LOQ.
Validation parameters TRA DIC
Linearity and Range 5-50 µg/ml 10-70 µg/ml Regression equation y = 79589x-58844 y = 94108x+988975 Correlation coefficient (R2) 0.9990 0.9999
Limit of Quantification (µg/ml)
1.26 0.99
Limit of Detection (µg/ml) 0.42 0.33
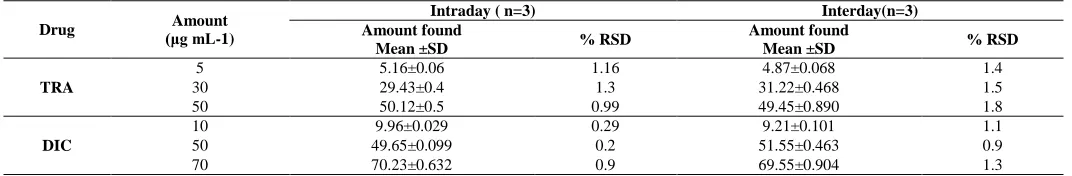
Precision
The % RSD for intraday and interday precision studies were obtained from three different concentrations (5, 30 and 50 μg/ml for TRA and 10, 50 and 70 μg/ml for DICs) within linearity range. The % RSD values for intraday and interday precision were below 1.5 %, indicated that the method was sufficiently precise, as shown in Table 3.
Recovery Studies
Robustness
The robustness of the developed method was determined by analyzing the samples under deliberate change in method parameters, such as change in flow rate (±0.1 ml/min), pH (±0.2) of the buffer, % HSA concentration and Organic phase (±2%). The method was found to be robust for all the parameters tested for USP tailing, USP plate count and % RSD except for % HSA and it should be between 0.15 and 2.0 %. % HAS affect the retention of diclofenac.
Limit of Detection and Limit of Quantification
LOD and LOQ were determined based on signal to noise ratio. The ratio of 3:1 was taken as LOD and signal-to-ratio of 10:1 was taken as LOQ. LOD was found to be 0.42 μg /ml and 0.33μg/ml while LOQ was 1.26 μg/ml and 0.99 μg/ml, respectively for TRA and DIC. The same concentrations were prepared and analyzed in triplicate, as shown in Table 2.
Forced Degradation
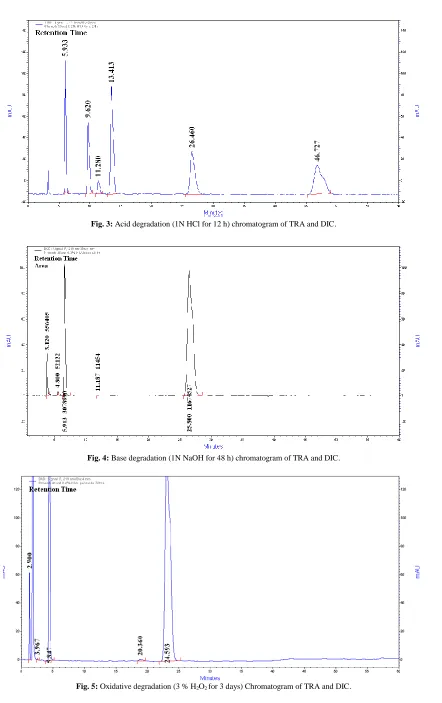
Acid-Induced Degradation
Initial degradation study was performed in 0.1N HCl, observed that the drug was stable or showed negligible degradation. So, increasing in the strength of the acid is needed to get the sufficient degradation from the drug substances. Upon treatment with 1N HCl at RT for 12 h, sufficient degradation was 9.8% for TRA and 29% for DIC observed and it was considered as
optimized for specificity. There were five degradant peaks, 3.1 min (D1), 9.6 min (D8) 11.2 min (D11), 13.41 min (D12), 46.7 min (D17) were formed, as shown in Figure 3.
Base-Induced Degradation
When the drug was exposed to 0.1N NaOH, sufficient degradation was not observed hence a severe condition of 1N NaOH was chosen as stress condition. The drug degradation was
12.3% for TRA and 7.9% for DIC in 48 h with two impurities i.e. 3.120 min (D1), 4.800 min (D4), as shown in
Figure 4.
Neutral Hydrolysis
The degradation of 11.2% degradation was observed for TRA after 5 days at room temperature, but no degradation was observed for DIC. A total two impurities i.e. 4.02 min (D2), 4.80 min (D4), as shown in Figure 8.
Hydrogen Peroxide-Induced Degradation
Both TRA and DIC showed negligible / no degradation
in 3% H2O2 for 5 days and hence severe stress condition of 3%
H2O2 was used. The TRA showed 14.5% and DIC showed
9.6% degradation at 3days. Three degradants were formed i.e. 2.7 min (D1), 3.96 min (D2), 20.360 min (D15), as shown in
Figure 5.
Table 3: Precision Studies.
Drug (μg mL-1) Amount
Intraday ( n=3) Interday(n=3)
Amount found
Mean ±SD % RSD
Amount found
Mean ±SD % RSD
TRA
5 5.16±0.06 1.16 4.87±0.068 1.4
30 29.43±0.4 1.3 31.22±0.468 1.5
50 50.12±0.5 0.99 49.45±0.890 1.8
DIC
10 9.96±0.029 0.29 9.21±0.101 1.1
50 49.65±0.099 0.2 51.55±0.463 0.9
70 70.23±0.632 0.9 69.55±0.904 1.3
Table 4: Recoverystudies (n = 3).
Recovery Level
TRA DIC Amount Added (µg/ml) Amount Recovered (µg/ml) % Recovery Amount Added (µg/ml) Amount Recovered (µg/ml) % Recovery
80 % 16 16.26 101.6 24 23.71 98.8
100 % 120 % 20 24 19.86 23.84 99.3 99.4 30 36 29.68 36.01 98.8 100.0
Table 5: Comparative study of degradation data of DIC and TRA: Control Vs Combination.
Stress (Conditions)
% degradation Impurities (DX) x = 1, 2, 3…
Control Combination Control Combination
TRA DIC TRA DIC TRA DIC TRA DIC
Neutral (5 days) 10.1 -- 11.2 0 D2, D4 -- D2, D4 --
1N HCl (12 h) 10.1 35.3 9.8 29 D1 D8, D11, D12, D17 D1 D8, D11, D12, D17
1N NaOH (48 h) 14.4 7.4 12.3 7.9 D1, D4 --- D1, D4 ---
Peroxide (72 h) 9.8 8.7 14.5 9.6 D1, D2 D15 D1, D2 D15
Thermal 100ºC; 2 h 17.5 5.2 18.6 10.3 D3, D4, D9, D10 D5, D6 D3, D4, D9,D10 D5, D6
H N
Cl
Cl OH
O
O H3C
H HO
N CH3
CH3
Cl
Cl N O
H N
R2
Cl R1
Impurity A
Impurity B : R1 = CHO, R2 = Cl
Impurity C : R1 = CH2OH, R2 = Cl
Impurity D : R1 = CH2-COOH, R2 = Br
N H
O
Impurity E
O H3C
H HO
N CH3
CH3
O H3C
O H3C
H HO
N CH3
CH3
O H3C
N N
Diclofenac
Tramadol Impurity A (Trans impurity)
Impurity B Impurity C
Impurity D
Fig. 1: Structures of Diclofenac and Tramadol and their identified degradants.
Fig. 3: Acid degradation (1N HCl for 12 h) chromatogram of TRA and DIC.
Fig. 4: Base degradation (1N NaOH for 48 h) chromatogram of TRA and DIC.
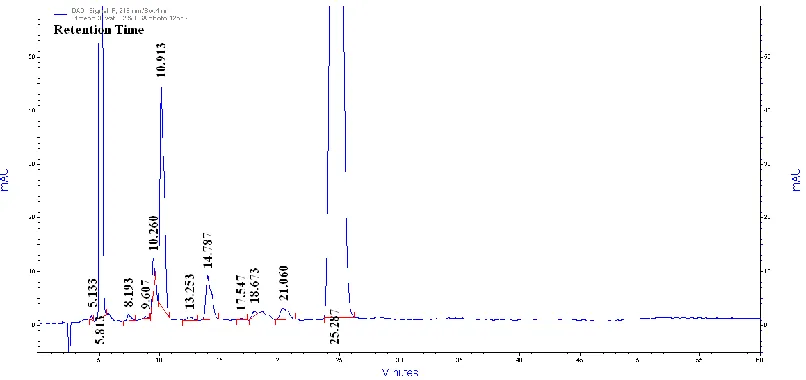
Fig. 6: Photo degradation (sunlight for 12 h) chromatogram of TRA and DIC.
Fig. 7: Thermal degradation (100º C for 6 h) chromatogram of TRA and DIC.
Thermal-Induced degradation
When drugs were exposed to dry heat in oven at 100°C for 2h, 6 degradation products were formed at 4.147 min (D3), 4.947 min (D4), 5.553 min (D5), 6.80 min (D6), 10.153 min (D9) and 10.860 min (D10) with significant change in peak area of the parent drug. The TRA showed 18.6% and DIC showed 10.3% of degradation, as shown in Figure 7.
Photochemical Degradation
Drugs were exposed to photolytic degradation in sunlight for 12 hr, 15.2% and 30.4% degradation was observed for TRA and DIC respectively. Nine degradants were formed at 4.9 min (D4), 8.1 min (D7), 9.6 min (D8), 10.2 min (D9), 10.9 min (D10), 13.253 min (D12), 14.7 min (D13), 18.673 min (D14) and 21.03
min (D16), as shown in Figure6.
DISCUSSION
For optimization of the chromatographic conditions and to obtain symmetrical peaks with better resolution and peak purity, various conditions such as composition of mobile phase, pH, and different concentrations of ion-pair reagents were tried to achieve suitable condition for simultaneous analysis of Tramadol HCl and Diclofenac Sodium. In this study, Agilent Qualisil ODS column C18 (25 cm × 4.6 mm; particle size 5 µ) was used as stationary phase. The flow rate was 1 ml/min and the photo diode array (PDA) detection wavelength was 219 nm. Various trials with
methanol and water as mobile phase (70:30 v/v to 50:50 v/v) were
performed, and TRA was not retained and DIC was observed in between 11 - 28 min with acceptable tailing. To retain TRA, 0.2% HSA was added to the aqueous phase and the pH adjusted to 3.0±0.2 with orthophosphoric (OPA) acid. HSA selectively retained TRA and not shown effect on DIC. Finally, retention times were optimized to 5.92 ± 0.1 min and 26.3±0.4 min, respectively for TRA and DIC using 39% of aqueous phase. The method was validated as per ICH Q2 guidelines.
The validated method was used in quantification of TRA and DIC in a variety of stress conditions of acidic, basic, oxidation, photolytic, neutral and thermal degradation. The present stress studies revealed that TRA was more sensitive for thermal whilst DIC degraded drastically under sunlight and acidic stress. However both drugs showed significant degradation in all conditions indicated the labile nature of dosage form during storage conditions. In detailed observation of results, there were few impurities notified in formulation when compared to control. Degradants D8 and D16, respectively under thermal and photolytic conditions were not observed in control. However the rate of degradation for DIC was found to be enhanced under thermal and photolytic degradations and in control DIC degradation declined under acidic stress.
The study revealed that DIC was found to be more labile for photolysis and acid hydrolysis but unaffected in neutral solution, where as TRA was affected all conditions in which negligible degradation was observed under acidic conditions.
While comparing dosage stress of TRA and DIC to control stress conditions, it was observed that degradation rate was increased for DIC under alkaline stress, where as photolytic degradation was also increased. A total of 17 degradants were observed in the present forced degradation study for TRA and DIC. The peak purity of both TRA and DIC was more than 0.999 in all stress conditions investigated. A total of 17 degradants (D1 – D17) were detected in the present study, among them, structures of D2, D9, D10, D12, D14, D15, D16 were identified by Spike analysis (Fig. 1). 3-hydroxybenzoic acid (D2), 3-((dimethyleamino) methyl) cyclohexanone (D9), ( 2 (4-methoxyphenyle)
cyclohex-2enyle)-N,N-dimethyle methanamine (D10), ( 2-
(2,6-dichlorophenyleamino) phenyl) methanol (D12),
2(2-hydroxyphenyle) acetic acid D(14), 1-(2,6-dichlorophenyle) indolin-2-one D (15), 2,6-dichlorobenzeneamine D(16) suitably prepared in mobile phase at a concentration of 100 μg/ml and
spiked with injection of standards under optimized
chromatographic conditions. Retention time of the impurities was compared with the Stress degradation products. It was identified that D2 (3.9 min), D9 (10.2 min) and D10 (10.9 min) belongs to Tramadol HCl, while D12 (13.4 min), D14 (18.6 min), D15 (20.3), D16 (21.03) belongs to Diclofenac Sodium.
CONCLUSION
A simple, fast and accurate stability indicating RP-HPLC-DAD method is described for simultaneous determination of Tramadol HCl and Diclofenac sodium in pharmaceutical formulations. The developed method was validated by testing its linearity, accuracy, precision, limits of detection and quantitation and specificity. The method is good enough to separate the peaks of active pharmaceutical ingredients (APIs) from the degradation products (produced during forced degradation studies) and concluded that the method can be successfully used for detect and identify any kind of degradants during stability studies of tablet dosage forms.
ACKNOWLEDGMENT
The authors wish to thank the Hetero laboratories Pvt. Ltd, Hyderabad, India.
Financial support and sponsorship: Nil.
Conflict of interests: There are no conflicts of interest.
REFERENCES
Ahmed M, Jalil R, Islam MA, Shaheen SM. Preparation and Stability Study of Diclofenac Sodium Suppositories.Pak J Biol Sci, 2000; 3: 1755-1757.
Ali NW, Hegazy MA, Abdelkawy M, Abdelaleem EA. Simultaneous Determination of Methocarbamol and Ibuprofen or Diclofenac Potassium Using Mean Centering of the Ratio Spectra Method. Acta Pharm, 2012; 62: 191–200.
Method for Simultaneous Estimation of Tramadol Hydrochloride and Diclofenac Sodium in their Combined Dosage Form. Eur J Chem, 2009; 6: 541-554.
Archana, MA, Vishnu C, Kunal Ingale. Development and Validation of a Stability-Indicating LC Method for Simultaneous Analysis of Drotaverine Hydrochloride and Diclofenac Potassium and its Application for Formulation Analysis. Int J Pharma Sci Rev Res, 2012; 12: 132-136.
Chandra P, Rathore AS, Lohidasan S, Mahadik KR. Application of HPLC for the Simultaneous Determination of Aceclofenac, Paracetamol and Tramadol Hydrochloride in Pharmaceutical Dosage Form. Sci Pharma, 2012; 80: 337–351.
Degwy MA, Aly M, Mamdouh SE. Development and Validation of a HPLC Method for In-Vivo Study of Diclofenac Potassium. Int J Pharm Sci Res, 2013; 4: 622-627.
Gowramma B, Rajan S, Muralidharan S, Meyyanathan SN, Suresh BA. Validated RP-HPLC Method for Simultaneous Estimation of Paracetamol and Diclofenac Potassium in Pharmaceutical Formulation. Int J ChemTech Res, 2010;2: 676-680.
International Council on Harmonisation (ICH) Harmonized tripartite guidelines. Validation of Analytical Procedures: Text and Methodology. Q2(R1), 1995.
Jadhav SD, Butle SR, Patil SD, Jagtap PK. Validated Stability Indicating RP-HPLC Method for Simultaneous Determination
and in Vitro Dissolution Studies of Thiocolchicoside and Diclofenac potassium from Tablet Dosage form. Arabian J Chem, 2015;
8:118-128.
Jignesh MP, Prajapati HR. Development and Validation of Derivative Spectrophotometric Method for the Quantitative Estimation of Tramadol Hydrochloride and Aceclofenac in Tablet Dosage Forms. J Pharm Res, 2011; 4: 2950-2953.
Keyur BA, Emanual MP, Falgun AM. Simultaneous Estimation of Tramadol HCl, Paracetamol and Domperidone in Pharmaceutical Formulation by RP-HPLC Method. J Chromatogr Sep Tech, 2012; 3: 1-5
Nag SN, Gouthami B, Madhuri L, Krishnaveni N, Meyyanathan SN, Suresh B. Development and Validation of a RP-HPLC Method for the Simultaneous Determination of Paracetamol and Diclofenac Potassium on Stainless Steel Surface of Pharmaceutical Manufacturing Equipments. J Chem Pharm Res, 2012; 4: 1670-1675.
National center for Biotechnology Information.PubChem
Compound Database; CID= 3033,
https://pubchem.ncbi.nlm.nih.gov/compound/3033(accessed Feb.20,2017) Panda SS, Patanaik D, Kumar BV. New Stability-Indicating RP-HPLC Method for Determination of Diclofenac Potassium and Metaxalone from their Combined Dosage Form. Sci Pharm, 2012; 80: 127–137.
Patel SA, Prajapati KM. Spectrophotometric Method for the Simultaneous Determination of Chlorzoxazones and Diclofenac Sodium in Synthetic Mixture. Int Res J Pharm, 2012; 3: 293-296.
Patel A, Patel J, Shah A. Development and Validation of First Order Derivative Spectrophotometric Method for Simultaneous Estimation of Tramadol Hydrochloride and Diclofenac Sodium in Tablet Dosage Form. Int J Pharma Sci, 2012; 56: 496-500.
Rajeevkumar SR, Manatragada VR, Sangeeta JS, Raju VK. A Stability Indicating GC-FID Method for Camylofin Dihydrochloride and Diclofenac Potassium in Pharmaceutical Preparation. Int J Pharma Sci, 2011;4: 317-324.
Rajesh MK, Shrawan GS. Stability-Indicating RP-HPLC Method for Analysis of Paracetamol and Tramadol in a Pharmaceutical Dosage Form. E-J Chem, 2012; 9: 1347-1356.
Rathnam MV, Singh RR. Simultaneous RP HPLC Determination of Camylofin Dihydrochloride and Diclofenac Potassium in Pharmaceutical Preparations. Pharm Anal Acta, 2010; 1: 1-4.
Sarfraz A, Sarfraz M, Ahmad M. Development and Validation of a Bioanalytical Method for Direct Extraction of Diclofenac Potassium from Spiked Plasma. Trop J Pharm Res, 2011; 10: 663-669.
Teja deepthi M, Ramalingam P, Ravindra Reddy J. A New Validated RP-HPLC Method for Simultaneous Determination of Tramadol Hydrochloride and Diclofenac Sodium in Pharmaceutical Dosage Form. Inventi Rapid: Pharma Anal Qual Assu, (2013); 2: 1-8.
How to cite this article: