Alireza Esteghamati
1, A, E, F, Ali Zandieh
1, A–D, Afshin Saadipoor
1, B, C,
Nima Hafezi-Nejad
1, B–D, Sina Noshad
1, B–D, Abdoulreza Esteghamati
1, 2, E, F,
Seyedomid Seyedahmadinejad
1, B, Manouchehr Nakhjavani
1, E, FThe Role of Metabolic Syndrome and Related
Clinical Variables in Determining CEA Levels
1 Endocrinology and Metabolism Research Center (EMRC), Vali-Asr Hospital, School of Medicine,
Tehran University of Medical Sciences, Tehran, Iran
2 Department of Pediatrics, School of Medicine, Iran University of Medical Sciences, Tehran, Iran
A – research concept and design; B – collection and/or assembly of data; C – data analysis and interpretation;
D – writing the article; E – critical revision of the article; F – final approval of article; G – other
Abstract
Objectives. The aim of the study was to investigate how metabolic syndrome (MetS) and related clinical variables correlate with high levels of carcinoembryonic antigen (CEA).
Material and Methods. Variables related to MetS as well as the serum CEA levels of 366 subjects were assayed. Logistic regression analyses were used to determine the associations between various clinical variables and high CEA levels, which were defined as values greater than the median (i.e., 1.4 ng/mL).
Results. MetS, as an entity, and diabetes were more prevalent in subjects with high CEA levels (for MetS: 64.2% in subjects with CEA ≥ 1.4 vs. 51.1% in subjects with CEA < 1.4 ng/mL, p < 0.05; for diabetes: 72.6% vs. 59.1% respec-tively, p < 0.05). Waist circumference, triglycerides, fasting plasma glucose (FPG), homeostasis-model assessment of insulin resistance index (HOMA-IR), and HbA1c as well as systolic and diastolic blood pressures were directly
associated with CEA levels, after adjusting for age and sex (p < 0.05). Subjects with a greater number of MetS components tended to have high CEA levels. Multivariate regression analysis revealed that the association of waist circumference and FPG with CEA is independent of other MetS components, age and sex.
Conclusions. MetS and related clinical variables contribute to CEA values. Thus, the reference interval of CEA may differ according to the clinical status of the subjects (Adv Clin Exp Med 2014, 23, 6, 907–912).
Key words: CEA, metabolic syndrome, obesity, insulin resistance.
Adv Clin Exp Med 2014, 23, 6, 907–912 ISSN 1899–5276
ORIGINAL PAPERS
© Copyright by Wroclaw Medical University
Carcinoembryonic antigen (CEA), a glyco-protein with a molecular weight of approximately 200 kDa, is widely used as a tumor marker for ade-nocarcinomas, particularly colorectal cancer [1, 2]. It is also expressed in a number of normal tissues including the tongue, esophagus, stomach, colon, cervix and prostate [3]. Besides cancer, CEA is re-lated to several non-malignant conditions such as renal and hepatic failure, pulmonary disease, chronic inflammatory disease and aging [4–8].
Metabolic syndrome (MetS) refers to a clus-tering of various cardiovascular and diabetes mel-litus risk factors including central obesity, dyslip-idemia, insulin resistance and hypertension [9]. MetS is highly prevalent and is an increasingly common medical condition globally [10, 11]. The
underlying pathophysiological pathways involved in the clustering of MetS components are not ful-ly understood [12]. However, insulin resistance has been regarded to play an important role in the pathogenesis of MetS [13]. In addition to cardio-vascular diseases and diabetes, subjects with MetS are also prone to certain types of malignancies (e.g. colorectal cancer) [14–16]. Furthermore, a review of previous studies shows that the odds of having MetS increases with age, which per se augments the risk of some cancers [17, 18].
This study is the first to report on the correlations between high CEA levels and wide variety of MetS- -related variables.
Material and Methods
Participants
A total of 366 individuals (aged 30 to 70 years) who visited an outpatient clinic of Vali-Asr hospital (a Tehran University-affiliated medical center) from June 2008 to March 2012 were enrolled in the cur-rent study. The participants enrolled were both in-dividuals seeking health examinations and those who accompanied patients. Most subjects asking for health examinations were short-term diabetic pa-tients, and the reason for referring them to the clin-ic was to monitor blood glucose levels. Individuals with a prior diagnosis of any cancer, hepatic, renal, thyroid or adrenal problems, as well as those taking insulin, antihypertensive medications or lipid modi-fying agents were excluded from the study. Individu-als with a smoking habit were Individu-also excluded. Diabetic participants were receiving metformin, glibenclamide or both concurrently to control their glycemic status. Oral informed consent was obtained from all partic-ipants before the study commenced. The study was performed in line with the Helsinki declaration and the recommendations of the local ethics review com-mittee of Tehran University of Medical Sciences.
Assessments
Waist circumference was measured to the near-est 0.1 cm at the end of a normal expiration in stand-ing position at the midpoint between the iliac crest and the rib cage. After resting for at least 5 min, sys-tolic and diassys-tolic blood pressures were measured twice, separated by an interval of at least 5 min. The average of these 2 measurements was used in the analyses. Venous blood samples were collected after a 12-h overnight fast. Fasting plasma glucose (FPG) was measured by a glucose oxidase test (intra- and inter-assay coefficients of variation less than 2.1 and 2.6, respectively). Triglycerides, high density poprotein-cholesterol (HDL-C), and low density li-poprotein-cholesterol (LDL-C) were assayed by en-zymatic techniques (Parsazmun, Karaj, Iran), and apolipoproteins A-I and B were determined by the immunoturbidimetric method (Roche, Basel, Swit-zerland). For apolipoprotein A-I the intra- and in-ter-assay coefficients of variation were lower than 1.0 and 2.4, and for apolipoprotein B these values were lower than 1.2 and 3.2, respectively. Hemoglo-bin A1c (HbA1c) was assessed using the high
perfor-mance liquid chromatography method. Insulin was
determined by radioimmunoassay, using an anti-body with no cross-reactivity for pro-insulin and C-peptide (Immunotech, Prague, Czech Republic). The intra- and inter-assay coefficients of variation were lower than 4.3 and 3.4, respectively. C-pep-tide was measured by radioimmunoassay (Immu-notech, Prague, Czech Republic). CEA was mea-sured using the electrochemiluminescent method (Roche, Basel, Switzerland). Finally, alanine ami-notransferase (ALT), aspartate amiami-notransferase (AST), and alkaline phosphatase (ALP) were also assessed, using commercial available kits.
The homeostasis model assessment of insulin re-sistance (HOMA-IR) was calculated as fasting insu-lin (U/L) × fasting plasma glucose (mg/dL)/405 [19]. MetS was defined in accordance with the modified International Diabetes Federation (IDF) criteria. Ac-cording to these criteria, abdominal obesity (i.e. waist circumference ≥ 90 cm in both men and women) must be present, along with any 2 or more of the fol-lowing conditions: elevated blood pressure (systolic blood pressure ≥ 130 mm Hg and/or diastolic blood pressure ≥ 85 mm Hg) or treatment for previous-ly diagnosed hypertension, low HDL-C (< 40 mg/ /dL and < 50 mg/dL in men and women, respective-ly) or on HDL-C therapy, triglycerides ≥ 150 mg/dL or on triglyceride therapy and fasting plasma glu-cose ≥ 100 mg/dL (or diabetes) [9].
Statistical Analysis
The subjects were divided into 2 groups accord-ing to their CEA levels. Continuous and categorical variables were compared between these 2 groups, us-ing Student’s T-test and the c2 test, respectively. A
lo-gistic regression analysis was run separately for each variable, with age and sex as co-variates. In all the regression analyses, the CEA was treated as the de-pendent variable in the dichotomous form of low-er/higher than the median. Additionally, consid-ering subjects with no MetS component and those with one MetS component together as the reference group, the odds ratios of having 2, 3, or > 3 MetS components was also calculated. Then, a multivari-ate regression model was designed to evalumultivari-ate the as-sociation of various clinical variables with CEA. The data were analyzed using SPSS software (version 16.0; SPSS Inc., Chicago, USA), and the p value < 0.05 was considered statistically significant.
Results
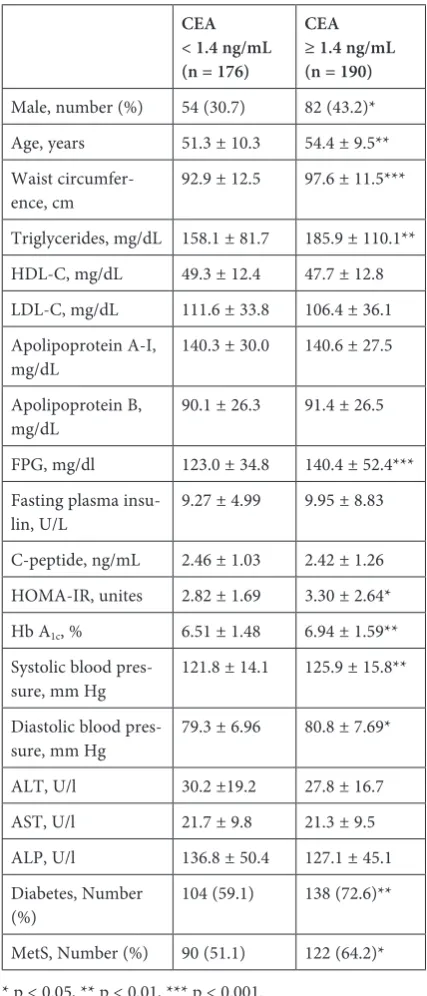
principal characteristics of the subjects stratified by CEA at the median. Subjects with CEA levels high-er than the median also had highhigh-er waist circum-ference, triglycerides, FPG, systolic and diastol-ic blood pressures (p < 0.05). Thus, among MetS components, only HDL-C was not statistically dif-ferent between subjects with high and low levels of CEA. Subjects with CEA levels greater than the median, were older and were comprised of a high-er proportion of men (p < 0.05). Furthhigh-er, the fre-quencies of diabetes and MetS were higher in sub-jects with CEA ≥ 1.4 ng/mL (p< 0.05).
Table 2 shows the odds ratios of various vari-ables for CEA ≥ 1.4 ng/mL after adjusting for age and sex. HDL-C was determined to be the only MetS components which was not associated with high CEA levels. Among insulin resistance mea-sures, FPG, HOMA-IR and HbA1c were associated
with CEA (p< 0.05). In addition, subjects with ei-ther 4 or all 5 components of MetS were more like-ly to have high CEA levels than those who had one or no MetS component (p < 0.05).
The traditional components of MetS that were initially associated with CEA (i.e., waist cir-cumference, triglycerides, FPG and systolic blood pressure), along with age and sex, were entered to a multiple regression analysis model (Table 3). It was found that triglycerides and systolic blood pressure cannot be regarded as independent de-terminants of CEA. In contrast, the associations of
Table 1. Principal characteristics of the study population
CEA < 1.4 ng/mL (n = 176)
CEA ≥ 1.4 ng/mL (n = 190)
Male, number (%) 54 (30.7) 82 (43.2)*
Age, years 51.3 ± 10.3 54.4 ± 9.5**
Waist
circumfer-ence, cm 92.9 ± 12.5 97.6 ± 11.5***
Triglycerides, mg/dL 158.1 ± 81.7 185.9 ± 110.1**
HDL-C, mg/dL 49.3 ± 12.4 47.7 ± 12.8
LDL-C, mg/dL 111.6 ± 33.8 106.4 ± 36.1
Apolipoprotein A-I,
mg/dL 140.3 ± 30.0 140.6 ± 27.5
Apolipoprotein B,
mg/dL 90.1 ± 26.3 91.4 ± 26.5
FPG, mg/dl 123.0 ± 34.8 140.4 ± 52.4***
Fasting plasma
insu-lin, U/L 9.27 ± 4.99 9.95 ± 8.83
C-peptide, ng/mL 2.46 ± 1.03 2.42 ± 1.26
HOMA-IR, unites 2.82 ± 1.69 3.30 ± 2.64*
Hb A1c, % 6.51 ± 1.48 6.94 ± 1.59**
Systolic blood
pres-sure, mm Hg 121.8 ± 14.1 125.9 ± 15.8**
Diastolic blood
pres-sure, mm Hg 79.3 ± 6.96 80.8 ± 7.69*
ALT, U/l 30.2 ±19.2 27.8 ± 16.7
AST, U/l 21.7 ± 9.8 21.3 ± 9.5
ALP, U/l 136.8 ± 50.4 127.1 ± 45.1
Diabetes, Number
(%) 104 (59.1) 138 (72.6)**
MetS, Number (%) 90 (51.1) 122 (64.2)*
* p < 0.05, ** p < 0.01, *** p < 0.001.
Data are presented as mean ± standard deviation (SD) unless otherwise stated.
Table 2. Age- and sex-adjusted odds ratios of various clinical variables for CEA ≥ 1.4 ng/mL
Odds
ratio 95% confi-dence interval
Waist circumference, cm 1.035*** 1.016, 1.055
Triglycerides, mg/dL 1.003** 1.001, 1.006
HDL-C, mg/dL 0.988 0.972, 1.005
LDL-C, mg/dL 0.997 0.991, 1.003
Apolipoprotein A-I, mg/dL 1.001 0.994, 1.009
Apolipoprotein B, mg/dL 1.003 0.995, 1.011
FPG, mg/dl 1.025* 1.003, 1.047
Fasting plasma insulin,
U/L 1.024 0.991, 1.057
C-peptide, ng/mL 1.007 0.768, 1.321
HOMA-IR, unites 1.127* 1.016, 1.250
HbA1c,% 1.161* 1.006, 1.340
Systolic blood pressure,
mm Hg 1.019* 1.004, 1.033
Diastolic blood pressure,
mm Hg 1.029* 1.000, 1.059
MetS components
Any 2 components1 1.531 0.816, 2.872
Any 3 components1 1.694 0.905, 3.171
Any 4 or more compo-nents1
3.765* 1.050, 7.279
* p < 0.05, ** p < 0.01, *** p < 0.001.
Odds ratios are estimated for one-unit increases in each of the variables unless otherwise stated.
1 Odds ratios are determined for existence of a condition
waist circumference and FPG with high CEA levels were independent of age, sex and other MetS com-ponents (p < 0.05).
Discussion
The current study is the first to evaluate the association of a large number of clinical variables with CEA. Among MetS components, HDL-C was the only variable that was not associated with CEA. Although triglycerides and systolic blood pressure were initially identified as determinants of high CEA levels, they did not remain in the model after adjusting for waist circumference and FPG. In contrast, waist circumference and FPG correlated with high CEA levels independently of age, sex, and other MetS components.
The association of MetS and its components with colorectal cancer has been the subject of sev-eral studies [14, 20–22]. Studies reporting the as-sociation between CEA and MetS and its compo-nents are limited. In the current study, the initial regression models showed significant associations between CEA and triglycerides and systolic blood pressure; these findings are supported by prior studies [26, 27]. However, when triglycerides and systolic blood pressure were entered into multivari-ate regression analyses along with other MetS com-ponents, they dropped out of the model. This sug-gests that the association initially observed between these 2 variables and CEA was a consequence of their correlation with other MetS components. By contrast, the association of waist circumference and FPG with CEA was identified to be independent of other MetS components, age and sex. In a general agreement with the findings of the current study, Ishizaka et al. reported a direct association between CEA and fasting glucose and HbA1c [28]. The
current study shows that besides FPG and HbA1c,
HOMA-IR, a widely used insulin resistance mea-sure, is also associated with CEA.
Since MetS and its components are considered atherogenic factors, it may be plausible to suggest that subjects with high CEA levels are prone to vascular events. In this regard, some earlier stud-ies have suggested CEA as an independent deter-minant of acute coronary events and carotid ath-erosclerosis [28, 29].
Although no prior study has reported the patho-physiological pathways that underlie the association of MetS and CEA, there is some speculation in the literature regarding the carcinogenic role of MetS. It has been shown that subjects with MetS tend to have hyperinsulinemia and high levels of insulin resis-tance measures [9, 12]. Considering the fact that in-sulin and some of its precursors (i.e. pro- and pre-proinsulin) have a partial affinity to receptors of the tumor growth factor, an association between dia-betes mellitus, insulin, hyperinsulinemia, and car-cinogenesis appears plausible [30]. Further, insulin resistant subjects have elevated basal lipolysis, and consequently increased intracellular concentrations of free fatty acids, which may impair growth control in non-adipose cells. This phenomenon is referred to as lipotoxicity [31, 32]. Insulin resistance may al-so lead to an imbalance in the level of sex steroids and subsequently to the development of malignant cells [33–35]. The role of obesity as a cause of can-cer has been also studied. For instance, obesity is re-lated to higher levels of some inflammatory mark-ers (e.g., TNF-α and IL-6), which can contribute to malignant diseases [32, 36–38]. To evaluate the ex-act role of obesity in this, CEA expression in fat cells may need to be assessed. Considering the role of CEA as a tumor marker, it is reasonable to say that the aforementioned pathways may be at least partial-ly responsible for the observed association between various MetS-related clinical variables and CEA.
A review of previous studies shows that there are some minor variations in the reference intervals of CEA between different ethnic groups [39–41]. Additionally, Qin et al have suggested distinct ref-erence intervals for smoking and non-smoking populations [42]. CEA is also related to gender, age and menopause status [39, 40, 43]. In the current study, the authors showed for the first time that be-sides the aforementioned factors, the insulin resis-tance status of subjects may also alter CEA levels. Thus, while interpreting CEA levels, in addition to the patients’ age, sex and smoking habits, clinicians should also consider their insulin resistance status.
There have been few studies reporting the as-sociation of CEA with a wide variety of anthro-pometric and metabolic measures. Using multi-ple regression models, the current study evaluated
Table 3. The multivariate adjusted odds ratios of MetS components for CEA ≥ 1.4 ng/mL
Odds
ratio 95% confi-dence interval
Waist circumference, cm 1.025* 1.005, 1.045
Triglycerides, mg/dL 1.002 1.000, 1.004
FPG, mg/dL 1.006* 1.001, 1.012
Systolic blood pressure,
mm Hg 1.008 0.993, 1.024
* p < 0.05.
The odds ratios are reported for a model designed to include waist circumference, triglycerides, FPG, systolic blood pressure as well as age and sex.
independent associations between various clini-cal variables and CEA concentration for the first time. It is worth noting that although the odds ra-tios were significant from a statistical point of view, the magnitude of the odds ratios was not remark-able. One possible reason is that the odds ratios are reported for each unit of increase in the vari-ables. Conducting the analyses for higher magni-tudes of change in the value of variables (e.g. ev-ery ten units) would result in higher odds ratios. Moreover, because cross-sectional data was used, the current study could not determine the direc-tion of causality in the reladirec-tionship between MetS components and CEA. Furthermore, when inter-preting the results, it is important to be cautious about the variation coefficients of the laborato-ry measurements. Further studies are needed to
determine which tissues/organs are mostly respon-sible for the higher values of CEA in the subjects with MetS components.
The current study suggests that CEA is influ-enced by a cluster of anthropometric and metabolic variables. Among MetS components, only HDL-C has no association with CEA. By contrast, waist circumference and FPG correlate with high CEA levels even after adjusting for other MetS compo-nents, age, and sex. Thus, the reference interval of CEA may be different according to the insulin re-sistance status and MetS status of the subjects. This study, in conjunction with other studies, can help clinicians to individualize the value of CEA for use in follow-up programs. Further studies are also needed to elucidate the underlying pathophysio-logical pathways linking MetS to high CEA levels.
References
[1] Duffy MJ: Carcinoembryonic antigen as a marker for colorectal cancer: is it clinically useful? Clin Chem 2001, 47, 624–630.
[2] Dbouk HA, Tawil A, Nasr F, Kandakarjian L, Abou-Merhi R: Significance of CEA and VEGF as Diagnostic Markers of Colorectal Cancer in Lebanese Patients. Open Clin Cancer J 2007, 1, 1–5.
[3] Hammarstrom S: The carcinoembryonic antigen (CEA) family: structures, suggested functions and expression in normal and malignant tissues. Semin Cancer Biol 1999, 9, 67–81.
[4] Mittal A, Farooqui SM, Pyrtuh S, Poudel B, Sathian B, Yadav SK: Efficacy of carcinogenic embryonic antigen in differential diagnosis of diseases of pancreas and liver – a comparative study in a tertiary care hospital of Western Nepal. Asian Pac J Cancer Prev 2012, 13, 275–277.
[5] Lye WC, Tambyah P, Leong SO, Lee EJ: Serum tumor markers in patients on dialysis and kidney transplantation. Adv Perit Dial 1994, 10, 109–111.
[6] Ruibal Morell A: CEA serum levels in non-neoplastic disease. Int J Biol Markers 1992, 7, 160–166.
[7] Witherspoon LR, Shuler SE, Alyea K, Husserl FE: Carcinoembryonic antigen: assay following heat compared with perchloric acid extraction in patients with colon cancer, non-neoplastic gastrointestinal diseases, or chronic renal failure. J Nucl Med 1983, 24, 916–921.
[8] Bulut I, Arbak P, Coskun A, Balbay O, Annakkaya AN, Yavuz O: Comparison of serum CA 19.9, CA 125 and CEA levels with severity of chronic obstructive pulmonary disease. Med Princ Pract 2009, 18, 289–293.
[9] Esteghamati A, Zandieh A, Khalilzadeh O, Meysamie A, Ashraf H: Clustering of metabolic syndrome compo-nents in a Middle Eastern diabetic and non-diabetic population. Diabetol Metab Syndr 2010, 2, 36.
[10] Cho LW: Metabolic syndrome. Singapore Med J 2011, 52, 779–785.
[11] Schwarz PE, Reimann M, Li J, Bergmann A, Licinio J, Wong ML: The Metabolic Syndrome – a global challenge for prevention. Horm Metab Res 2007, 39, 777–780.
[12] Esteghamati A, Zandieh A, Khalilzadeh O, Morteza A, Meysamie A, Nakhjavani M: Clustering of leptin and physical activity with components of metabolic syndrome in Iranian population: an exploratory factor analysis. Endocrine 2010, 38, 206–213.
[13] Meigs JB: Invited commentary: insulin resistance syndrome? Syndrome X? Multiple metabolic syndrome? A syn-drome at all? Factor analysis reveals patterns in the fabric of correlated metabolic risk factors. Am J Epidemiol 2000, 152, 908–911, discussion 912.
[14] Pais R, Silaghi H, Silaghi AC, Rusu ML, Dumitrascu DL: Metabolic syndrome and risk of subsequent colorectal cancer. World J Gastroenterol 2009, 15, 5141–5148.
[15] Capasso I, Esposito E, Pentimalli F, Crispo A, Montella M, Grimaldi M: Metabolic syndrome affects breast cancer risk in postmenopausal women: National Cancer Institute of Naples experience. Cancer Biol Ther 2011, 10, 1240–1243.
[16] Rosato V, Tavani A, Bosetti C, Pelucchi C, Talamini R, Polesel J: Metabolic syndrome and pancreatic cancer risk: a case-control study in Italy and meta-analysis. Metabolism 2011, 60, 1372–1378.
[17] Ford ES, Li C, Zhao G: Prevalence and correlates of metabolic syndrome based on a harmonious definition among adults in the US. J Diabetes 2010, 2, 180–193.
[18] Chen HF, Chen P, Su YH, Su HF, Li CY: Age- and sex-specific risks of colorectal cancers in diabetic patients. Tohoku J Exp Med 2012, 226, 259–265.
[20] Saydah SH, Platz EA, Rifai N, Pollak MN, Brancati FL, Helzlsouer KJ: Association of markers of insulin and glucose control with subsequent colorectal cancer risk. Cancer Epidemiol Biomarkers Prev 2003, 12, 412–418.
[21] Liu CS, Hsu HS, Li CI, Jan CI, Li TC, Lin WY: Central obesity and atherogenic dyslipidemia in metabolic syn-drome are associated with increased risk for colorectal adenoma in a Chinese population. BMC Gastroenterol 2010, 10, 51.
[22] Ahmed RL, Schmitz KH, Anderson KE, Rosamond WD, Folsom AR: The metabolic syndrome and risk of inci-dent colorectal cancer. Cancer 2006, 107, 28–36.
[23] Yeh CY, Hsieh PS, Chiang JM, Lai CC, Chen JS, Wang JY: Preoperative carcinoembryonic antigen elevation in colorectal cancer. Hepatogastroenterology 2011, 58, 1171–1176.
[24] Samy N, Ragab HM, El Maksoud NA, Shaalan M: Prognostic significance of serum Her2/neu, BCL2, CA15-3 and CEA in breast cancer patients: a short follow-up. Cancer Biomark 2010, 6, 63–72.
[25] Inal A, Kos FT, Algin E, Yildiz R, Berk V, Tugba Unek I: Prognostic factors in patients with advanced pancreatic cancer treated with gemcitabine alone or gemcitabine plus cisplatin: retrospective analysis of a multicenter study. J BUON 2012, 17, 102–105.
[26] Kim KN, Joo NS, Je SY, Kim KM, Kim BT, Park SB: Carcinoembryonic antigen level can be overestimated in metabolic syndrome. J Korean Med Sci 2011, 26, 759–764.
[27] Lee JW, Park KD, Im JA, Hwang HJ, Kim SH: Serum carcinoembryonic antigen is associated with metabolic syndrome in female Korean non-smokers. Clin Chim Acta 2011, 412, 527–530.
[28] Ishizaka N, Ishizaka Y, Toda E, Koike K, Yamakado M, Nagai R: Are serum carcinoembryonic antigen levels associated with carotid atherosclerosis in Japanese men? Arterioscler Thromb Vasc Biol 2008, 28, 160–165.
[29] Vassalle C, Pratali L, Ndreu R, Battaglia D, Andreassi MG: Carcinoembryonic antigen concentrations in patients with acute coronary syndrome. Clin Chem Lab Med 2010, 48, 1339–1343.
[30] Schiel R, Beltschikow W, Steiner T, Stein G: Diabetes, insulin, and risk of cancer. Methods Find Exp Clin Pharmacol 2006, 28, 169–175.
[31] Rajala MW, Scherer PE: Minireview: The adipocyte – at the crossroads of energy homeostasis, inflammation, and atherosclerosis. Endocrinology 2003, 144, 3765–3773.
[32] Ceschi M, Gutzwiller F, Moch H, Eichholzer M, Probst-Hensch NM: Epidemiology and pathophysiology of obesity as cause of cancer. Swiss Med Wkly 2007, 137, 50–56.
[33] Kaaks R, Lukanova A, Kurzer MS: Obesity, endogenous hormones, and endometrial cancer risk: a synthetic review. Cancer Epidemiol Biomarkers Prev 2002, 11, 1531–1543.
[34] Kaaks R, Lukanova A: Effects of weight control and physical activity in cancer prevention: role of endogenous hormone metabolism. Ann N Y Acad Sci 2002, 963, 268–281.
[35] Reed MJ, Purohit A: Aromatase regulation and breast cancer. Clin Endocrinol (Oxf) 2001, 54, 563–571.
[36] Iyengar P, Combs TP, Shah SJ, Gouon-Evans V, Pollard JW, Albanese C: Adipocyte-secreted factors synergisti-cally promote mammary tumorigenesis through induction of anti-apoptotic transcriptional programs and proto-oncogene stabilization. Oncogene 2003, 22, 6408–6423.
[37] Balkwill F, Mantovani A: Inflammation and cancer: back to Virchow? Lancet 2001, 357, 539–545.
[38] Di Carlo E, Forni G, Lollini P, Colombo MP, Modesti A, Musiani P: The intriguing role of polymorphonuclear neutrophils in antitumor reactions. Blood 2001, 97, 339–345.
[39] Bjerner J, Hogetveit A, Wold Akselberg K, Vangsnes K, Paus E, Bjoro T: Reference intervals for carcinoembry-onic antigen (CEA), CA125, MUC1, Alfa-foeto-protein (AFP), neuron-specific enolase (NSE) and CA19.9 from the NORIP study. Scand J Clin Lab Invest 2008, 68, 703–713.
[40] Woo HY, Kim YJ, Park H: Establishment of reference intervals of tumor markers in Korean adults. Korean J Lab Med 2008, 28, 179–184.
[41] Behbehani AI, Mathew A, Farghaly M, van Dalen A: Reference levels of the tumor markers carcinoembryonic antigen, the carbohydrate antigens 19-9 and 72-4, and cytokeratin fragment 19 using the Elecsys Relecsys 1010 analyzer in a normal population in Kuwait. The importance of the determination of local reference levels. Int J Biol Markers 2002, 17, 67–70.
[42] Qin X, Lin L, Mo Z, Lv H, Gao Y, Tan A: Reference intervals for serum alpha-fetoprotein and carcinoembryonic antigen in Chinese Han ethnic males from the Fangchenggang Area Male Health and Examination Survey. Int J Biol Markers 2011, 26, 65–71.
[43] Engaras B, Hafstrom L, Kewenter J, Nilsson O, Wedel H: Standard serum concentrations and normal fluctua-tions of CEA, CA 50 and CA 242 during twelve months in men and women aged 60–64 years without malignant disease. Eur J Surg 1999, 165, 110–116.
Address for correspondence:
Alireza Esteghamati
Endocrinology and Metabolism Research Center (EMRC) Vali-Asr Hospital, School of Medicine
Tehran University of Medical Sciences POBox 13145-784
Tehran, Iran
Tel: +98 21 88 41 79 18 E-mail: [email protected]
Conflict of interest: None declared