Ying Shi, Xing-Hua Wang, Guo-Chang Xia, Cheng-Gong Lei
Quantitative Diagnosis of Early-Stage Liver Cirrhosis*
with Contrast-Enhanced Ultrasound – A Clinical Study
Ilościowe rozpoznanie wczesnego stadium marskości wątroby
za pomocą USG z kontrastem – badanie kliniczne
Department of Ultrasound, the 2nd Hospital of Shanxi Medical University, Taiyuan, China
Abstract
Objectives. To investigate the quantitative diagnosis value of contrast-enhanced ultrasound (CEUS) for early-stage liver cirrhosis.
Material and Methods. A total of 15 healthy subjects and 15 patients with cirrhosis were recruited into the present study, and the hepatic artery, portal vein, hepatic vein and liver parenchyma were dynamically monitored under ultrasonography and then qualified with the QLAB time-intensity curve to obtain the arriving time (AT) and the peak time (PT) of the hepatic artery, portal vein, hepatic vein and liver parenchyma. The hepatic artery to hepatic vein transit time (HA-HVTT = HAAT) and portal vein to hepatic vein transit time (PV-HVTT = HVAT-PVAT) were calculated.
Results. The AT of the hepatic vein was significantly shorter than that in controls (P < 0.01); the HA-HVTT and PV-HVTT in cirrhosis patients were also significantly shorter than those in controls (P < 0.01). However, the PT in patients was significantly prolonged when compared with controls (P < 0.05).
Conclusions. The AT of the hepatic vein, the transit time of the liver and the PT of liver parenchyma can be used as non-invasive indicators in the quantitative diagnosis of early-stage liver cirrhosis (Adv Clin Exp Med 2012, 21, 3, 385–390).
Key words: ultrasonography, contrast agent, liver cirrhosis.
Streszczenie
Cel pracy. Zbadanie ilościowe rozpoznania wczesnego stadium marskości wątroby za pomocą USG wzmocnionego kontrastem (CEUS).
Materiał i metody. Do badań włączono 15 osób zdrowych i 15 chorych na marskość wątroby. Tętnica wątrobo-wa, żyła wrotna, żyła wątrobowa i miąższ wątroby były dynamicznie monitorowane za pomocą USG. Na podsta-wie krzywej zależności intensywności od czasu QLAB uzyskano czas przybycia (AT) i czas szczytu (PT) tętnicy wątrobowej, żyły wrotnej, żyły wątrobowej i miąższu wątroby. Obliczono czas przejścia tętnicy wątrobowej do żyły wątrobowej (HA-HVTT = HVAT- HAAT) oraz czas przejścia żyły wrotnej do żyły wątrobowej (PV-HVTT = HVAT-PVAT).
Wyniki. AT żyły wątrobowej był znacznie krótszy niż w grupie kontrolnej (p < 0,01); HA-HVTT i PV-HVTT u pacjentów z marskością były też znacznie krótsze niż w grupie kontrolnej (p < 0,01). PT u chorych był znacznie dłuższy w porównaniu z grupą kontrolną (p < 0,05).
Wnioski. AT żyły wątrobowej, czas przejścia przez wątrobę i PT miąższu wątroby mogą być używane jako niein-wazyjne wskaźniki ilościowe rozpoznania wczesnego stadium marskości wątroby (Adv Clin Exp Med 2012, 21, 3, 385–390).
Słowa kluczowe: ultrasonografia, środek kontrastowy, marskość wątroby. Adv Clin Exp Med 2012, 21, 3, 385–390
ISSN 1899–5276
OrIGINAL PAPErS
© Copyright by Wroclaw Medical University
has been shown that there are alterations in the hemodynamics in early-stage liver cirrhosis [1]. Conventional ultrasonography cannot identify the changes in hemodynamics which significantly compromises the sensitivity and specificity of ultra-sound in the diagnosis of early-stage liver cirrho-sis. With the development of contrast-enhanced ultrasound (CEUS) technology, an ultrasound contrast reagent has been applied in the evalua-tion of perfusion in organs which may mirror the changes in microcirculation and hemodynamics in early-stage liver cirrhosis to achieve accurate early diagnosis of early-stage liver cirrhosis. In the present study, a series of dynamic parameters of the hepatic artery, hepatic vein, portal vein and liver parenchyma were determined under CEUS to evaluate the microcirculation in early-stage liver cirrhosis and explore the role of these parameters in the diagnosis of early-stage liver cirrhosis.
Material and Methods
Patients and Grouping
A total of 15 healthy subjects (8 males and 7 females) with a mean age of 44.9 years (range: 28~48 years) were selected in the control group. A total of 15 patients with suspected liver cir-rhosis (11 males and 4 females) with a mean age of 55.4 years (range: 31~62 years) were recruited from the Department of Gastroenterology from November 2008 to July 2009 as the liver cirrho-sis group. Among them, there was 1 patient with drug-induced liver cirrhosis, 2 patients with alco-holic cirrhosis, 11 patients with posthepatitis B cir-rhosis and 1 patient with posthepatitis C circir-rhosis. Liver cirrhosis was pathologically proved to be at the early stage.
Ultrasound Equipment
and Contrast Agent
The Philips IU22 Ultrasonic Diagnostic Ap-paratus with a diagnostic probe frequency of 3.5~5.0 MHz and mechanical index (MI) of 0.8 was used in this study.
internal station were used to detect immediately after infusion. If necessary, a second infusion was carried out 15 min later.
Ultrasonography
Conventional two-dimensional ultrasound was used to scan the liver. The morphology of the liver and its capsule, echo of liver parenchyma as well as the intrahepatic vessels were detected. Then, color Doppler ultrasound was used to detect the flow rate of the hepatic artery, portal vein and hepatic vein followed by achieving a preliminary diagnosis. The location of the probe was adjusted to obtained a favorable image of the right liver lobe in which the hepatic artery, portal vein and hepatic vein can be identified. Then, the mode was switched to CEUS followed by infusion of the con-trast. The hepatic artery, portal vein, hepatic vein and liver parenchyma were dynamically moni-tored, and all images were stored for use.
Data Acquisition
The data was analyzed by 2 ultrasound practi-tioners independently. The changes were dynami-cally analyzed with the software (QLAB-intensity curve). The arriving time (AT) and peaking time (PT) of the hepatic artery, portal vein, hepatic vein and liver parenchyma were determined. The hepatic artery to hepatic vein transit time (HA-HVTT = HVAT-HAAT) and the portal vein to hepatic vein transit time (PV-HVTT = HVAT-PVAT) were calculated.
Statistical Analysis
Statistical analysis was carried out with SPSS 11.0 statistical software and qualitative data was presented as and analyzed with a paired t test. A value of P < 0.05 was considered statistically sig-nificant.
Results
and Figure 2). In the cirrhosis patients, the AT of the hepatic vein was significantly shorter than that in the controls (P < 0.01) (Table 1 and Figure 3). The HA-HVTT and PV-HVTT in cirrhosis pa-tients were markedly shorter than those in con-trols (P < 0.01) (Table 2 and Figure 4). However,
there were no significant differences in the PTs of the hepatic artery, portal vein and hepatic vein between the two groups. Moreover, the PT of the liver parenchyma was markedly prolonged in cir-rhosis patients when compared with controls (P < 0.05) (Table 3).
Fig. 1. A) Visualization of the hepatic artery after infusion of ultrasound contrast in healthy controls; B)visualization of the hepatic artery after infusion of ultrasound contrast in cirrhosis patients
Ryc. 1. A) Wizualizacja tętnicy wątrobowej po podaniu kontrastu ultrasonograficznego w grupie kontrolnej, B) wizu-alizacja tętnicy wątrobowej po podaniu kontrastu ultrasonograficznego u chorych na marskość
A
B
Fig. 2. A) Visualization of the portal vein after infusion of ultrasound contrast in controls; B) visualization of the por-tal vein after infusion of ultrasound contrast in cirrhosis patients
Ryc. 2. A) Wizualizacja żyły wrotnej po podaniu kontrastu ultrasonograficznego w grupie kontrolnej, B) wizualizacja żyły wrotnej po podaniu kontrastu ultrasonograficznego u chorych na marskość
A
B
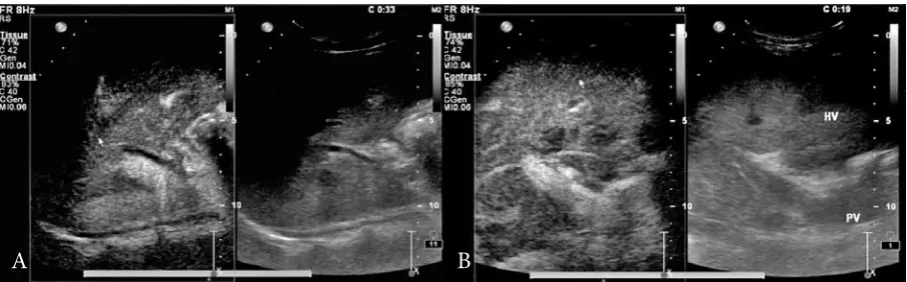
Fig. 3. A) Visualization of the hepatic vein after infusion of ultrasound contrast in controls; B) visualization of the hepatic vein after infusion of ultrasound contrast in cirrhosis patients
Ryc. 3. A) Wizualizacja żyły wątrobowej po podaniu kontrastu ultrasonograficznego w grupie kontrolnej, B) wizuali-zacja żyły wątrobowej po podaniu kontrastu ultrasonograficznego u chorych na marskość
Hepatic vein(s)
(Żyła wątrobowa) 29.00 ± 3.81 21.58 ± 4.18* 4.544 0.000
Note: *P < 0.01 vs controls. *P < 0,01 vs grupy kontrolnej.
Fig. 4. A) Time-intensity curve after infusion of ultrasound contrast in controls; B) Time-intensity curve after infu-sion of ultrasound contrast in cirrhosis patients (yellow: hepatic artery; red: portal vein; green: hepatic vein)
Ryc. 4. A) Krzywa zależności intensywności od czasu po podaniu kontrastu ultrasonograficznego w grupie kontrol-nej, B) krzywa zależności intensywności od czasu po podaniu kontrastu ultrasonograficznego u chorych na marskość (żółty: tętnica wątrobowa; czerwony: żyła wrotna; zielony: żyła wątrobowa)
A
B
Table 2. Transit time in cirrhosis patients and healthy controls (x– ± s)
Tabela 2. Czas przejścia u chorych na marskość wątroby i w grupie kontrolnej Control group (n=)
(Grupa kontrolna) Patient group (n=) (Grupa badana) t P
HA-HVTT 14.34 ± 2.66 6.74 ± 2.34* 7.431 0.000
PV-HVTT 10.41 ± 3.49 5.65 ± 3.31* 3.427 0.002
Note: *P < 0.01 vs. controls. *P < 0,01 vs grupy kontrolnej.
Table 3. PTs in cirrhosis patients and healthy controls (x– ± s)
Tabela 3. PT u chorych na marskość wątroby i w grupie kontrolnej Control group (n=)
(Grupa kontrolna) Patient group (n=) (Grupa badana) t P Hepatic artery(s) (HAPT)
(Tętnica wątrobowa) 26.75 ± 7.80 28.19 ± 7.92 0.346 0.732
Portal vein(s) (PVPT)
(Żyła wrotna) 35.35 ± 6.80 35.02 ± 10.70 0.153 0.879
Hepatic vein(s) (HVPT)
(Żyła wątrobowa) 45.71 ± 7.71 43.02 ± 11.10 0.576 0.056
Liver parenchyma
(Miąższ wątroby) 34.01 ± 7.57 45.55 ± 7.6D 2.508 0.023
Discussion
When diffuse lesions occur in the liver, the clinical manifestations are difficult to identify due to the potent compensation of liver function. Tra-ditionally, ultrasound practitioners diagnose liver fibrosis according to changes in two-dimensional images and hemodynamics. However, two-dimen-sional ultrasound cannot be used to quantitate liver fibrosis and hemodynamics is frequently affected by several factors [2–4]. Therefore, the sensitivity and specificity of two-dimensional ultrasound are poor in the diagnosis of early-stage liver cirrhosis. Liver biopsy is the gold standard in the diagnosis of liver fibrosis and cirrhosis. However, liver biop-sy is invasive and has poor repeatability limiting its wide application. With the development of CEUS technology, numerous clinical studies have shown application of ultrasound contrast can reflect the perfusion. Therefore, researchers have applied CEUS in the evaluation of microcirculation in ear-ly-stage liver cirrhosis, which may be beneficial for the early diagnosis of liver cirrhosis [5].
Albercht et al. [6] applied the transit time of ultrasound contrast reagent in the diagnosis of liv-er cirrhosis. In their study, the time to the signal of contrast in the hepatic vein of less than 24 seconds had a sensitivity of 100% and specificity of 96% in the diagnosis of liver cirrhosis. In the present study, the ATs of the hepatic vein in controls and patients were 29 seconds and 21 seconds, respec-tively. The analysis showed the AT of the hepatic vein in cirrhosis patients was significantly shorter than that in controls, which was consistent with the study mentioned above.
Hirota et al. [7] divided 40 patients into a non-cirrhosis group and a compensated non-cirrhosis group. After intravenous infusion of ultrasound contrast, the time to the signal of contrast in the hepatic artery, portal vein and hepatic vein was determined and the transit time of the liver was calculated. Their results showed the transit time in compensated cirrhosis patients was significantly shorter than that in non-cirrhosis patients. Pres-ent results revealed the HA-HVTT and PV-HVTT were 6.7 seconds and 5.6 seconds, respectively, in cirrhosis patients and 14.3 seconds and 10.4 sec-onds, respectively, in controls. Analysis showed the HA-HVTT and PV-HVTT in cirrhosis patients were markedly shortened when compared with controls, consistent with the study of Hirota et al. These findings imply the pathological alterations in liver fibrosis and cirrhosis result in changes in hemodynamics. The reasons may be as follows:
At the early stage of liver cirrhosis, the intra-hepatic hemodynamics is altered. The liver sinu-soids are capillarized resulting in a shunt between
the portal vein and hepatic vein (blood in the por-tal vein enters the hepatic vein). In addition, liver fibrosis may cause reconstruction of hepatic lob-ules resulting in neovascularization and formation of communicating branches between arteries and veins as well as subsequent arteriovenous shunt [8]. Under normal conditions, the ultrasound con-trast enters the portal vein. Through the branches of the portal vein, the ultrasound contrast enters the liver sinusoids and subsequently the inferior vena cava via the hepatic vein. Due to alterations in hemodynamics at the early stage of liver cirrho-sis, on one hand, the ultrasound contrast from the portal vein enters the hepatic vein via capillarized liver sinusoids bypassing the normal liver sinu-soids. On the other hand, the ultrasound contrast from arteries enters the hepatic vein via the com-municating branches between arteries and veins. These changes finally result in a significant short-ening in the transit time of the liver and the AT of the hepatic vein.
In patients with liver fibrosis or cirrhosis, hy-perdynamic circulation in all tissues is also a criti-cal reason resulting in the shortened transit time of the liver. Portal hypertension in liver cirrhosis is characterized by the disorder of blood circulation in not only the liver and portal system, but the sys-temic blood vessels. In the disorder of circulation in systemic blood vessels, dilatation of peripheral arteries may cause hyperdynamic circulation char-acterized by increased cardiac output, elevated blood flow, increased heart rate and decrease of blood pressure and systemic vascular resistance.
(3), 546–556.
[2] Zoli M, Magalotti D, Bianchi G, Ghigi G, Orlandini C, Grimaldi M, Marchesini G, Pisi E: Functional hepatic flow and Doppler assessed total hepatic flow in control subjects and in patients with cirrhosis. J Hepatol 1995, 23(2), 129–134.
[3] Sanford NL, Walsh P, Matis C, Baddeley H, Powell LW: Is ultrasonography useful in the assessment of diffuse parenchyma liver disease. Gastroenterology 1985, 89(1), 186–191.
[4] Vilgrain V: Ultrasound of diffuse liver disease and portal hypertension. Eur radiol 2001, 11(9), 1563–1577.
[5] Strobel D, Krodel U, Martus P, Hahn EG, Becker D: Clinical evaluation of contrast-enhanced color Doppler sonography in the differential diagnosis of liver tumors. J Clin Ultrasound 2000, 28, 1–13.
[6] Albrecht T, Blomley MJ, Cosgrove DO, Taylor-Robinson SD, Jayaram V, Eckersley R, Urbank A, Butler-Barnes J, Patel N: Non-invasive diagnosis of hepatic cirrhosis by transit-time analysis of an ultrasound contrast agent. Lancet 1999, 353 (9164), 1579–1583.
[7] Hirota M, Kaneko T, Sugimoto H, Kure S, Inoue S, Takeda S, Nakao A: Intrahepatic circulatory time analysis of an ultrasound agent in liver cirrhosis. Liver Int 2005, 25 (2), 337.
[8] Ohnishi K, Chin N, Sugita S, Saito M, Tanaka H, Terabayashi H, Saito M, Iida S, Nomura F, Okuda K: Quan-titative aspects of portal – systemic and arteiovenous shunts within the liver in cirrhosis. Gastroenterology 1987, 93 (1), 129–134.
[9] Sugimoto H, Kaneko T, Hirota M, Tezel E, Nakao A: Earlier hepatic vein transit-time measured by contrast ultrasonography reflects intra hepatic hemodynamic changes accompanying cirrhosis. J Hepatol 2002, 37 (5), 578–583.
[10] Leen E, Goldberg JA, Anderson JR, Robertson J, Moule B, Cooke TG, McArdle CS: Hepatic perfusion changes in patients with liver metastases comparison with those patients with cirrhosis. Gut 1993, 34 (4), 554–557.
[11] Kleber G, Steudel N, Behrmann C, Zipprich A, Hübner G, Lotterer E, Fleig WE: Hepatic arterial flow volume and reserve in patients with cirrhosis use of intra-arterial Doppler and adenosine infusion. Gastroenterology 1999, 116 (4), 906–914.
Address for correspondence:
Xing-Hua Wang
Department of Ultrasound
the 2nd Hospital of Shanxi Medical University
Taiyuan, 030001 China
Phone number: +86-(0)351-3524120 E-mail: [email protected]
Conflict of interest: None declared