Volume 2, Issue 3 (2013) pp. 149-158
149 | Page Original Article
Micro Level Analysis of Food Security and Agricultural
Development: A Case Study
Rukhsana
1, Asraful Alam*
21Assistant Professor, Department of Geography, Aliah University, Kolkata 700091, West Bengal, India
2Ph.D. Research Scholar, Department of Geography, Aliah University, Kolkata 700091, West Bengal, India
*Corresponding Author E-mail: [email protected]
Received: 02 April 2013, Revised: 05 May 2013, Accepted: 15 June 2013 ABSTRACT
The present paper attempts to analysis the food security and agricultural development in Kurshamari Gram Panchayet. Food security is mainly comprised of three components- food availability, access and stability. The agricultural development depends upon its package approach. Irrigation, fertilizer, type of farming, size of landholding, employment structures are the main components. The study area has been chosen as the micro unit of analysis. Village wise seven indicators of food security and four indicators of agricultural development have been computed to illustrate the relationship between food security and agricultural development. The results presented here rely on data collected from a random sample of 160 household in the study area, using well-structured questionnaire. It have been find out that agricultural development is high in the village of Satgram but food security is low, on the other hand agricultural development is low but food security is moderated, because occupation structure is positively related with food security.
Keywords: Food Security, Agricultural Development.
Introduction
Food security is defined as “access by all people at all times to enough food needed for an active and healthy life. It is essential elements are the availability of food and the ability to acquire it” (Reutlinger, 1985). The term food security for the first time was used in the World- Food Conference held at Rome in 1974, organised by FAO (Food and Agricultural Organisation). Food security as a global issue has been defined in a number of ways. It is to be
Rukhsana & Asraful Alam Int. J. Adv. Stu. Hum. Soc. Sci. 2013, 2(3):149-158
150 | Page crop. Food stability may reduce due to
changing land use pattern associated with industrialization, commercialization and globalization. But food accessibility merely depends on purchasing power of inhabitants (Rukhsana, 2010). Improving food security at the global, national, regional, individual and household level is an issue of great importance for developing countries like India, where millions of poor suffer from persistence hunger and malnutrition and others are at risk of doing so in the future. (Maxwell and Frankenberger 1992) identified many definitions for the concept of food security. However, all definitions emphasis development from macro-level to micro-level concern; from adequate micro-level of supply towards concern to meet the demand; and from short term to a concern of long term (permanent). Macro-level food self-sufficiency does not assure the achievement of food security at household level. According to FAO there are two levels of food insecurity, macro-level (food supply insecurity) and micro-level (food consumption insecurity) (FAO 1996). Food supply insecurity is the national aggregate insecurity which arises when a country is unable to supply its aggregate food requirement either through domestic food production, imports or run-down of stocks and reserves. On the other hand, food consumption insecurity exists when certain individuals or groups cannot gain access to adequate food given their nominal incomes and the price and availability of food.
Objectives
This paper conceptualizes micro regional development in terms of availability of food security and agricultural opportunity. The prime objective of this paper is to examine the association between the variables of food security and agricultural
development and to find out the spatial variation of the food security.
Data Base and Methodology
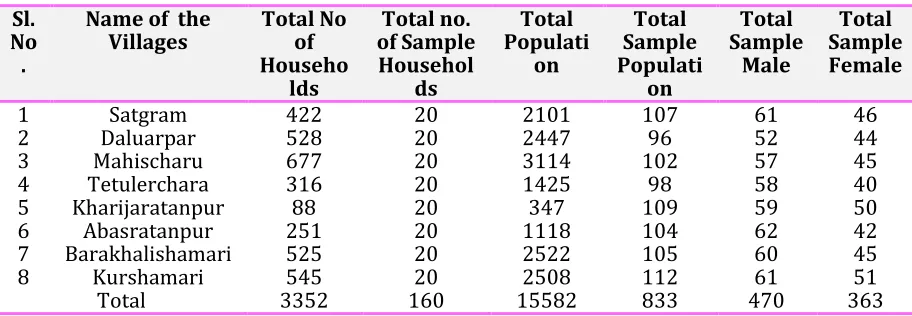
The present work is based on both primary and secondary sources of data relating to food security and agricultural development. Kurshamari Gram Panchayat have selected for the study which include eight villages namely Satgram, Daluarpar, Mahischaru, Tetulerchara (s), Kharijaratanpur, Abasratanpur, Barakhalishamari, Kurshamari, from each village 5 percent households have been selected randomly. The total sample household is 160 and total population of the sample household is 833. Where 470 (56.42 percent) is male and 363 (43.58 percent) is female population in the study area (Table- 2).
151 | Page Thus the level of food security and
agricultural development can be calculated or examined with the help of composite z- score technique, which is expressed as follows:
Z=
Z= Standard score
X= Original Value of the Score X= Mean of the Variables
SD= Standard deviation
The obtain Z= score of each indicator is added district wise to be known as composite Z= score (s) for each spatial unit of the study area.
Cs=
Cs denotes composite Z scores
Zij indicates some of Z- scores of indicators j in the village i.
Table 1. Selected indicator for the study
Food Security Agricultural Development
Food availability Employment structure Area, production and yield Irrigation facility
Livestock availability Type of farming Caloric availability Size of landholding Public distribution system
Literacy rate Monthly income
Table 2. Demographic Profile of the Study Area Sl.
No .
Name of the
Villages Total No of
Househo lds
Total no. of Sample
Househol ds
Total Populati
on
Total Sample Populati
on
Total Sample
Male
Total Sample Female
1 Satgram 422 20 2101 107 61 46
2 Daluarpar 528 20 2447 96 52 44
3 Mahischaru 677 20 3114 102 57 45
4 Tetulerchara 316 20 1425 98 58 40
5 Kharijaratanpur 88 20 347 109 59 50
6 Abasratanpur 251 20 1118 104 62 42
7 Barakhalishamari 525 20 2522 105 60 45
8 Kurshamari 545 20 2508 112 61 51
Total 3352 160 15582 833 470 363
Source: Census of India 2011, Kurshamari Gram Panchayat, West Bengal
Study Area
Kurshamari Gram Panchayat is located in Mathabhanga Subdivision of Cooch Behar District (Lies between 25057'47" and 26036'20" north latitude; between 88047'44" and 89054'35" east longitude) of the state West Bengal. It is 40 km distance from the district headquarter by road. It
has 3352 households according to 2011 census, 15577 total population where 58.82 percent is SC (Scheduled Castes) and 41.18 percent is others population.
A household analysis of Food security
Rukhsana & Asraful Alam Int. J. Adv. Stu. Hum. Soc. Sci. 2013, 2(3):149-158
152 | Page Table 3. Village wise distribution of foodgrains availability in study area
Sl. No Name of the village Foodgrains availability
1 Satgram 1490.17
2 Daluarpar 4970.03
3 Mahischaru 2000.53
4 Tetulerchara 2005.45
5 Kharijaratanpur 1727.98
6 Abasratanpur 641.36
7 Barakhalishamari 224.97
8 Kurshamari 3352.73
9 Total 2051.65
Table 3 indicates that the distribution of the foodgrains availability has been reported highest (4970.03 gram per head per day) in Daluarpar and lowest reported in Barakhalishamari villages (224.97 gram per
head per day). Daluarpar village is economically strong where productivity is high, while Barakhalishamari is economically week village where productivity is very low. Area, production and yield:
Table 4. Village wise distribution of foodgrains in area, production and yield
Name of the village Area (Hectors) Production (Quintals) Yield
(quintals/hectors)
Satgram 64.19 582.20 09.07
Daluarpar 130.74 1741.50 13.32
Mahischaru 66.22 744.80 11.25
Tetulerchara 59.12 717.35 12.13
Kharijaratanpur 68.92 687.48 09.98
Abasratanpur 32.43 243.46 07.51
Barakhalishamari 30.40 86.22 02.84
Kurshamari 120.27 1370.60 11.40
Total 71.44 771.70 09.68
Source: Field Survey, 2013
Productivity is yardstick of foodgrains production which is the backbone of agricultural development. Yield in quintals per hectors has been selected as a unit to measure productivity and stability of production. Table 4 shows that average 09.68 quintal per hectare
yield has been reported in sample villages. Highest per hectare yield is recorded in the village of Daluarpar (13.32) and lowest in Barakhalishamari (02.84).
Livestock Availability:
Table 5. Village wise distribution of livestock availability
Name of the village Cow Buffalos Goat Sheep Hen Total
Satgram 41.74 5.75 24.46 1.43 26.62 100
Daluarpar 38.71 00 39.19 00 22.10 100
Mahischaru 29.32 5.28 21.69 5.77 37.99 100
Tetulerchara 43.96 00 31.89 00 24.15 100
Kharijaratanpur 34.14 00 16.26 10.56 39.04 100
Abasratanpur 25.21 2.52 21.84 8.41 42.02 100
Barakhalishamari 34.43 00 9.95 7.28 48.34 100
Kurshamari 42.74 00 35.87 00 21.39 100
Total 36.28 1.69 50.28 4.18 32.70 100
153 | Page Table 5 show the village wise distribution
of livestock availability. It have been reported that the highest availability goat is present in the study area (50.28 percent) which follows to cow and hen (36.28, 32.70 percent) respectively. On the other hand as village wise he highest
availability of cow (43.96), goat (39.19) and hen (48.34) have been find out in Tetulerchara, Daluarpar, Barakhalishamari respectively, which enhance the purchasing power and instable food security.
Caloric availability: Table 6: Village Wise Distribution of Caloric Availability of the Sample Households
Name of the village Caloric Availability (Per Head/Day)
Satgram 2073.59
Daluarpar 6202.60
Mahischaru 2652.71
Tetulerchara 2554.95
Kharijaratanpur 1883.51
Abasratanpur 867.12
Barakhalishamari 307.08
Kurshamari 4881.59
Source: Field Survey, 2013
The distribution of caloric availability of foodgrains in selected villages shown that 6202.60 calories person per day has been reported in Daluarpar, followed by 4881.59 calories person per day
Kurshamari and lowest 307.08 calories person per day in Barakhalishamari (Table 6).
Public distribution system:
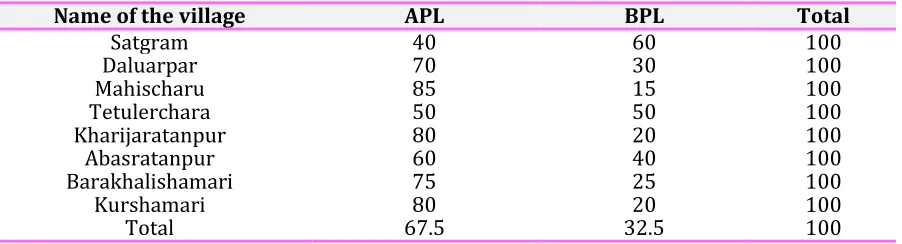
Table 7. Percentage distributions of Public Distribution System in the study area
Name of the village APL BPL Total
Satgram 40 60 100
Daluarpar 70 30 100
Mahischaru 85 15 100
Tetulerchara 50 50 100
Kharijaratanpur 80 20 100
Abasratanpur 60 40 100
Barakhalishamari 75 25 100
Kurshamari 80 20 100
Total 67.5 32.5 100
Source: Field Survey, 2013
Public distribution system has been counted on the basis of APL (above poverty line) and BPL (below poverty line) in sampled villages. These ration cards are different colour of cards issued by government to distribute rice, wheat, sugar, shop, detergent and kerosene at subsidize rate. This cards have been given those persons who earn less than 9000 per year they come under below poverty line (BPL) and who earn more than 9000 per
year they come under above below poverty line (APL) (FSD, 2003). The highest percentage respondent who use APL ration card is found in the village of Mahischaru (85 percent), while lowest is recorded in village of Satgram (40 percent). On the other hand of BPL user recorded in the village of Satgram (60 percent) and lowest in Mahischaru it is 15 percent. (Table- 7)
Rukhsana & Asraful Alam Int. J. Adv. Stu. Hum. Soc. Sci. 2013, 2(3):149-158
154 | Page Table 8. Village Wise distributions of Literacy Rate in Percent
Name of the village literate illiterate Total
Satgram 66.67 33.33 100
Daluarpar 59.13 40.87 100
Mahischaru 51.96 48.04 100
Tetulerchara 48.98 41.02 100
Kharijaratanpur 49.54 50.46 100
Abasratanpur 54.81 45.19 100
Barakhalishamari 40.95 59.05 100
Kurshamari 65.18 34.82 100
Total 54.65 45.35 100
Source: Field Survey, 2013
Table 8 focused on the distribution of literacy rate in study area of sample household. Literacy is one of the most important components of educational status. Out of total villages 54.65 percentage of literate population and 45.35 percent illiterate population have
been recorded in the study area. The literacy rate of these villages is moderated; the highest literacy rate is found in the village of Satgram (66.67 percent) and lowest in Barakhalishamari (40.95 percent).
Income Structure:
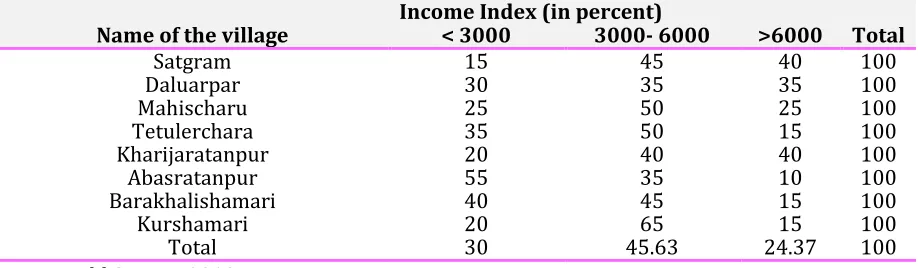
Table 9: Village wise distribution of monthly income structure of sampled household respondents Income Index (in percent)
Name of the village < 3000 3000- 6000 >6000 Total
Satgram 15 45 40 100
Daluarpar 30 35 35 100
Mahischaru 25 50 25 100
Tetulerchara 35 50 15 100
Kharijaratanpur 20 40 40 100
Abasratanpur 55 35 10 100
Barakhalishamari 40 45 15 100
Kurshamari 20 65 15 100
Total 30 45.63 24.37 100
Source: Field Survey, 2013
Table 9 shows the income structure of sample household in the study area. The monthly income of the respondent household have been categorized in to three types on the base of minimum and maximum income of rickshaw- pullers in the study area (<3000, 3000- 6000 and >6000). The maximum respondents have been find out in the study are between 3000-6000 in come group and minimum monthly income group people reported >6000 per month in the study area. As per
the village wise, the maximum percentage of respondent who earn <3000 is found in the village of Abasratanpur (55 percent), while minimum is recorded in the village of Satgram (15 percent). Between 3000-6000, the highest percentage of respondent recorded in the village of Kurshamari (65 percent) and lowest in both Daluarpar (35 percent) and Abasratanpur (35 percent).
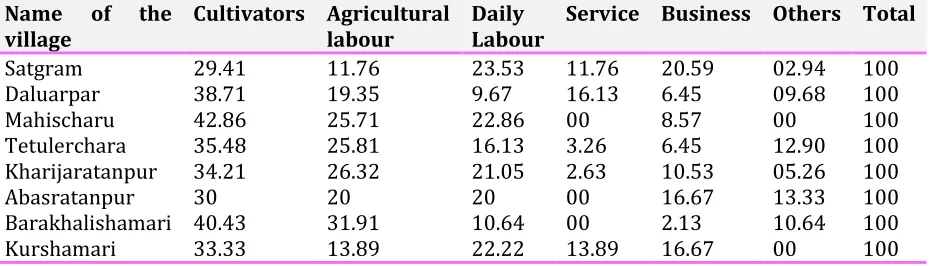
155 | Page Table 10. Village Wise Distribution of Employment Structure in percentage
Name of the village
Cultivators Agricultural labour
Daily Labour
Service Business Others Total
Satgram 29.41 11.76 23.53 11.76 20.59 02.94 100
Daluarpar 38.71 19.35 9.67 16.13 6.45 09.68 100
Mahischaru 42.86 25.71 22.86 00 8.57 00 100
Tetulerchara 35.48 25.81 16.13 3.26 6.45 12.90 100 Kharijaratanpur 34.21 26.32 21.05 2.63 10.53 05.26 100
Abasratanpur 30 20 20 00 16.67 13.33 100
Barakhalishamari 40.43 31.91 10.64 00 2.13 10.64 100
Kurshamari 33.33 13.89 22.22 13.89 16.67 00 100
Source: Field Survey, 2013
Table 10 demonstraits the distribution of employment structure of the study area. The highest percent of cultivators, agricultural labours and livestock rearing are found in the village of Barakhalishamari. The highest numbers of daily labour, service and business have been recorded in village of Satgram (23.53), Daluarpar (16.13) and Satgram (20.59) respectively. In the village wise study highest percentage of cultivators recorded in the village of Mahischaru (42.86 percent) and lowest in Satgram (29.41). The agricultural labour is highest recorded in the village of
Barakhalishamari (31.91 percent) because highest number of marginal farmers found in this village (Table- 12) lowest percentage of agricultural labour recorded in Satgram (11.76 percent) . On the other hand maximum percentage of daily labour (23.53 percent) and business (20.59 percent) recorded in the village of Satgram and minimum daily labour in the Daluarpar (9.67 percent) and business in Barakhalishamari (2.13 percent). The highest percentage of service recorded in the village of Daluarpar (16.13).
Irrigation facility:
Table 11. Percentage distributions of Source of Irrigation in the study area:
Name of the village Tube well(With Disel) Tube well(With Petrol) Total
Satgram 31 69 100
Daluarpar 6 94 100
Mahischaru 40 60 100
Tetulerchara 30 70 100
Kharijaratanpur 42 58 100
Abasratanpur 49 51 100
Barakhalishamari 79 21 100
Kurshamari 28 72 100
Total 38.13 61.87 100
Source: Field Survey, 2013
Table 11 shows that source of irrigation where average 38.13 percent respondent household main irrigation source is tube
well with disel and 61.87 percent tube well without disel.
Rukhsana & Asraful Alam Int. J. Adv. Stu. Hum. Soc. Sci. 2013, 2(3):149-158
156 | Page Table 12. Village Wise Distribution of Type of Farming in percentage
Name of the village
Tractor Operated
Bullock Operated
Tractors/Bullock Operated
Total
Satgram 64.71 15.29 20 100
Daluarpar 68.50 12.5 19 100
Mahischaru 49.7 21.1 29.1 100
Tetulerchara 67.81 22.19 10 100
Kharijaratanpur 53.03 18.17 28.8 100
Abasratanpur 20.9 38.8 40.3 100
Barakhalishamari 29.1 41.2 29.7 100
Kurshamari 64.7 20.1 15.2 100
Total 52.31 23.67 24.02 100
Source: Field Survey, 2013
It has been evident that 52.31 percent cultivators have been using tractors to cultivate agriculture land, while 23.67 per cent used bullock and 24.02 percent depend on both (tractor operated and bullock operated). In the village of
Daluarpar (68.50) highest percent respondent have been using tractor to cultivate agricultural land and low in the village of Abasratanpur where only 20.90 percent (Table- 12).
Size of landholdig: Table 13. Village Wise Distribution of Type of Land Holding Size in percentage
Name of the village
Landless Marginal(> 1 Hector)
Small(1 -2 Hectors
)
Semi- Medium(2
-4 Hectors)
Medium(4 - 10 Hectors)
Large(<1 0 Hectors)
Tota l
Satgram 5 15 30 25 20 5 100
Daluarpar 5 20 25 15 25 10 100
Mahischaru 10 30 20 10 20 10 100
Tetulerchara 5 20 30 20 20 5 100
Kharijaratanpur 10 30 10 30 10 10 100
Abasratanpur 10 30 25 15 15 5 100
Barakhalishamari 15 40 25 15 5 0 100
Kurshamari 5 20 25 5 30 15 100
Total 8.12 25.63 23.75 16.87 18.13 7.5 100
Source: Field Survey, 2013
In agricultural systems size of land holdings determines the agricultural income of farmers. It is evident from table 13 that the size of land holdings of the respondents have been arranged into five categories i.e., land less, marginal (less than 1 hectare), small (1-2 hectare), semi medium (2-4 hectare), medium (4-10
157 | Page
Figure 1 Figure 2
Figure 3
Figure 4
Figure 5
Figure 6
Finally to find out the relationship between the
Rukhsana & Asraful Alam Int. J. Adv. Stu. Hum. Soc. Sci. 2013, 2(3):149-158
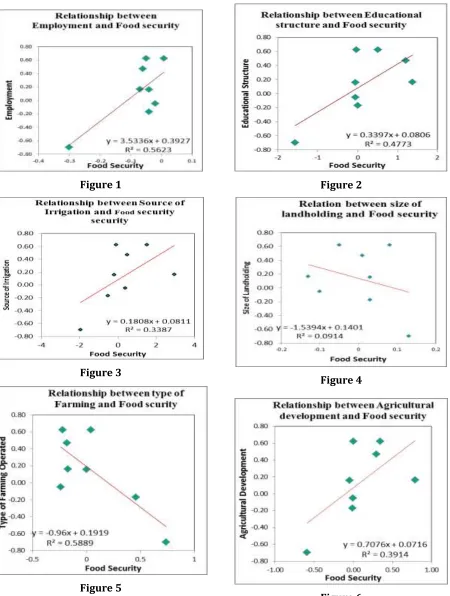
158 | Page It has been concluded through the figure-1,
figure-2 and figure-3 reveals that the employment, educational structure and source of irrigation is positively related with food security ( = 0.562, = 0.477 and 0.338 respectively). But on the other hand figure-4, figure-5 shows that size of landholding and type of farming operation is negatively related with food security ( = 0.091, ( 0.588 respectively). In this study area the maximum percentage of cultivators of Barakhalishamari and Abasratanpur have been using bullock to cultivate agriculture land (Table No. 12) for this causes their production is also very low. Figure 4 shows that negative relationship between landholding size and food security because in this study area maximum farmers are marginal and landholding size of the large numbers of farmers of the village like Abasratanpur, Barakhalishamari, Tetulerchara have semi- medium (2-4 Hectors) but their maximum lands are fellow not use for agricultural purposes (Table no 13). Some of the villages like Satgram, Kharijaratanpur (Table no 4) have landholdig size is large but their yield is low because labour productivity is low (Labour productivity = Total agricultural product of a year/ Total no of labour force in that year). After going through the above analyses it has been observed that agricultural facilities like source of irrigation, size of landholding, type of farming operated, educational facility etc. are found high in Satgram, Daluarpar and Kurshamari villages on the other hand low in the villages of Abasratanpur, Barakhalishamari and Kharijaratanpur. It is evident that Daluarpar and Kurshamari are
highest in food security. Agricultural development is high in the village of Satgram but food security is low, on the other hand agricultural development is low but food security is moderated, because occupation structure is positively related with food security. In Satgram (Table No. 10) minimum percent of population engaged in agricultural activity (Cultivators, Agricultural labour). So, food security is found high in those areas which are highly developed in agriculture and foodgrains production.
References
FAO, (1974). The World Food Conference in 1974, United Nations.
http://www.caricom.org/jsp/community/dono r_conference_agriculture/agri_profile_guyana.js.
Khullar, D. R., INDIA A COMPREHENSIVE GEOGRAPHY, Kalyani Publishers, Ludhiana, pp. 554.
Maxwell, S. and Frankenberger, T.R. (1992). Household Food Security: Concepts, Indictors, Measurements. New York, UNICEF/IFAD.
Rukshana (2009). Regional Imbalances In The Dimensions Of Rural Development, Indian Journal of Regional Science, Vol. XXXXI. No. 2.
Rukshana (2010). Measurements of food security and its Determinants in Develpoing Economy- An Emprical Observation, Asian Profile, Vol. 38, No. 5, October.
Sarkar, A.N. (2001). National Food Security Perspective with a global Vision, Indian Farming, Vol. 50, No. 10, pp. 29-36.
Tweeten, L.G., MeCLelland, D.G. (1997). Promoting Their World.
How to cite this article:Rukhsana, Asraful Alam, Micro Level Analysis of Food Security and Agricultural Development: A Case Study. International Journal of Advanced Studies in
Humanities and Social Science, 2013, 2(3), 149-158.