VOLUME 37, ARTICLE 25, PAGES 769
−
852
PUBLISHED 27 SEPTEMBER 2017
http://www.demographic-research.org/Volumes/Vol37/25/ DOI: 10.4054/DemRes.2017.37.25
Research Article
Macroeconomic conditions and population
health in Iceland
Kristín Helga Birgisdóttir
Tinna Laufey Ásgeirsdóttir
© 2017 Birgisdóttir & Ásgeirsdóttir
This open-access work is published under the terms of the Creative Commons Attribution NonCommercial License 2.0 Germany, which permits use, reproduction, and distribution in any medium for noncommercial purposes, provided the original author(s) and source are given credit.
1 Introduction 770
2 Literature review 772
3 Data 774
3.1 Dependent variables 775
3.2 Explanatory variables 781
4 Estimation strategy 784
5 Results 786
5.1 Bivariate and age-adjusted regression models 787
5.2 Distributed lag models 794
6 Sensitivity analyses 800
7 Discussion 801
8 Acknowledgements 805
References 806
Macroeconomic conditions and population health in Iceland
Kristín Helga Birgisdóttir1
Tinna Laufey Ásgeirsdóttir2
Abstract
BACKGROUND
Results from recent research on the impact of economic cycles and population health have been mixed, with results appearing to be context-sensitive.
OBJECTIVE
We examine the long-term relationship between economic conditions and population health in Iceland, which has experienced some economically turbulent times in the last years and decades.
METHODS
We use aggregate annual data for 1981‒2014. We use three aggregate indicators of economic activity to proxy the economic cycle: unemployment rate, real GDP per capita, and real GDP. Life expectancy at birth, infant mortality, and total mortality as well as four cause-specific mortality rates were used as outcome measures.
RESULTS
Our results do not suggest a statistically significant relationship between economic conditions and total mortality, infant mortality, or life expectancy. Different responses between causes of death are found, and in some instances between genders, although statistical significance is low. We do, however, find a consistent and statistically significant relationship for females aged 45‒64, where economic downturns are associated with lower all-cause mortality.
CONCLUSIONS
For the time period studied we do not find a significant relationship between economic cycles and population health, where health is proxied by mortality rates, life expectancy at birth, and infant mortality. Further studies using less extreme health outcomes, such as morbidity rates, are warranted.
1
University of Iceland, Reykjavík, Iceland. E-Mail:[email protected].
http://www.demographic-research.org 770
CONTRIBUTION
This type of study has not been performed using Icelandic data before and provides a comparison to research from other countries where the relationship has been explored more. Additionally, one of the contributions of this paper is to use a variety of economic indicators as proxies for economic cycles in a study examining their relationship with population health.
1. Introduction
Researchers have found mixed results when studying the impact of economic conditions, and economic cycles specifically, on health. As results appear to be sensitive to time, place, data sources, and outcomes, each new study adds a piece to the puzzle. A fully comprehensible pattern is unlikely to be realized in a single study, but will emerge over time. In this analysis we add new information to the currently loose patchwork of results by testing this relationship in a context not examined before. We focus on the long-term relationship between economic cycles and health on a population level in Iceland. As a country with strong data collection agencies and considerable economic volatility, Iceland provides an excellent context for such a study. We use aggregate annual data from 1981‒2014 and three different aggregate indicators of economic activity to proxy economic cycles. Outcome variables are life expectancy at birth, infant mortality, and total mortality, as well as four cause-specific mortality rates. We analyse simple regression models between health and economic indicators, as well as distributed lag models where a health indicator is regressed on contemporaneous and lagged values of an economic indicator.
world’s richest nations OECD (2006). However, during the first days of October 2008, the three largest banks in Iceland collapsed, which triggered a system-wide meltdown, accompanied by currency and debt crises (Matthiasson 2008; Central Bank of Iceland 2010). The other most noteworthy economic downturn in the study period is the early 1980s, with hyperinflation, in which the highest inflation rate exceeded 100% in August 1983, although not sustained over a full year (Statistics Iceland n.d.-a).
Changes in the Icelandic economy have thus been volatile, creating substantial variation that can be utilized for research. For instance, a longer-term analysis has been made on the relationship between business cycles and workplace accidents (Ásgeirsdóttir and Tryggvason 2014), and the most recent economic downturn has been the subject of several studies on business cycles and health (Ásgeirsdóttir, Ólafsdóttir, and Ragnarsdóttir 2014; Guðjónsdóttir et al. 2012; Ólafsdóttir, Hrafnkelsson, and Ásgeirsdóttir 2014; Jónsdóttir and Ásgeirsdóttir 2014; Ásgeirsdóttir et al. 2013; Ásgeirsdóttir et al. 2014; Ásgeirsdóttir and Ragnarsdóttir 2014; Eiríksdóttir et al. 2013; Ólafsdóttir and Ásgeirsdóttir 2015; Hauksdóttir et al. 2013; Ásgeirsdóttir et al. 2016; Birgisdóttir, Jónsson, and Ásgeirsdóttir 2017), with the majority of research examining health behaviours (Ólafsdóttir, Hrafnkelsson, and Ásgeirsdóttir 2014; Guðjónsdóttir et al. 2012; Jónsdóttir and Ásgeirsdóttir 2014; Ásgeirsdóttir et al. 2013; Ásgeirsdóttir et al. 2014; Ásgeirsdóttir et al. 2016; Ólafsdóttir and Ásgeirsdóttir 2015).
http://www.demographic-research.org 772
collecting infrastructure, which makes for reliable data. Here, we want to take advantage of this opportunity, to examine good quality data from a western country that, due to its size, happens to provide substantial volatility. To our knowledge, this is the first time series study to examine the relationship between economic cycles and population health in Iceland.
Due to the multitude of determinants of each health condition studied and in accordance with previous research, the relationship could be of either sign a priori, but likely to be small if existing. Furthermore, some diseases cannot reasonably be assumed to be correlated with the state of the economy at all (e.g., genetically determined diseases). We do not find evidence of a statistically significant relationship between economic conditions and total mortality or life expectancy at birth. We do find different responses between causes of death and in some instances between genders, although the statistical significance is generally low. Although results are generally weak, results show a fairly robust statistically significant relationship for females aged 45‒64, where economic downturns are associated with lower all-cause mortality.
2. Literature review
genetically determined or take a long time to materialize, such as certain types of cancer, but rather in diseases that are affected by behaviour, lifestyle, and environmental factors.
Ruhm (2000, 2003, 2005, 2007), utilizing US data from 1972 through 2000, shows state-level mortality rates to be procyclical, indicating that recessions are beneficial to population health. He speculates that rising opportunity costs may be an explanation. Using more recent data, from 1976 through 2009, Ruhm (2015) points to a shift over time in the relationship between total mortality and economic conditions; from being procyclical to being unrelated. This shift is however not the same across causes of mortality. Cardiovascular mortality is found to be procyclical throughout the study period.
Examined possible mechanisms for the procyclicality of overall mortality in the United States have mostly been personal income (Ruhm 2000), health behaviours (Ruhm 2003, 2007, 2015), and individual labour market status (Miller et al. 2009). Miller et al. (2009) find that the added deaths related to a rise in the unemployment rate are mostly for age groups that are not likely to be a part of the labour force; only 7% of additional deaths were for the age group 25‒64. They furthermore find the largest contributor to procyclical mortality to be motor accidents and cardiovascular deaths. The sufferers of those deaths are mostly not of working age, indicating that work-related stress or substitution between work and health production are not to blame. The authors conclude that individuals’ own labour market involvement is not the key mechanism behind the procyclical mortality rate found. Furthermore, people’s individual-level economic conditions have been studied to some extent as possible mechanisms, mostly using microdata on personal income. Ruhm (2000) finds that changes in personal income play a negligible part in the relationship between business cycles and health, but he has also pointed to risky behaviours (such as smoking and drinking) as pathways (Ruhm 2003, 2004, 2015). On the other hand, increased income could allow people to consume more health care and partake in healthful activities, i.e., it may have protective effects, especially in countries where health services are privately funded to a considerable extent (Gerdtham and Ruhm 2006).
http://www.demographic-research.org 774
unemployment rates on mortality in 26 EU countries in the period 1970‒2007, did however not find consistent evidence across the European Union that all-cause mortality rates were affected with changes in the unemployment rate.
Causality concerns always come up in any lengthy time series analyses, and for some relationships the causality is clearly bidirectional (Lorentzen, McMillan, and Wacziarg 2008). The previous literature contains many examples of the relationship between various economic indicators and health running both ways. Although business cycles are not the subject of the following studies mentioned here, they add to our understanding and make it clear that causal inference is by no means straightforward. Studies finding a causal relationship running from various health outcomes to different economic indicators include Bloom, Canning, and Sevilla (2001), who find positive and sizable effects of health on economic growth; Weil (2005), who finds a positive effect of health on a country’s output; Ashraf, Lester, and Weil (2008), who find positive effects of exogenous health improvements on output per capita, although relatively small in the long run; and Acemoglu and Johnson (2007), who find that life expectancy at birth has a small effect on real GDP. Causality inference will not be made in this study. In our view, the three and a half decades that this time series spans includes too many turbulent times in Iceland, in both economical and historical sense, to fairly hypothesize as to which direction the relationship holds.
Iceland is a small, open, and volatile economy where business cycles originate from various external sources. It is probable that such factors override any possible effects running from health to business cycles. This is further highlighted by the fact that Iceland has not suffered major health outbreaks such as Ebola or other extremely infectious diseases that affect a large part of a country’s population. Our hypothesis, and thus modelling, is therefore that business cycles are a potential source for changes in mortality rates, given the numerous studies indicating such a relationship, as well as a number of hypothesized pathways through which this relationship could work. For this purpose we use credible economic indicators as proxies for economic cycles to assess their impact on mortality rates for the most common causes of death in Iceland.
3. Data
and females), and infant mortality. It also includes age-, gender-, and cause-specific mortality rates for four major causes of death that comprise on average 85% of total mortality in Iceland during the study period.
3.1 Dependent variables
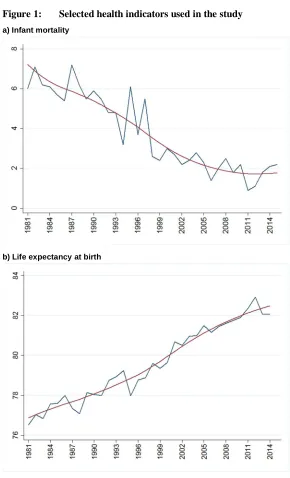
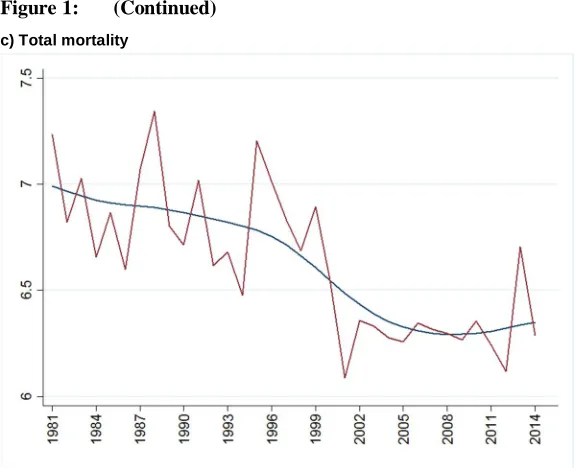
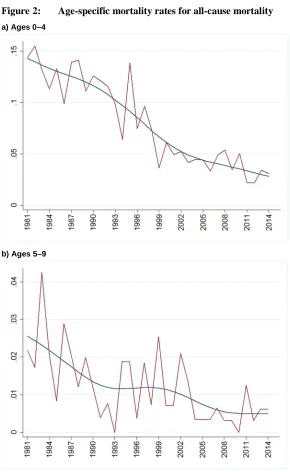
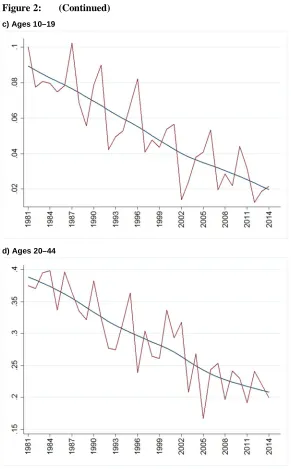
Population health is indexed by life expectancy at birth, infant mortality, all-cause mortality, and a variety of age-, gender-, and cause-specific mortality rates. As deaths are rare in the youngest age groups and for the sake of brevity, we focus on the working-age population in our main analysis; i.e., the age groups 20‒44 and 45‒64. Although the health of the youngest and oldest individuals is perhaps susceptible to changes in the economy, we do not find a statistically significant relationship in our analysis but nonetheless report our results in the Appendix for completeness. The cause-specific mortality rates used in the analyses are neoplasm, diseases of the circulatory system, respiratory diseases, and mortality from external sources, which include traffic accidents and suicides. The study period was 1981–2014, rendering 34 observations in most analyses. Mortality rates are constructed as the number of deaths from the specified cause divided by population in each year, and reported per 1,000. As can be seen in Figure 1, the total mortality rate from all causes trended downwards during the study period, and with further inspection, all but the oldest age group (>84 years) show the same downward trend, which is in accordance with the aging of the Icelandic population (Figure 2). The most widely used indicators for population health are life expectancy at birth and infant mortality. Life expectancy at birth is a good mortality-based summary index of population health and is unaffected by the age structure of the population. According to both indicators, Iceland enjoys very good public health, as life expectancy at birth is among the highest in the world (81 years for men and 83.6 years for women in 2015), and infant mortality the lowest in Europe (1.9 per 1,000 live births) (Statistics Iceland 2016). A clear upward trend is evident in life expectancy at birth and a downward trend in infant mortality during the study period, both clear indicators of improving population health in Iceland (Figure 1).
http://www.demographic-research.org 776
Figure 1: Selected health indicators used in the study
a) Infant mortality
Figure 1: (Continued)
c) Total mortality
Notes: Mortality rates per 1,000 on the y-axis in panels a and c, and life years in panel b, calendar years on the x-axis. The smooth
http://www.demographic-research.org 778
Figure 2: Age-specific mortality rates for all-cause mortality
a) Ages 0–4
Figure 2: (Continued)
c) Ages 10–19
http://www.demographic-research.org 780
Figure 2: (Continued)
e) Ages 45–64
Figure 2: (Continued)
g) Ages 85–95
Notes: Mortality rates per 1,000 on the y-axis, calendar years on the x-axis. The smooth curves are Hodrick–Prescott trends
computed with a smoothing parameter γ=100.
3.2 Explanatory variables
The causes and manifestation of economic fluctuations can vary substantially, both between and within countries, as well as between time periods. For this reason, three economic indicators are used as proxies for economic conditions. Although those variables are known to correlate to some extent, the impact and response time between a change in the economy and health might be different when measured with different exposure variables. Those indicators are: the unemployment rate, real GDP per capita, and real GDP. Real prices were based on the consumer price index, using 2014 as a base year and calculated from official data from Statistics Iceland (Statistics Iceland n.d.-a, n.d.-d, n.d.-e).
http://www.demographic-research.org 782
GDP has two variations that relate to different theoretical hypotheses about the relationship between business cycles and health, and both are used in this study: Real GDP per capita is a broad economic indicator of living standards and is often used for comparison between countries or time periods. Real GDP is an inflation-adjusted measure of the economic cycle and important for different reasons. Although GDP is not a measure of average living standards, it represents the total economic activity within a specific geographical area, which is important if external effects of economic activities, such as pollution and traffic congestion, are the drivers of potential health effects. These can affect the whole population – both the working-age population, who are perhaps most likely to be affected by traffic-related injuries, and the elderly and young children, who are most susceptible to illnesses due to pollution (WHO Regional Office for Europe 2013). For ease of interpretation of coefficients, real GDP and real GDP per capita were scaled to billions of ISK and millions of ISK respectively. A priori, we expect to find similar results for real GDP and real GDP per capita as they are very closely correlated (see Figure 3).
Figure 3: Selected economic indicators used in the study
Figure 3: (Continued)
b) Real GDP per capita (in millions ISK)
c) Average yearly unemployment rate
http://www.demographic-research.org 784
Data on demographics, i.e., the gender-specific age composition of Icelanders in each year, was obtained from Statistics Iceland (Statistics Iceland n.d.-h) and is summarized in the Appendix, along with summary statistics of all variables used in our analyses.
4. Estimation strategy
First, we estimate simple bivariate regression models using the following regression equation:
Mt=a+Et β+et
whereM is a gender-specific mortality rate for the various mortality categories studied (total and cause-specific), differing across analyses, E represents the state of the economy modelled in the different ways described above, makingβ the coefficient of main interest. A time-invariant intercept is represented withα, and e is the disturbance term. The subscriptt is used to index time.
Results are also reported with age controls added to the regression models, as the age distribution of the population may independently affect cause-specific mortality rates and be correlated with economic conditions. Following an example set in the literature on the composition of demographic factors to include in analyses of this type (Gerdtham and Ruhm 2006; Ruhm 2000, 2015; Ariizumi and Schirle 2012; Tapia Granados 2005b; Neumayer 2004), the total and gender-specific proportion of the population aged 0‒14, 65‒75, and over 75 are thus included as control variables.
In our analyses of population subgroups, mortality rates for age groups are studied separately, with focus kept on the working-age population in the main text and results for other age groups reported in the Appendix. For the age-specific analyses, age controls are not included in the estimation model. Each model, both unadjusted and age-adjusted, is run for the period 1981‒2014. To inform our model selection, i.e., the choice between a bivariate or age-adjusted model, we use both the Akaike information criterion (AIC) and the Bayesian information criterion (BIC) to measure the relative quality of the statistical models we use for our data.
As indicators for both health and the economy have obvious trends, all variables were transformed before the analyses. Two main approaches were used to produce stationary series: a Hodrick–Prescott (HP) nonlinear filter with a smoothing parameter
application to the data and offer different interpretation of results. By applying an HP filter to our data, the time series is separated into a long-term trend component and a short-run cyclical component that can subsequently be used in estimations, as it is trend-stationary. Detrending using the smoothing parameter γ=10 was done in sensitivity analyses and yielded similar results. As the smoothing parameter decreases in value, the smoothed series will attribute more of the variations to the long-term trend versus the short-run cyclical component, and hence captures more short-term cyclicality in the relationship between economic cycles and health than in the main analysis using the smoothing parameter γ=100. The first difference of a time series is a series of changes from one period to the next, however; i.e., using our estimation equation, the first difference ofM at period t is equal toMt–Mt−1, and the resulting time series is difference-stationary.
The presence of a unit root can cause problems in statistical inference when exploring time series models, for example due to nonstationarity. The augmented Dickey–Fuller (ADF) test was used to test for a unit root in the time series used in our analyses. When estimating the original time series, the ADF test fails to reject the hypothesis of unit roots for all economic indicators, life expectancy at birth, infant mortality, and mortality rates. However, transformed time series, both when filtered with the HP filter and when differenced, are stationary, as the ADF rejects the hypothesis of unit roots at high levels of statistical significance.
http://www.demographic-research.org 786
affect health and subsequent mortality. Thus, the choice of the lags chosen will always be to some extent arbitrary.
In addition to using the HP filter with a smoothing parameter of γ=10, two other factors are studied in the sensitivity analyses: First, an additional economic indicator is used to capture people’s living standards. In the Icelandic context the different variations of real GDP used are perhaps not as indicative of people’s living standards as in other economies. On the whole, GDP measures economic performance of a country in terms of production. For a small, open economy with its own independent currency and considerable international trade, living standards can depend heavily on imbalances in imports and exports. Indeed the time period under examination has seen some bubbles that were largely due to substantial inflow of resources and crises that are essentially aggregate debt crises. A relevant economic indicator that reflects living standards in such an economy might thus be balance of trade – the difference between a country’s imports and exports. The trade balance is a part of the nation’s GDP; surpluses add to the GDP, and deficits detract from it. Although this is not a commonly used indicator of business cycles, we felt that a robustness check using this measure of economic conditions was called for. Second, net migration was studied as an additional explanatory variable. The variable consists of both native Icelanders and foreign-born individuals as both immigrants and emigrants. The majority of both immigrants and emigrants are Icelanders in most years. Furthermore, Icelanders are net emigrants in most years while foreign-born individuals are net immigrants. At certain times during the study period variations in net migration were dramatic. This was especially true in the years just before and after the most recent economic collapse in 2008, which saw a change from a mass net immigration to emigration after the collapse. With a population of only 330,000, migration can potentially have a significant impact on the demographic composition, e.g., on average age and educational level. Additionally, one could reasonably imagine that the health status of immigrants and emigrants is different, which could affect the results, especially in the years when the numbers of asylum seekers and refugees from war-torn countries was considerable.
5. Results
Durbin–Watson test in all but a few estimations using the HP-detrended variables. Conversely, autocorrelation is a problem in analyses using first-differenced variables. Due to this problem, results for the analyses using HP-detrended variables will be our main focus (Figure 4), but for completeness, comparable results with first-differenced variables can be found in the Appendix for the interested reader. The same autocorrelation problem is found for age-specific mortality rates and in lag models using first differenced variables. Due to that problem and for the sake of brevity, only results using HP-detrended variables are presented for those models (Figures 5‒7) but full results are reported in the Appendix.
When studying all ages for males, females, and total population, a statistically significant relationship was rarely found between economic conditions and the health outcomes explored (Figure 4). When age controls were added, statistical significance was however found in some instances (Figure 4). The age-specific analyses paint a similar picture of a general low statistical significance of the coefficients of interest, and autocorrelation in some analyses (see Figure 5 and full numerical results for HP-detrended variables in Tables A-3‒A-5 in the Appendix). When exploring n-year temporary life expectancy, autocorrelation is a problem, and therefore those results should be interpreted cautiously. For interpretation of the results it should be noted that for real GDP and real GDP per capita, a negative coefficient for mortality rates indicates procyclicality between the economy and population health (better economic conditions associated with lower mortality). The opposite is true when life expectancy at birth is studied ‒ a positive coefficient indicates procyclicality (better economic conditions associated with higher life expectancy). When studying unemployment, a positive coefficient is also an indicator for procyclicality, since a higher unemployment rate indicates worse economic times. In general, one would therefore expect coefficients for real GDP and real GDP per capita to have the same sign, and an opposite sign for unemployment. Indeed, in the majority of estimations that is the case.
5.1 Bivariate and age-adjusted regression models
http://www.demographic-research.org 788
Figure 4. Very seldom are coefficients statistically significant, but procyclicality of health is indicated by the sign of the coefficients for all-cause mortality and respiratory diseases. Mortality due to circulatory diseases, neoplasms, and life expectancy at birth differ between genders, as they both show procyclicality of health for males but countercyclicality for females. Countercyclicality is however indicated for infant mortality and mortality due to external causes.
Figure 4: Parameter estimates of bivariate and age-adjusted models with 90% confidence intervals using HP-detrended variables.
Figure 4: (Continued)
http://www.demographic-research.org 790
Figure 4: (Continued)
c) Dependent variable: unemployment rate
Notes: N=34.All variables are detrended using HP smoothing parameter γ=100. Economic indicators are dependent variables and
health outcomes are independent variables. Additional control variables in the age-adjusted model: Age 15 and under, 65–75, and over 75 (portion of whole population, males, or females). Markers refer to regression coefficients and horizontal lines refer to 90% confidence intervals. X: The Durbin–Watson test rejects the null hypothesis of no serial correlation at p<0.05.t p<0.1;tt
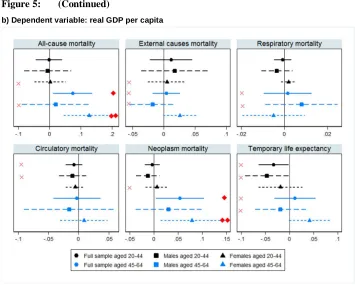
Figure 5: Age-specific parameter estimates with 90% confidence intervals using HP-detrended variables.
http://www.demographic-research.org 792
Figure 5: (Continued)
Figure 5: (Continued)
c) Dependent variable: unemployment rate
Notes: All variables are detrended using HP smoothing parameter γ=100. Economic indicators are dependent variables and
age-specific health outcomes are independent variables. Markers refer to regression coefficients and horizontal lines refer to 90% confidence intervals. X: The Durbin–Watson test rejects the null hypothesis of no serial correlation at p<0.05.t p<0.1;tt
p<0.05;ttt p<0.01.
http://www.demographic-research.org 794
unemployment (as the unemployment rate is reported here as a decimal, not a percentage).
5.2 Distributed lag models
Interpreting the sign of the cumulative impact of economic conditions on health (adding up coefficient at lags 0 and 1 in Figure 6 (Tables A-11‒A-14 in the Appendix), and lags 0, 1, and 2 in Figure 7 (Tables A-15‒A-18 in the Appendix) most of the models suggest procyclicality of health, with the important exceptions of external causes of death, life expectancy, and infant mortality, where countercyclicality is indicated. It is important to note, however, that the relationship is in all but one instance (the relationship between life expectancy and real GDP per capita at lag 1 in Figure 7) found to be statistically nonsignificant when those health indicators are studied. It is also reasonable to assume that mortality due to external causes of death will not display a lagged response to economic conditions, as they are almost by definition more immediate than some of the other causes of death. When estimating models which included lag 0 and lag 1 coefficients, statistical significance was only found in a few of instances, mostly for the lag 0 coefficients. When two lags were included in the models, more statistically significant coefficients were found; mostly for females at lags 1 and 2 in the unadjusted models and at lags 0 and 1 in the age-adjusted models. In none of the models was the relationship between unemployment and health found to be statistically significant.
According to AIC and BIC values, contemporaneous models are however preferred in general to lagged models, both with only one as well as one and two lags. The main exception to this rule is in the case of infant mortality, where models that include one or two lags are preferred to the contemporaneous model. Of those three specifications, the models that include only one lag are the ones best fitted to our data, but even with that specification we do not find a statistically significant relationship.
Figure 6: Parameter estimates of lag models (1 lag) with 90% confidence intervals using HP-detrended variables
http://www.demographic-research.org 796
Figure 6: (Continued)
Figure 6: (Continued)
c) Dependent variable: unemployment rate
Notes: All variables are detrended using HP smoothing parameter γ=100. Economic indicators are dependent variables and
age-specific health outcomes are independent variables. Markers refer to regression coefficients and horizontal lines refer to 90% confidence intervals. X: The Durbin–Watson test rejects the null hypothesis of no serial correlation at p<0.05.t p<0.1;tt
http://www.demographic-research.org 798
Figure 7: Parameter estimates of lag models (2 lags) with 90% confidence intervals using HP-detrended variables
Figure 7: (Continued)
http://www.demographic-research.org 800
Figure 7: (Continued)
c) Dependent variable: unemployment rate
Notes: All variables are detrended using HP smoothing parameter γ=100. Economic indicators are dependent variables and
age-specific health outcomes are independent variables. Markers refer to regression coefficients and horizontal lines refer to 90% confidence intervals. X: The Durbin–Watson test rejects the null hypothesis of no serial correlation at p<0.05.t p<0.1;tt
p<0.05;ttt p<0.01.
6. Sensitivity analyses
parameter γ=10 than with γ=100, the statistically significant coefficients found in lagged regressions did not suffer from autocorrelation, excluding that as a possible explanation for the change in statistical significance.
The results for the alternative economic indicator, trade balance, are consistent with the main analyses (results available in the Appendix, Table A-27); the relationship is small in magnitude and almost never found to be statistically significant for either gender or any age group studied. The direction of oscillation for each health outcome was in line with the main analyses as well.
A priori the impact of migration on our health outcomes is ambiguous, where one could imagine that net immigration could signal an influx of relatively healthy individuals moving to Iceland, e.g., Icelanders returning home after finishing their studies abroad and foreign-born individuals migrating for work. On the other hand net immigration could entail less healthy individuals seeking health care provided by the state. The addition of net migration as an explanatory variable to the analysis did not affect our main conclusions for the economic indicators much, in terms of the sign of the coefficients or statistical significance (results available in the Appendix, Tables A-28 and A-29). In the majority of estimations the coefficient for net migration was positive if the economic variable indicated procyclicality and negative if it indicated countercyclicality. However, the net-migration coefficient was always very small in magnitude and only statistically significant in one instance, the relationship between unemployment and neoplasm mortality. Autocorrelation of the residuals was found in the same estimations with or without the addition of net migration to the models. Positive coefficients for net migration outnumbered negative ones in our analyses, and of the few that were found to be statistically significant, almost all were positive. In our data a positive net migration denotes immigrants outnumbering emigrants, hence net immigration. Therefore, a positive direction of the relationship signifies that net immigration is associated with worse health outcomes (higher mortality).
7. Discussion
http://www.demographic-research.org 802
us to conclude that the generalizability and comparability of our results are fairly strong.
Although the reliability of the data used is very high due to Iceland’s strong data collection organizations, an important internal validity concern is one regarding omitted variables. As autocorrelation of the error term is evident in many of the models used, it is a reasonable concern. However, our results are based on analyses of various economic indicators that are converted into stationary series by filtering or differencing and covering a number of business cycles, thus making it unlikely that omitted variables bias the results in a significant way with respect to business cycle oscillations. When considering variables that potentially connect the state of the economy with the health outcomes and could be omitted in our analyses, it is difficult to imagine that those would not be inherently a part of fluctuations in the overall economy, which is indexed in our study by real GDP, real GDP per capita, and the unemployment rate. The connecting variables may include those relating to leisure time, such as overtime at work and amount of daily sleep, or variables relating to the overall surroundings, such as pollution or traffic. One can reasonably argue that the economic indicators used in this study capture those factors. A potentially important exception to this might be a variable that captures technological advances in the medical field. Such advances can be assumed to affect the health indicators beneficially to various degrees, but it is hard to imagine that such an innovation would affect mortality rates in a substantial way.
For the time period studied, our overarching results do not show that a consistent statistically significant relationship exists between economic cycles and population health in Iceland, neither concurrently nor with up to a two year lag. Only in some subsets of the population was a statistically significant relationship found, most notably a countercyclical relationship for all-cause mortality in 45‒64 years old females. The health indicators studied have different determinants and are thus not expected to display the same relationship with the economy.
The estimated models in this study do not show that the two most widely used indicators of population health – life expectancy at birth and infant mortality – are affected by economic cycles. For life expectancy the results are not robust to different model specifications, but infant mortality fluctuates countercyclically in all models, i.e., increases in better economic conditions, although estimates are never statistically significant. For these specific population health indicators, it is not improbable that the role of factors such as technological advances and policy specifically directed at maternity and infant care are more important than economic cycles and are thus not captured in our models.
deteriorating economic conditions to affect health negatively due to increased stress or less access to health care due to financial constraints. On the other hand health could be affected positively in worse economic times due to a lower opportunity cost of leisure time, or financial constraints leading to better health behaviours, such as decreased smoking. With the two forces working against each other, the direction of the relationship studied here is hence ambiguous. Although cardiovascular diseases can take years to develop, heart attacks leading to death can be triggered by sudden shocks such as stress. We do not find a statistically significant relationship between economic conditions and mortality from circulatory health in any of the models used, but a different response (nonsignificant) by genders is suggested by our results. This is not surprising since many studies have found that males and females react differently to changes in the economy (Ruhm 2003, 2005; Ásgeirsdóttir et al. 2013, 2014a; Dave and Kelly 2012; Tapia Granados 2005b; Birgisdóttir et al. 2017). Our results are in contrast to some recent literature on the subject where both pro- and countercyclical relationships have been found (Ruhm 2000; Neumayer 2004; Gerdtham and Ruhm 2006; Ruhm 2003, 2005, 2007; Svensson 2010, 2007; Gerdtham and Johannesson 2005).
Mortality due to respiratory diseases was generally found to increase with better economic conditions, although coefficients were small and not statistically significant. A possible explanation for the positive (albeit small) coefficients found might be that a side product of increased economic activity, i.e., increased air pollution, can increase mortality due to respiratory diseases. Furthermore, an Icelandic study found that smoking, one of the most important health behaviours associated with respiratory mortality, decreased during the most recent economic recession (Ásgeirsdóttir et al. 2014), which could lead to decreased mortality due to respiratory diseases during economic downturns (and conversely, increased mortality with better economic conditions).
Mortality from neoplasms can reasonably be assumed to be unrelated to economic conditions. This category includes deaths from multiple sources of neoplasms that have both preventable and unpreventable causes, such as cancer of the skin, lungs, or breasts. Even though many malignant neoplasms are caused by various health behaviours that can be affected by the economy, such as smoking and indoor tanning, in most cases the illness takes some time to materialize and lead to death – more time than we model for in this study. It is therefore not surprising that no relationship was found for this health indicator.
http://www.demographic-research.org 804
Ruhm 2000) and one explanation for the findings is that business and recreational driving increases during economic expansion, leading to a larger volume of traffic, and therefore increased probability of traffic accidents.
The sensitivity analyses further showed that a limited relationship exists between population health and the state of the economy. By using a lower smoothing parameter when detrending the time series, very similar results were found as in the main analyses. For the age-specific analyses the strongest relationship was still found for the age group 45‒64, where the sign of the coefficients point to countercyclicality of health. The addition of net migration as an explanatory variable did not affect our main results. The sign of the coefficient was mostly positive and generally followed the cyclicality of the health outcomes; being negative when countercyclicality of health was indicated and positive when procyclicality was indicated. The results varied between diseases, genders, and age groups, as in the main analyses.
The main proxy for economic cycles in previous literature is the unemployment rate and is therefore the most applicable for comparisons. On a micro level, unemployment is perhaps the variable which has the potential to have the most immediate impact on a person’s health. On an aggregate level our results did not show unemployment to have a statistically significant impact except on for males, where an increase in the unemployment rate is associated with higher all-cause mortality. Furthermore, breaking down cause-specific mortality rates into age groups, a rise in the unemployment rate is found to have a statistically negative significant impact on all-cause mortality for women 45 to 64 years old, and on the 45‒64-year-old population as a whole. This is not a surprising finding, as this age group is part of the working-age population. This is also in line with research suggesting that worse economic conditions, as proxied by unemployment, might be beneficial to population health. However, statistical significance of these results was not robust to alternative model specifications, although the direction of the relationship remained stable. In the Icelandic economy the unemployment rate has historically been very low, all but to the point of full employment, and thus other economic indicators were explored as proxies for economic cycles. One of the main contributions of this paper is to use a variety of economic indicators used as proxies and to compare the results found by each of them. We find that for the dataset used here, the other proxies used are as valid as the unemployment rate and their consistency across analyses is no less than that of the unemployment rate. Since the economic indicators all capture different aspects of the economic cycle, using them together, as is done here, provides a more comprehensive analysis than often found in the literature.
2014; Ólafsdóttir, Hrafnkelsson, and Ásgeirsdóttir 2014; Ásgeirsdóttir et al. 2014, 2013; Hauksdóttir et al. 2013; McClure et al. 2012; Birgisdóttir et al. 2017). On a macro level it is still unclear how health was affected in the long run, but combined with research using microdata our understanding of the relationship between economic cycles and health improves. The use of economic variables other than unemployment rates (the most frequently used measure of the economic cycle in the literature) also adds to the emerging picture. Independently, both micro and macro studies provide a limited view on the relationship. The bulk of research on the relationship between business cycles and health stems from North America, in particular from the United States. We add to the literature by using Icelandic aggregate data for various economic indicators and health indicators for mortality data and population health in a time series setting. The most recent economic downturn, which started at the end of 2008, is represented in our data, which ends in 2014, but it is quite likely that data for following years contains more information on the health consequences of one of the sharpest declines in recent economic history. This data is awaited for future research on the subject. Furthermore, a time series analysis using Icelandic individual-level data could further shed light on the relationship between economic cycles and health and possible underlying mechanisms. Such data would allow for an analysis on the effects of economic cycles on specific groups of the population, e.g., groups that are vulnerable due to their socioeconomic status or unsecure employment. Moreover, future studies using other indicators for economic activity, such as GDP growth, and indicators for economic inequality, such as the Gini coefficient, are well warranted.
8. Acknowledgements
http://www.demographic-research.org 806
References
Acemoglu, D. and Johnson, S. (2007). Diseases and development: The effect of life expectancy on economic growth.Journal of Political Economy 115(6): 925‒985.
doi:10.1086/529000.
American Heart Association (2015). Coronary artery disease ‒ coronary heart disease [electronic resource]. Dallas: American Heart Association.http://www.heart.org/ HEARTORG/Conditions/More/MyHeartandStrokeNews/Coronary-Artery-Disease---The-ABCs-of-CAD_UCM_436416_Article.jsp#.WEq5Ui2LT3g
Antecol, H. and Bedard, K. (2006). Unhealthy assimilation: Why do immigrants converge to American health status levels? Demography 43(2): 337‒360.
doi:10.1353/dem.2006.0011.
Antillón, M., Lauderdale, D.S., and Mullahy, J. (2014). Sleep behavior and unemployment conditions. Economics and Human Biology 14: 22‒32.
doi:10.1016/j.ehb.2014.03.003.
Ariizumi, H. and Schirle, T. (2012). Are recessions really good for your health? Evidence from Canada. Social Science and Medicine 74(8): 1224‒1231.
doi:10.1016/j.socscimed.2011.12.038.
Ásgeirsdóttir, T.L., Berndsen, H.H., Guðmundsdóttir, B.Þ., Gunnarsdóttir, B.A., and Halldórsdóttir, H.J. (2013). The effect of obesity, alcohol misuse and smoking on employment and hours worked: Evidence from the Icelandic economic collapse. Review of Economics of the Household14(2): 313–335.doi:10.1007/ s11150-013-9225-6.
Ásgeirsdóttir, T.L., Corman, H., Noonan, K., Ólafsdóttir, Þ., and Reichman, N.E. (2014). Was the economic crisis of 2008 good for Icelanders? Impact on health behaviors. Economics and Human Biology 13: 1‒19. doi:10.1016/j.ehb.2013. 03.005.
Ásgeirsdóttir, T.L., Corman, H., Noonan, K., and Reichman, N.E. (2016). Lifecycle effects of a recession on health behaviors: Boom, bust, and recovery in Iceland.
Economics and Human Biology 20: 90‒107.doi:10.1016/j.ehb.2015.11.001.
Ásgeirsdóttir, T.L. and Ragnarsdóttir, D.Ó. (2014). Health-income inequality: The effects of the Icelandic economic collapse. International Journal for Equity in Health 13(1): 50‒62.doi:10.1186/1475-9276-13-50.
Ásgeirsdóttir, T.L. and Tryggvason, Á. (2014). Business cycles and workplace accidents in Iceland 1986‒2011.Icelandic Review of Politics and Administration
10(2): 397‒424.doi:10.13177/irpa.a.2014.10.2.11.
Ashraf, Q.H., Lester, A., and Weil, D.N. (2008). When does improving health raise GDP? Cambridge: National Bureau of Economic Research (Working Paper 14449).
Backus, D.K. and Kehoe, P.J. (1992). International evidence on the historical properties of business cycles.The American Economic Review 82(4): 864‒888.
Birgisdóttir, K.H., Jónsson, S.H., and Ásgeirsdóttir, T.L. (2017). Economic conditions, hypertension, and cardiovascular disease: Analysis of the Icelandic economic collapse.Health Economics Review 7(20).doi:10.1186/s13561-017-0157-3.
Bloom, D.E., Canning, D., and Sevilla, J. (2001). The effect of health on economic growth: Theory and evidence. Cambridge: National Bureau of Economic Research (Working Paper Series 8587).
Brenner, M.H. (1971). Economic changes and heart disease mortality. American Journal of Public Health 61(3): 606‒611.doi:10.2105/AJPH.61.3.606.
Brenner, M.H. (1973a). Fetal, infant, and maternal mortality during periods of economic instability. International Journal of Health Services 3(2): 145‒159.
doi:10.2190/UM5L-TVN7-VDFR-UU0B.
Brenner, M.H. (1973b). Mental illness and the economy. Cambridge: Harvard University Press.
Brenner, M.H. (1975). Trends in alcohol consumption and associated illnesses: Some effects of economic changes.American Journal of Public Health 65(12): 1279‒ 1292.doi:10.2105/AJPH.65.12.1279.
Cebolla-Boado, H. and Salazar, L. (2016). Differences in perinatal health between immigrant and native-origin children: Evidence from differentials in birth weight in Spain. Demographic Research 35(7): 167‒200. doi:10.4054/DemRes.2016. 35.7.
http://www.demographic-research.org 808
Central Bank of Iceland (2010). The economy of Iceland. Reykjavik: Central Bank of Iceland.
Charles, K.K. and DeCicca, P. (2008). Local labor market fluctuations and health: Is there a connection and for whom? Journal of Health Economics 27(6): 1532‒ 1550.doi:10.1016/j.jhealeco.2008.06.004.
Colell, E., Sánchez-Niubò, A., Delclos, G.L., Benavides, F.G., and Domingo-Salvany, A. (2015). Economic crisis and changes in drug use in the Spanish economically active population.Addiction 110(7): 1129‒1137.doi:10.1111/add.12923.
Dave, D.M. and Kelly, I.R. (2012). How does the business cycle affect eating habits?
Social Science and Medicine 74(2): 254‒262. doi:10.1016/j.socscimed.2011. 10.005.
Directorate of Health (n.d.). Number of deaths by causes of death (ICD-10) 2003–2012 [electronic resource]. Reyjkavík: Directorate of Health.http://www.landlaeknir. is/english/statistics/causes-of-death/
Directorate of Immigration (n.d.). Application process [electronic resource]. Reykjavík: Directorate of Immigration. https://www.utl.is/index.php/en/ application-process-permits
Directorate of Labour (n.d.). Atvinnuleysi frá 1980 ársmeðaltal [electronic resource]. Reyjkavík: Directorate of Labour. https://www.vinnumalastofnun.is/um-okkur/ tolfraedi-og-utgefid-efni/atvinnuleysistolur-i-excelskjolum
Economou, A., Nikolaou, A., and Theodossiou, I. (2008). Are recessions harmful to health after all? Evidence from the European Union. Journal of Economic Studies 35(5): 368‒384.doi:10.1108/01443580810903536.
EFTA (2015a). EEA Agreement [electronic resource]. Geneva: European Free Trade Association.http://www.efta.int/eea/eea-agreement
EFTA (2015b). The EFTA states [electronic resource]. Geneva: European Free Trade Association.http://www.efta.int/about-efta/the-efta-states
Eliason, M. and Storrie, D. (2009). Job loss is bad for your health: Swedish evidence on cause-specific hospitalization following involuntary job loss. Social Science and Medicine 68(8): 1396‒1406.doi:10.1016/j.socscimed.2009.01.021.
Falconi, A., Gemmill, A., Karasek, D., Goodman, J., Anderson, B., Lee, M., Bellows, B., and Catalano, R. (2016). Stroke-attributable death among older persons during the great recession. Economics and Human Biology 21: 56‒63.
doi:10.1016/j.ehb.2015.11.005.
Gerdtham, U.G. and Johannesson, M. (2003). A note on the effect of unemployment on mortality. Journal of Health Economics 22(3): 505‒518. doi:10.1016/S0167-6296(03)00004-3.
Gerdtham, U.G. and Johannesson, M. (2005). Business cycles and mortality: Results from Swedish microdata. Social Science and Medicine 60(1): 205‒218.
doi:10.1016/j.socscimed.2004.05.004.
Gerdtham, U.G. and Ruhm, C. (2006). Deaths rise in good economic times: Evidence from the OECD. Economics and Human Biology 4(3): 298‒316.
doi:10.1016/j.ehb.2006.04.001.
Gissler, M., Alexander, S., Macfarlane, A., Small, R., Stray-Pedersen, B., Zeitlin, J., Zimbeck, M., and Gagnon, A. (2009). Stillbirths and infant deaths among migrants in industrialized countries. Acta Obstetricia et Gynecologica Scandinavica 88(2): 134‒148.doi:10.1080/00016340802603805.
Gravelle, H.S.E., Hutchinson, G., and Stern, J. (1981). Mortality and unemployment: A critique of Brenner’s time-series analysis. The Lancet 318(8248): 675‒679.
doi:10.1016/S0140-6736(81)91007-2.
Guðjónsdóttir, G.R., Kristjánsson, M., Ólafsson, Ö., Arnar, D.O., Getz, L., Sigurðsson, J.Á., Guðmundsson, S., and Valdimarsdóttir, U.A. (2012). Immediate surge in female visits to the cardiac emergency department following the economic collapse in Iceland: An observational study.Emergency Medicine Journal 29(9): 694‒698.doi:10.1136/emermed-2011-200518.
Hauksdóttir, A., McClure, C., Jónsson, S.H., Ólafsson, Ö., and Valdimarsdóttir, U.A. (2013). Increased stress among women following an economic collapse: A prospective cohort study. American Journal of Epidemiology 177(9): 979‒988.
doi:10.1093/aje/kws347.
http://www.demographic-research.org 810
Hyman, I. (2001). Immigration and health. Ottawa: Health Canada (Health Policy Working Paper Series 01-05).
Jónsdóttir, S. and Ásgeirsdóttir, T.L. (2014). The effect of job loss on body weight during an economic collapse. European Journal of Health Economics 15(6): 567‒576.doi:10.1007/s10198-013-0494-z.
Kinge, J. and Kornstad, T. (2014). Assimilation effects on infant mortality among immigrants in Norway: Does maternal source country matter? Demographic Research 31(26): 779‒812.doi:10.4054/DemRes.2014.31.26.
Koo, J. and Cox, W.M. (2008). An economic interpretation of suicide cycles in Japan.
Contemporary Economic Policy 26(1): 162‒174.doi:10.1111/j.1465-7287.2007. 00042.x.
Lorentzen, P., McMillan, J., and Wacziarg, R. (2008). Death and development.Journal of Economic Growth 13(2): 81‒124.doi:10.1007/s10887-008-9029-3.
Marshall, J.R. and Funch, D.P. (1979). Mental illness and the economy: A critique and partial replication. Journal of Health and Social Behavior 20(3): 282‒289.
doi:10.2307/2136452.
Martin Bassols, N. and Vall Castelló, J. (2016). Effects of the great recession on drugs consumption in Spain. Economics and Human Biology 22: 103‒116.
doi:10.1016/j.ehb.2016.03.005.
Matthiasson, T. (2008). Spinning out of control: Iceland in crisis. Nordic Journal of Political Economy 34(3).
McClure, C.B., Valdimarsdóttir, U.A., Hauksdóttir, A., and Kawachi, I. (2012). Economic crisis and smoking behaviour: Prospective cohort study in Iceland.
BMJ Open 2(5): e001386.doi:10.1136/bmjopen-2012-001386.
Miller, D.L., Page, M.E., Stevens, A.H., and Filipski, M. (2009). Why are recessions good for your health? The American Economic Review 99(2): 122‒127.
doi:10.1257/aer.99.2.122.
Naimy, Z., Grytten, J., Monkerud, L., and Eskild, A. (2013). Perinatal mortality in non-Western migrants in Norway as compared to their countries of birth and to Norwegian women.Bmc Public Health 13(37).doi:10.1186/1471-2458-13-37.
OECD (2006). OECD Economic Surveys: Iceland 2006. Paris OECD Publishing.
Ólafsdóttir, Þ. and Ásgeirsdóttir, T.L. (2015). Gender differences in drinking behavior during an economic collapse: Evidence from Iceland. Review of Economics of the Household 13(4): 975–1001.doi:10.1007/s11150-015-9283-z.
Ólafsdóttir, Þ., Hrafnkelsson, B., and Ásgeirsdóttir, T.L. (2014). The Icelandic economic collapse, smoking, and the role of labor-market changes. European Journal of Health Economics16(4): 391–405.doi:10.1007/s10198-014-0580-x.
Ólafsdóttir, Þ., Hrafnkelsson, B., Þorgeirsson, G., and Ásgeirsdóttir, T.L. (2016). The tax-free year in Iceland: A natural experiment to explore the impact of a short-term increase in labor supply on the risk of heart attacks. Journal of Health Economics 49: 14‒27.doi:10.1016/j.jhealeco.2016.06.006.
Ray, J.G., Vermeulen, M.J., Schull, M.J., Singh, G., Shah, R., and Redelmeier, D.A. (2007). Results of the Recent Immigrant Pregnancy and Perinatal Long-term Evaluation Study (RIPPLES). Canadian Medical Association Journal 176(10): 1419‒1426.doi:10.1503/cmaj.061680.
Ruhm, C. (2000). Are recessions good for your health?Quarterly Journal of Economics
115(2): 617‒650.doi:10.1162/003355300554872.
Ruhm, C. (2003). Good times make you sick.Journal of Health Economics 22(4): 637‒ 658.doi:10.1016/S0167-6296(03)00041-9.
Ruhm, C. (2004). Macroeconomic conditions, health and mortality. Cambridge: National Bureau of Economic Research (Working Paper 11007). doi:10.3386/ w11007.
Ruhm, C. (2005). Healthy living in hard times. Journal of Health Economics 24(2): 341‒363.doi:10.1016/j.jhealeco.2004.09.007.
Ruhm, C. (2007). A healthy economy can break your heart. Demography 44(4): 829‒ 848.doi:10.1007/BF03208384.
Ruhm, C. (2015). Recessions, healthy no more?Journal of Health Economics 42: 17‒ 28.doi:10.1016/j.jhealeco.2015.03.004.
http://www.demographic-research.org 812
Statistics Iceland (n.d.-a). Consumer price index from 1939 [electronic resource]. Reykjavík: Statistics Iceland. http://px.hagstofa.is/pxen/pxweb/en/Efnahagur/ Efnahagur__visitolur__1_visitalaneysluverds__1_neysluverd/VIS01002.px/?rxi d=d87d069b-f46f-404b-9d8e-ea3c771e387f
Statistics Iceland (n.d.-b). Employment, unemployment and labour force [electronic resource]. Reykjavík: Statistics Iceland. http://www.statice.is/?PageID=1191 &src=https://rannsokn.hagstofa.is/pxen/Dialog/varval.asp?ma=VIN00001%26ti =Employment%2C+unemployment+and+labour+force+-+Orginal+Data+-+Monthly+2003-2013+++++++++++++++++++%26path=../Database/ vinnumarkadur/rannsoknir/%26lang=1%26units=Number/percent
Statistics Iceland (n.d.-c). External migration by sex and citizenship 1961‒2014 [electronic resource]. Reykjavík: Statistics Iceland. http://px.hagstofa.is/pxen/ pxweb/en/Ibuar/Ibuar__buferlaflutningar__buferlaflmillilanda/MAN01400.px/?r xid=63f7d7d1-461e-47ba-840d-471b4606e79c
Statistics Iceland (n.d.-d). Gross domestic product and gross national income 1945‒ 1980 [electronic resource]. Reykjavík: Statistics Iceland. http://www.statice.is/ Statistics/National-accounts-and-public-fin/National-accounts-overview
Statistics Iceland (n.d.-e). Gross domestic product and gross national income 1980‒ 2013 [electronic resource]. Reykjavík: Statistics Iceland. http://www.statice.is/ Statistics/National-accounts-and-public-fin/National-accounts-overview
Statistics Iceland (n.d.-f). Life expectancy and number of survivors 1971‒2015 [electronic resource]. Reykjavík: Statistics Iceland. http://px.hagstofa.is/pxen/ pxweb/en/Ibuar/Ibuar__Faeddirdanir__danir__danir/MAN05401.px/?rxid=38d8 08d0-d75e-41f9-9d1f-ee5f74dff88a
Statistics Iceland (n.d.-g). Population by country of birth, sex and age 1 January 1998‒ 2016 [electronic resource]. Reykjavík: Statistics Iceland. http://px.hagstofa.is/ pxen/pxweb/en/Ibuar/Ibuar__mannfjoldi__3_bakgrunnur__Faedingarland/MAN 12103.px/?rxid=1f7fed88-3868-47a8-b483-88b7e38a6fed
Statistics Iceland (n.d.-h). Population by sex and age 1841‒2014 [electronic resource]. Reykjavík: Statistics Iceland. http://www.statice.is/?PageID=1170&src=https:// rannsokn.hagstofa.is/pxen/Dialog/varval.asp?ma=MAN00101%26ti=Population +by+sex+and+age+1841-2014+++%26path=../Database/mannfjoldi/Yfirlit/%26 lang=1%26units=Number
Stuckler, D., Basu, S., Suhrcke, M., Coutts, A., and McKee, M. (2009). The public health effect of economic crises and alternative policy responses in Europe: An empirical analysis. The Lancet 374(9686): 315‒323. doi:10.1016/S0140-6736(09)
61124-7.
Svensson, M. (2007). Do not go breaking your heart: Do economic upturns really increase heart attack mortality? Social Science and Medicine 65(4): 833‒841.
doi:10.1016/j.socscimed.2007.04.015.
Svensson, M. (2010). Economic upturns are good for your heart but watch out for accidents: A study on Swedish regional data 1976–2005. Applied Economics
42(5): 615‒625.doi:10.1080/00036840701704519.
Tapia Granados, J.A. (2005a). Increasing mortality during the expansions of the US economy, 1900‒1996.International Journal of Epidemiology 34(6): 1194‒1202.
doi:10.1093/ije/dyi141.
Tapia Granados, J.A. (2005b). Recessions and mortality in Spain, 1980–1997.
European Journal of Population21(4): 393‒422.
Tapia Granados, J.A. (2008). Macroeconomic fluctuations and mortality in postwar Japan.Demography 45(2): 323‒343.doi:10.1353/dem.0.0008.
Tapia Granados, J.A. and Ionides, E.L. (2008). The reversal of the relation between economic growth and health progress: Sweden in the 19th and 20th centuries.
Journal of Health Economics 27(3): 544‒563. doi:10.1016/j.jhealeco.2007. 09.006.
Tapia Granados, J.A. and Ionides, E.L. (2011). Mortality and macroeconomic fluctuations in contemporary Sweden. European Journal of Population 27(2): 157‒184.doi:10.1007/s10680-011-9231-4.
Wagstaff, A. (1985). Time-series analysis of the relationship between unemployment and mortality: A survey of econometric critiques and replications of Brenner studies. Social Science and Medicine 21(9): 985‒996. doi:10.1016/0277-9536(85)90420-4.
Weil, D.N. (2005). Accounting for the effect of health on economic growth. Cambridge: National Bureau of Economic Research (Working Paper 11455).
http://www.demographic-research.org 814
Appendix
This Appendix contains result tables from sensitivity analyses as well as additional tables that were not included in the main article for the sake of brevity.
First, we summarize all variables used in the analysis in Table A-1.
Second, we include numerical results that correspond to Figures 4 through 7 in the main article. Those results can be found in Tables A-2, A-3‒A-5, A-11‒14, and A-15‒A-18.
Third, results tables from analyses where all variables have been first differenced are included here, but autocorrelation was a problem in these analyses. Tables A-6 and A-7 show parameter estimates of bivariate and age-adjusted models, respectively. Tables A-8‒A-10 show age-specific analyses, and Tables A-19‒A-26 show lag models.
http://www.demographic-research.org 816
Table A-1: Summary statistics
http://www.demographic-research.org 818
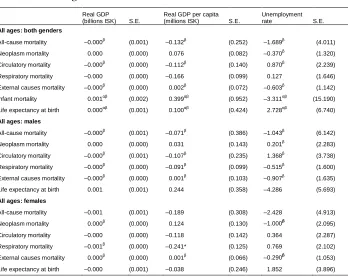
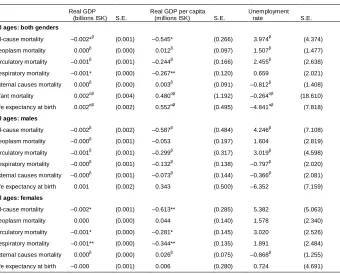
Table A-2: Parameter estimates of bivariate and age-adjusted models with HP-detrended variables
Bivariate model
Real GDP (billions ISK) S.E.
Real GDP per capita (millions ISK) S.E.
Unemployment
rate S.E.
All ages: both genders
All-cause mortality 0.000 (0.001) 0.075 (0.156) –0.768 (2.525)
Neoplasm mortality 0.000 (0.000) 0.056 (0.056) –0.248 (0.909)
Circulatory mortality –0.000 (0.000) –0.037 (0.081) 1.249 (1.288) Respiratory mortality –0.000 (0.000) –0.082 (0.065) 1.269 (1.049) External causes mortality 0.000 (0.000) 0.019 (0.040) –0.499 (0.633)
Infant mortality 0.001 (0.002) 0.360 (0.537) –1.417 (8.719)
Life expectancy at birth –0.001 (0.001) –0.266 (0.268) 3.217 (4.353)
All ages: males
All-cause mortality –0.000 (0.001) 0.070 (0.229) 0.069 (3.690)
Neoplasm mortality 0.000 (0.000) 0.070 (0.096) –0.466 (1.565)
Circulatory mortality –0.000β (0.000) –0.100β (0.129) 2.717β (2.046) Respiratory mortality –0.000 (0.000) –0.044 (0.060) 0.724 (0.961) External causes mortality 0.000 (0.000) 0.034 (0.058) –0.966 (0.930) Life expectancy at birth –0.000 (0.001) –0.005 (0.251) –1.926 (4.034)
All ages: females
All-cause mortality 0.000 (0.001) 0.082 (0.191) –1.650 (3.069)
Neoplasm mortality 0.000 (0.000) 0.043 (0.079) –0.054 (1.275)
Circulatory mortality 0.000 (0.000) 0.027 (0.089) –0.228 (1.429)
Respiratory mortality –0.000 (0.000) –0.120 (0.086) 1.813 (1.390) External causes mortality 0.000 (0.000) 0.003 (0.036) –0.018 (0.581) Life expectancy at birth –0.001 (0.001) –0.283 (0.177) 4.349 (2.862) Age-adjusted model
All ages: both genders
All-cause mortality –0.001 (0.001) –0.326 (0.202) 3.769 (2.670)
Neoplasm mortality –0.000 (0.000) –0.055 (0.073) 1.407 (0.930)
Circulatory mortality –0.000 (0.000) –0.132 (0.118) 2.478 (1.516) Respiratory mortality –0.000 (0.000) –0.163* (0.095) 1.357 (1.284) External causes mortality 0.000 (0.000) 0.032 (0.060) –0.654 (0.777)
Infant mortality 0.003 (0.003) 0.764 (0.806) –2.282 (10.720)
Life expectancy at birth 0.000 (0.001) 0.186 (0.366) –2.905 (4.791)
All ages: males
All-cause mortality –0.002 (0.001) –0.703* (0.354) 7.258* (4.119)
Neoplasm mortality –0.001 (0.001) –0.210 (0.156) 2.510 (1.792)
Circulatory mortality –0.001 (0.001) –0.303 (0.229) 4.430*β (2.574) Respiratory mortality –0.000 (0.000) –0.147 (0.106) 1.204 (1.237) External causes mortality 0.000 (0.000) 0.002 (0.106) –0.855 (1.206) Life expectancy at birth 0.001 (0.001) 0.284 (0.444) –4.441 (5.068)
All ages: females
All–cause mortality –0.001 (0.001) –0.254 (0.220) 2.665 (3.365)
Neoplasm mortality 0.000 (0.000) –0.004 (0.100) 1.106 (1.496)
Circulatory mortality –0.000 (0.000) –0.077 (0.109) 1.347 (1.641) Respiratory mortality –0.001 (0.000) –0.191* (0.106) 1.757 (1.653) External causes mortality 0.000 (0.000) 0.023 (0.046) –0.217 (0.702) Life expectancy at birth –0.001 (0.001) –0.279 (0.230) 4.343 (3.461)
Notes: N=34. Standard errors in parentheses. All variables are detrended using HP smoothing parameter γ=100. Additional control
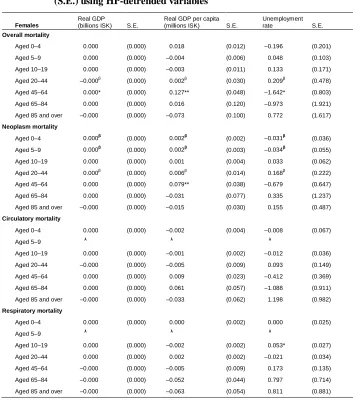
Table A-3: Age-specific parameter estimates with standard errors (S.E.) using HP-detrended variables
Full sample
Real GDP (billions ISK) S.E.
Real GDP per capita (millions ISK) S.E.
Unemployment
rate S.E.
All-cause mortality
Aged 0–4 0.000β (0.000) 0.009 (0.012) –0.021 (0.189)
Aged 5–9 0.000 (0.000) –0.002 (0.005) 0.026 (0.087)
Aged 10–19 0.000 (0.000) 0.008 (0.010) –0.057 (0.160)
Aged 20–44 –0.000 (0.000) –0.001 (0.025) 0.013 (0.405)
Aged 45–64 0.000 (0.000) 0.074* (0.037) –1.180* (0.597)
Aged 65–84 0.000 (0.000) 0.028 (0.093) –0.116 (1.486)
Aged 85 and over –0.000 (0.000) –0.040 (0.069) 0.568 (1.120)
Neoplasm mortality
Aged 0–4 0.000** (0.000) 0.003** (0.002) –0.030 (0.026)
Aged 5–9 0.000β (0.000) 0.000β (0.003) –0.013β (0.046)
Aged 10–19 0.000 (0.000) 0.002 (0.004) 0.026 (0.059)
Aged 20–44 –0.000 (0.000) –0.003 (0.009) 0.159 (0.147)
Aged 45–64 0.000 (0.000) 0.054* (0.029) –0.339 (0.494)
Aged 65–84 0.000 (0.000) 0.007 (0.049) –0.323 (0.787)
Aged 85 and over –0.000 (0.000) –0.008 (0.022) 0.271 (0.357)
Circulatory mortality
Aged 0–4 0.000 (0.000) –0.001 (0.002) 0.004 (0.039)
Aged 5–9 0.000 (0.000) 0.000 (0.000) 0.009 (0.006)
Aged 10–19 0.000 (0.000) –0.001 (0.002) 0.003 (0.030)
Aged 20–44 –0.000β (0.000) –0.008β (0.008) 0.117β (0.130)
Aged 45–64 –0.000 (0.000) –0.003 (0.023) –0.249 (0.372)
Aged 65–84 –0.000 (0.000) –0.002 (0.052) 0.390 (0.831)
Aged 85 and over –0.000 (0.000) –0.022 (0.040) 0.975 (0.621)
Respiratory mortality
Aged 0–4 0.000 (0.000) 0.001 (0.002) –0.021 (0.026)
Aged 5–9 0.000 (0.000) 0.000 (0.001) –0.001 (0.011)
Aged 10–19 0.000 (0.000) 0.000 (0.001) 0.017 (0.017)
Aged 20–44 –0.000 (0.000) –0.001 (0.002) –0.017 (0.039)
Aged 45–64 0.000β (0.000) 0.002β (0.007) 0.030β (0.106)
Aged 65–84 –0.000 (0.000) –0.025 (0.033) 0.598 (0.521)
http://www.demographic-research.org 820
Table A-4: (Continued)
Full sample
Real GDP (billions ISK) S.E.
Real GDP per capita (millions ISK) S.E.
Unemployment
rate S.E.
External causes mortality
Aged 0–4 0.000β (0.000) –0.006β (0.004) 0.066β (0.071)
Aged 5–9 0.000 (0.000) –0.003 (0.004) 0.052 (0.059)
Aged 10–19 0.000 (0.000) 0.010 (0.008) –0.156 (0.134)
Aged 20–44 0.000 (0.000) 0.012 (0.020) –0.260 (0.321)
Aged 45–64 0.000β (0.000) 0.004β (0.013) –0.065β (0.207)
Aged 65–84 0.000 (0.000) 0.004 (0.013) –0.141 (0.203)
Aged 85 and over –0.000 (0.000) –0.003 (0.009) 0.005 (0.153)
Temporary life expectancy
Aged 0 (for 5 years) 0.000β (0.000) 0.019β (0.016) –0.124β (0.273) Aged 5 (for 5 years) 0.000 β (0.000) 0.017β (0.023) –0.080β (0.368) Aged 10 (for 10 years) 0.000*** β (0.000) 0.034**β (0.014) –0.134 (0.251) At age 20 (for 25 years) –0.000β (0.000) –0.028β (0.019) 0.147β (0.316) At age 45 (for 20 years) 0.000β (0.000) 0.013β (0.024) –0.381β (0.394) Aged 65 (for 20 years) –0.000 (0.000) –0.003 (0.054) –0.414 (0.846) Aged 85 (for 10 years) 0.000** (0.000) 0.142***β (0.044) –2.317***β (0.718)
Notes: N=34. Standard errors in parentheses. All variables are detrended using HP smoothing parameter γ=100.βThe Durbin–
Watson test rejects the null hypothesis of no serial correlation at p<0.05. *p<0.1; **p<0.05;***p<0.01.
Table A-5: Age-specific parameter estimates for males with standard errors (S.E.) using HP-detrended variables
Males
Real GDP (billions ISK) S.E.
Real GDP per capita (millions ISK) S.E.
Unemployment
rate S.E.
Overall mortality
Aged 0–4 0.000β (0.000) 0.000β (0.019) 0.153β (0.310)
Aged 5–9 0.000 (0.000) 0.000 (0.008) 0.004 (0.130)
Aged 10–19 0.000 (0.000) 0.018 (0.016) –0.245 (0.258)
Aged 20–44 –0.000 (0.000) –0.006 (0.044) –0.176 (0.711)
Aged 45–64 0.000β (0.000) 0.021β (0.064) –0.722β (1.029)
Aged 65–84 –0.000 (0.001) 0.038 (0.136) 0.733 (2.200)
Aged 85 and over –0.000 (0.000) –0.001 (0.076) 0.320 (1.228)
Neoplasm mortality
Aged 0–4 0.000** (0.000) 0.004** (0.002) –0.028 (0.034)
Aged 5–9 0.000 (0.000) –0.001 (0.004) 0.009 (0.059)
Aged 10–19 0.000 (0.000) 0.004 (0.005) 0.021 (0.085)
Aged 20–44 –0.000 (0.000) –0.012 (0.015) 0.148 (0.236)
Aged 45–64 0.000 (0.000) 0.031 (0.041) –0.017 (0.659)
Aged 65–84 0.000 (0.000) 0.045 (0.060) –0.976 (0.952)