© 2006 by the author(s). This paper is Open Access and is published in Biological Procedures Online under license from the author(s). Copying, printing, redistribution and storage permitted. Journal © 1997-2006 Biological Procedures Online - www.biologicalprocedures.com
doi:10.1251/bpo115 March 23, 2006
Techniques of EMG signal analysis: detection, processing, classification and
applications
M. B. I. Reaz,
1*M. S. Hussain
1and F. Mohd-Yasin
11Faculty of Engineering, Multimedia University, 63100 Cyberjaya, Selangor, Malaysia.
*Corresponding Author: M.B.I. Raez, Faculty of Engineering, Multimedia University, 63100 Cyberjaya, Selangor, Malaysia. Email: [email protected]
Submitted: October 4, 2005; Revised: January 9, 2006; Accepted: January 18, 2006.
Indexing terms: Electromyography; Fourier Analysis; Muscles; Nervous System.
ABSTRACT
Electromyography (EMG) signals can be used for clinical/biomedical applications, Evolvable Hardware Chip (EHW) development, and modern human computer interaction. EMG signals acquired from muscles require advanced methods for detection, decomposition, processing, and classification. The purpose of this paper is to illustrate the various methodologies and algorithms for EMG signal analysis to provide efficient and effective ways of understanding the signal and its nature. We further point up some of the hardware implementations using EMG focusing on applications related to prosthetic hand control, grasp recognition, and human computer interaction. A comparison study is also given to show performance of various EMG signal analysis methods. This paper provides researchers a good understanding of EMG signal and its analysis procedures. This knowledge will help them develop more powerful, flexible, and efficient applications.
INTRODUCTION
Biomedical signal means a collective electrical signal acquired from any organ that represents a physical variable of interest. This signal is normally a function of time and is describable in terms of its amplitude, frequency and phase. The EMG signal is a biomedical signal that measures electrical currents generated in muscles during its contraction representing neuromuscular activities. The nervous system always controls the muscle activity (contraction/relaxation). Hence, the EMG signal is a complicated signal, which is controlled by the nervous system and is dependent on the anatomical and physiological properties of muscles. EMG signal acquires noise while traveling through different tissues. Moreover, the EMG detector, particularly if it is at the surface of the skin, collects signals from different motor units at a time which may generate interaction of different signals. Detection of EMG signals with powerful and advance methodologies
investigation to classify the actual problems of EMG signals analysis and justify the accepted measures.
The technology of EMG recording is relatively new. There are still limitations in detection and characterization of existing nonlinearities in the surface electromyography (sEMG, a special technique for studying muscle signals) signal, estimation of the phase, acquiring exact information due to derivation from normality (1, 2) Traditional system reconstruction algorithms have various limitations and considerable computational complexity and many show high variance (1). Recent advances in technologies of signal processing and mathematical models have made it practical to develop advanced EMG detection and analysis techniques. Various mathematical techniques and Artificial Intelligence (AI) have received extensive attraction. Mathematical models include wavelet transform, time-frequency approaches, Fourier transform, Wigner-Ville Distribution (WVD), statistical measures, and higher-order statistics. AI approaches towards signal recognition include Artificial Neural Networks (ANN), dynamic recurrent neural networks (DRNN), and fuzzy logic system. Genetic Algorithm (GA) has also been applied in evolvable hardware chip for the mapping of EMG inputs to desired hand actions. Wavelet transform is well suited to non-stationary signals like EMG. Time-frequency approach using WVD in hardware could allow for a real-time instrument that can be used for specific motor unit training in biofeedback situations. Higher-order statistical (HOS) methods may be used for analyzing the EMG signal due to the unique properties of HOS applied to random time series. The bispectrum or third-order spectrum has the advantage of suppressing Gaussian noise.
This paper firstly gives a brief explanation about EMG signal and a short historical background of EMG signal analysis. This is followed by highlighting the up-to-date detection, decomposition, processing, and classification methods of EMG signal along with a comparison study. Finally, some hardware implementations and applications of EMG have been discussed.
MATERIALS AND METHODS
EMG: anatomical and physiological background
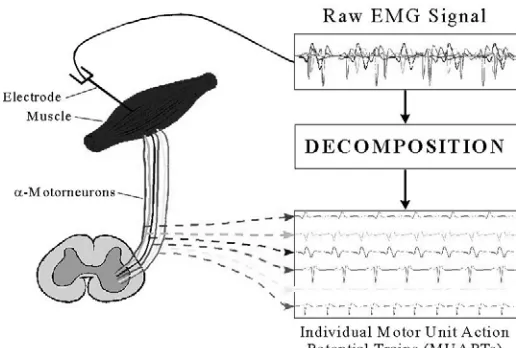
EMG stands for electromyography. It is the study of muscle electrical signals. EMG is sometimes referred to as myoelectric activity. Muscle tissue conducts electrical potentials similar to the way nerves do and the name given to these electrical signals is the muscle action potential. Surface EMG is a method of recording the information present in these muscle action potentials. When detecting and recording the EMG signal, there are two main issues of concern that influence the fidelity of the signal. The first is the signal-to-noise ratio. That is, the ratio of the energy in the EMG signals to the energy in the noise signal. In general, noise is defined as electrical signals that are not part of the desired EMG signal. The other issue is the distortion of the signal, meaning that the relative contribution of any frequency component in the EMG signal should not be altered. Two types of electrodes have been used to acquire muscle signal: invasive electrode and non-invasive electrode. When EMG is acquired from electrodes mounted directly on the skin, the signal is a composite of all the muscle fiber action potentials occurring in the muscles underlying the skin. These action potentials occur at random intervals. So at any one moment, the EMG signal may be either positive or negative voltage. Individual muscle fiber action potentials are sometimes acquired using wire or needle electrodes placed directly in the muscle. The combination of the muscle fiber action potentials from all the muscle fibers of a single motor unit is the motor unit action potential (MUAP) which can be detected by a skin surface electrode (non-invasive) located near this field, or by a needle electrode (invasive) inserted in the muscle (3). Equation 1 shows a simple model of the EMG signal:
∑
−=
+
−
=
10
)
(
)
(
)
(
)
(
Nr
n
w
r
n
e
r
h
n
x
(1)where x(n), modeled EMG signal, e(n), point processed, represents the firing impulse, h(r), represents the MUAP,
w(n), zero mean addictive white Gaussian noise and N is the number of motor unit firings.
processed to eliminate low-frequency or high-frequency noise, or other possible artifacts. Frequently, the user is interested in the amplitude of the signal. Consequently, the signal is frequently rectified and averaged in some format to indicate EMG amplitude.
The nervous system is both the controlling and communications system of the body. This system consists of a large number of excitable connected cells called neurons that communicate with different parts of the body by means of electrical signals, which are rapid and specific. The nervous system consists of three main parts: the brain, the spinal cord and the peripheral nerves. The neurons are the basic structural unit of the nervous system and vary considerably in size and shape. Neurons are highly specialized cells that conduct messages in the form of nerve impulses from one part of the body to another.
A muscle is composed of bundles of specialized cells capable of contraction and relaxation. The primary function of these specialized cells is to generate forces, movements and the ability to communicate such as speech or writing or other modes of expression. Muscle tissue has extensibility and elasticity. It has the ability to receive and respond to stimuli and can be shortened or contracted. Muscle tissue has four key functions: producing motion, moving substance within the body, providing stabilization, and generating heat. Three types of muscle tissue can be identified on the basis of structure, contractile properties, and control mechanisms: (i) skeletal muscle, (ii) smooth muscle, and (iii) cardiac muscle. The EMG is applied to the study of skeletal muscle. The skeletal muscle tissue is attached to the bone and its contraction is responsible for supporting and moving the skeleton. The contraction of skeletal muscle is initiated by impulses in the neurons to the muscle and is usually under voluntary control. Skeletal muscle fibers are well-supplied with neurons for its contraction. This particular type of neuron is called a “motor neuron”and it approaches close to muscle tissue, but is not actually connected to it. One motor neuron usually supplies stimulation to many muscle fibers. The human body as a whole is electrically neutral; it has the same number of positive and negative charges. But in the resting state, the nerve cell membrane is polarized due to differences in the concentrations and ionic
composition across the plasma membrane. A potential difference exists between the intra-cellular and extra-cellular fluids of the cell. In response to a stimulus from the neuron, a muscle fiber depolarizes as the signal propagates along its surface and the fiber twitches. This depolarization, accompanied by a movement of ions, generates an electric field near each muscle fiber. An EMG signal is the train of Motor Unit Action Potential (MUAP) showing the muscle response to neural stimulation. The EMG signal appears random in nature and is generally modeled as a filtered impulse process where the MUAP is the filter and the impulse process stands for the neuron pulses, often modeled as a Poisson process (3). Figure 1 shows the process of acquiring EMG signal and the decomposition to achieve the MUAPs.
Fig. 1: EMG signal and decomposition of MUAPs.
EMG: the history
the electrical signals from muscles. Because of the stochastic nature of the myoelectric signal, only rough information could be obtained from its observation. The capability of detecting electromyographic signals improved steadily from the 1930s through the 1950s and researchers began to use improved electrodes more widely for the study of muscles (1). Clinical use of surface EMG for the treatment of more specific disorders began in the 1960s. Hardyck and his researchers were the first (1966) practitioners to use sEMG (5). In the early 1980s, Cram and Steger introduced a clinical method for scanning a variety of muscles using an EMG sensing device (5).
It is not until the middle of the 1980s that integration techniques in electrodes had sufficiently advanced to allow batch production of the required small and lightweight instrumentation and amplifiers. At present a number of suitable amplifiers are commercially available. In the early 1980s, cables became available which produce artifacts in the desired microvolt range. During the past 15 years, research has resulted in a better understanding of the properties of surface EMG recording. In recent years, surface electromyography is increasingly used for recording from superficial muscles in clinical protocols, where intramuscular electrodes are used for deep muscle only (2, 4).
There are many applications for the use of EMG. EMG is used clinically for the diagnosis of neurological and neuromuscular problems. It is used diagnostically by gait laboratories and by clinicians trained in the use of biofeedback or ergonomic assessment. EMG is also used in many types of research laboratories, including those involved in biomechanics, motor control, neuromuscular physiology, movement disorders, postural control, and physical therapy.
Electrical noise and factors affecting EMG signal
The amplitude range of EMG signal is 0-10 mV (+5 to -5) prior to amplification. EMG signals acquire noise while traveling through different tissue. It is important to understand the characteristics of the electrical noise. Electrical noise, which will affect EMG signals, can be categorized into the following types:
1. Inherent noise in electronics equipment: All electronics equipment generate noise. This noise cannot be
eliminated; using high quality electronic components can only reduce it.
2. Ambient noise: Electromagnetic radiation is the source of this kind of noise. The surfaces of our bodies are constantly inundated with electric-magnetic radiation and it is virtually impossible to avoid exposure to it on the surface of earth. The ambient noise may have amplitude that is one to three orders of magnitude greater than the EMG signal.
3. Motion artifact: When motion artifact is introduced to the system, the information is skewed. Motion artifact causes irregularities in the data. There are two main sources for motion artifact: 1) electrode interface and 2) electrode cable. Motion artifact can be reduced by proper design of the electronics circuitry and set-up.
4. Inherent instability of signal: The amplitude of EMG is random in nature. EMG signal is affected by the firing rate of the motor units, which, in most conditions, fire in the frequency region of 0 to 20 Hz. This kind of noise is considered as unwanted and the removal of the noise is important.
The factors that mainly affect the EMG signal can also be classified. This kind of classification is set so that EMG signal analysis algorithms can be optimized and equipments can be designed in a consistent manner. Factors affecting EMG signal falls into three basic categories:
1. Causative Factors: This is the direct affect on signals. Causative factors can be divided into two classes:
i. Extrinsic: This is due to electrode structure and placement. Factors like area of the detection surface, shape of electrode, distance between electrode detection surface, location of electrode with respect to the motor points in the muscle, location of the muscle electrode on the muscle surface with respect to the lateral edge of the muscle, orientation of the detection surfaces with respect to the muscle fibers mainly have an effect on EMG signal.
2. Intermediate Factors: Intermediate factors are physical and physiological phenomena influenced by one or more causative factors. Reasons behind this can be the band-pass filtering aspects of the electrode alone with its detection volume, superposition of action potentials in the detected EMG signal, conduction velocity of the action potential that propagate along the muscle fiber membrane. Even crosstalk from nearby muscle can cause Intermediate Factors.
3. Deterministic Factors: These are influenced by Intermediate Factors. The number of active motor units, motor firing rate, and mechanical interaction between muscle fibers have a direct bearing on the information in the EMG signal and the recorded force. Amplitude, duration, and shape of the motor unit action potential can also be responsible.
The maximization of the quality of EMG signal can be done by the following ways:
1. The signal-to-noise ratio should contain the highest amount of information from EMG signal as possible and minimum amount of noise contamination. 2. The distortion of EMG signal must be as minimal as
possible with no unnecessary filtering and distortion of signal peaks and notch filters are not recommended.
During the EMG signal processing, only positive values are analyzed. When half-wave rectification is performed, all negative data is discarded and positive data is kept. The absolute value of each data point is used during full-wave rectification. Usually for rectification, full-full-wave rectification is preferred.
EMG signal detection
Precise detection of discrete events in the sEMG (like the phase change in the activity pattern associated with the initiation of the rapid motor response) is an important issue in the analysis of the motor system. Several methods have been proposed for detecting the on and off timing of the muscle.
The most common method for resolving motor-related events from EMG signals consists of visual inspection by trained observers. The “single-threshold method,” which compares the EMG signal with a fixed threshold, is the most intuitive and common computer-based method of
time-locating the onset of muscle contraction activity (6). This technique is based on the comparison of the rectified raw signals and an amplitude threshold whose value depends on the mean power of the background noise (7). The method can be useful in overcoming some of the problems related to visual inspection. However, this kind of approach is generally not satisfactory, since measured results depend strongly on the choice of threshold. This kind of method often rely on criteria that are too heuristic and does not allow the user to set independently the detection and false alarm probabilities (8). In “single-threshold method,” the relationship between the probability of detection Pdk and the
probability Pγ that a noise sample is above the threshold
γ is given by equation 2.
+
=
10
10
1
)
ln(
exp
SNRdk
P
P
γ (2)In 1984, Winter (9) observed that this approach is generally unsatisfactory, since it strongly depends on the choice of the threshold. To overcome the “single-threshold” problems, Bornato et al. (8) introduced “double-threshold detection” method in 1998. Double-threshold detectors are superior to single-Double-threshold because they yield higher detection probability. Double-threshold detectors allow the user to adopt the link between false alarm and detection probability with a higher degree of freedom than single-threshold. The user can tune the detector according to different optimal criteria, thus, adapting its performances to the characteristics of each specific signal and application (8). The sEMG signal recorded during voluntary dynamic contractions may be considered as a zero-mean Gaussian process s(t)∈N(0,σs) modulated by the muscle activity
and corrupted by an independent zero-mean Gaussian additive noise n(t)∈N(0,σn). If the probability of detection
is Pd then the double-threshold method is given by
equation 3.
(
)
m kdk k
dk m
r k
d
k
P
P
m
P
o
−
=
−
∑
=
1
(3)observation window, m. Their values are selected to minimize the value of the false-alarm probability and maximize Pd for each specific signal-to-noise ratio (SNR)
(8). In 2004, Lanyi and Adler (10) found that the double-threshold method proposed by Bornato is complex and computationally expensive, requiring a whitening of the signal. It is also not very sensitive. Lanyi and Andy proposed a new algorithm based on the double-threshold method that is more sensitive, stable, and efficient with decreased computation cost. For specific applications, besides the accuracy in the detection, the speed of the algorithm can be an important consideration. Algorithms with high computation time are unsuitable for online detection. One specific drawback to the method of Bornato et al. (8) is the
detection probability to be maximum when Pfa is fixed,
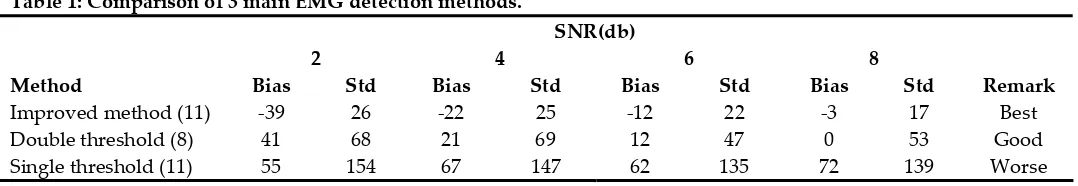
the second threshold has to be chosen as equal to “1.” The second threshold is fixed during detection, which implies that the double-threshold detector actually becomes single-threshold detector. This method does not require the signal-whitening step, which is needed previously. The whitening process takes a lot of computation time. Moreover, the whitening process reduces probability of the signal. This feature will cause the detection to miss a part of activation interval. The methods proposed by Lanyi and Adler (10) provides a fast and more reliable muscle on-off detection. Table 1 shows the comparison of the different detection methods at a glance based on research works by Merlo and Farina (11) in 2003.
Table 1: Comparison of 3 main EMG detection methods.
SNR(db)
2 4 6 8
Method Bias Std Bias Std Bias Std Bias Std Remark
Improved method (11) -39 26 -22 25 -12 22 -3 17 Best
Double threshold (8) 41 68 21 69 12 47 0 53 Good
Single threshold (11) 55 154 67 147 62 135 72 139 Worse
EMG signal decomposition
EMG signals are the superposition of activities of multiple motor units. It is necessary to decompose the EMG signal to reveal the mechanisms pertaining to muscle and nerve control. Various techniques have been devised with regards to EMG decomposition.
Decomposition of EMG signal has been done by wavelet spectrum matching and principle component analysis of wavelet coefficients. According to Jianjung et al. (12), more than one single motor unit (SMU) potential will be registered at same time overlapping with each other, especially during a strong muscle contraction. In 1997, they developed a technique using wavelet transform to classify SMU potentials and to decompose EMG signals into their constituent SMU potentials. The distinction of this technique is that it measures waveform similarity of SMU potentials from wavelet domain, which is very advantageous. This technique was based on spectrummatching in wavelet domain. Spectrum matching technique is sometimes considered to be more effective than waveform matching techniques, especially
EMG signal decomposition using non-linear least mean square (LMS) optimization of higher-order cumulants has been proposed by Eric and Damjan (15) in 2002. Their decomposition is based on the third-order cumulants whose values enter as coefficients of nonlinear system of equations. The system is solved by nonlinear LMS optimization. For this technique a multiple-input multiple-output model was used as it can describe several MUAP impositions of EMG signal.
EMG signal processing
Raw EMG offers us valuable information in a particularly useless form. This information is useful only if it can be quantified. Various signal-processing methods are applied on raw EMG to achieve the accurate and actual EMG signal. This section gives a review on EMG signal processing using the various methods.
Wavelet analysis
Both the time and frequency domain approaches have been attempted in the past. The wavelet transform (WT) is an efficient mathematical tool for local analysis of non-stationary and fast transient signals. One of the main properties of WT is that it can be implemented by means of a discrete time filter bank. The Fourier transforms of the wavelets are referred as WT filters. The WT represents a very suitable method for the classification of EMG signals.
Guglielminotti and Merletti (16) theorized that if the wavelet analysis is chosen so as to match the shape of the MUAP, the resulting WT yields the best possible energy localization in the time-scale plane (16). In 1997, Laterza and Olmo (17) found out that WT is an alternative to other time frequency representations with the advantage of being linear, yielding a multiresolution representation and not being affected by crossterms; this is particularly relevant when dealing with multicomponent signals. Under certain conditions, the EMG signal can be considered as the sum of scaled delayed versions of a single prototype. Based on Guglielminotti’s theory, Laterza and Olmo (17) have used wavelet analysis to match the shape of the MUAP. For a unipolar recorded signal and under certain hypotheses presented by Gabor in 1946 (18), the typical MUAP shape can be approximated as the second-order derivative of a
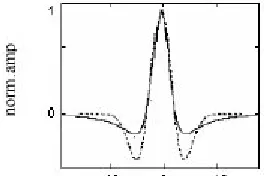
Gaussian distribution. The result suggested using the well-known Mexican hat wavelet, which is indeed the second-order derivative of a Gaussian distribution. The comparison between Mexican hat wavelet and typical unipolar MUAP shape is shown inFigure 2. Based on the research, Laterza and Olmo concluded that the WT is particularly useful for MUAP detection in the presence of additive white noise. In this situation, the noise contributions are spread over the entire time scale plane, independently of the wavelet used. The disadvantage of this proposal (17) was that the Mexican hat wavelet is not perfectly matched to the MUAP shape. Therefore, the obtained results are likely to be subject to further improvement if a perfect matching is performed. In 1998, Ismail and Asfour (19) came with a theory saying that, the most common method used to determine the frequency spectrum of EMG are the fast and short term Fourier transforms (FFT and SFT). But they also concluded that the major drawback of these transformation methods is that they assume that the signal is stationary. However, EMG signals are non-stationary.
Fig. 2: Comparison between Mexican hat wavelet and typical unipolar MUAP shape.
In 1999, Pattichis and Pattichis (20) discovered that the WT can also be used to analyze signals at different resolution levels. According to the theory, the process of analyzing signals at different resolution level is known as multiresolution analysis. They analyzed the relationship between wavelet coefficients and the time-frequency plane. The WT algorithm consists of the decomposition phase and reconstruction phases. Pattichis and Pattichis briefly outlines how coefficients from each stage of the WT can be used to construct functional approximation to the original signal. Given signal samples x0, x1, x2….., the
corresponding continuous time signal is given by equation 4:
( )
=
∑
(
−
)
k k
o
t
x
t
k
where
φ
(
t
−
k
)
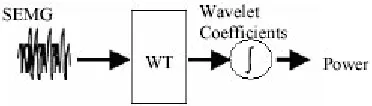
is called a scaling function. This assumes that the signal samples are weighted averages of the continuous signal.Again in 2003, Kumar et al. (21) came with a similar kind of proposal saying that the WT decomposes signal into several multiresolution components according to a basis function called “wavelet function” (WF). The WF is both dilated and translated in the time undertaking a two-dimensional cross correlation with the time domain sEMG signal. This method can be seen as a mathematical microscope that provides a tool to detect and characterize a short time component within a nonstationary signal. It is the technique that provides information related to the time-frequency variation of the signal. Kumar et al. also concluded that the Short Fourier Transform (SFT) with the relatively short time windows can attempt to track spectral variation with time, but does not adopt an optimal time or frequency resolution for the nonstationary signal. In (21), sEMG has been decomposed using WT with various WF and the output of the power transform domain is calculated and used as the deciding parameter in choosing the WF that provides the best contrast between sEMG cases. As a result of their research activity, it can be said that using sEMG and wavelet transforms, it is possible to determine the muscle fatigue (muscle failure) status simply by determining the Sym4 or Sym5 wavelet decomposition of the signal at level 8 and 9 (out of 10 levels). Figure 3 shows the experimental procedure.
Fig. 3: Block diagram of the experiment procedure.
Time-frequency approach
Attempts to gain quantitative information from EMG recordings have been extensively investigated when signal is represented as function of time (time domain). Cohen class transformation, Wigner-Ville distribution (WVD), and Choi-Williams distribution are some of the time-frequency approaches used for EMG signal processing.
Piper (22) showed at the beginning of this century (1912) that during a sustained muscle contraction the spectral components of the surface myoelectric signal are compressed towards the lower frequencies. The mechanisms that regulate this phenomenon have only been clarified during the last two decades. When sEMG is recorded under dynamic contractions, the assumption of stationary does not hold because frequency contents of the signal continuously changes over time. Nonstationaries of the surface myoelectric signal can be classified as slow or fast. Slow nonstationaries are mostly due to the accumulation of metabolites that causes the electrical manifestations of muscle fatigue. Fast nonstationaries are mainly related to the biomechanics of the task. Variations in muscle force cause a modification of the frequency content of the signal.
Cohen class transformation proposed by Cohen during 1995 (23) has received considerable attention, particularly in biomedical signal processing. The class time-frequency representation is particularly suitable to analyze surface myoelectric signals recorded during dynamic contractions, which can be modeled as realizations of nonstationary stochastic process. Previous works by Martin and Flandrin (24), Amin (25) and Syeed and Jones (26) demonstrated that any Cohen class time-frequency spectrum S(t,f) may be written as equation 5:
( )t f E
{
x(
t τ) (
x t τ)
}
g( )θτ e πθ( )e πτdθdt dτS / * / j2 t/ t j2f /
, 2 2
,
∫ ∫ ∫
∞∞ −
∞ ∞ −
∞ ∞ −
− − −
− +
= (5)
where E{} is expectation operator, x(t) is realization of the stochastic process under consideration, x*(t) is the
complex conjugation, g(θ,τ) is the kernel of the transformation.
Cohen in 1995 also inferred that when one chooses g(θ,
The WVD is a time-frequency that can display the frequency as a function of time, thus utilizing all available information contained in the EMG signal. Although the EMG signal can often be considered as quasi-stationary there is still important information that is transited and may only be distinguished by WVD. Ricamato et al. (27) in 1992 discovered that WVD could be used to display the frequency ranges of the motor unit. It is possible to show the recruitment patterns as the muscle performs difficult tasks. The Wigner-Ville distribution is given in equation 6:
( )
t
ω
x
t
τ
x
t
τ
e
ωτd
τ
W
x ∞ −j∞
−
−
∫
+
=
2
2
,
* (6)where x(t) and x’(t) are the signal and its complex conjugate respectively.
Implementing the WVD with digital computer requires a discrete form. This allows the use of fast Fourier transform (FFT), which produces a discrete-time, discrete-frequency representation. The common type of time frequency distribution is the Short-time Fourier Transform (STFT). According to Davies and Reisman (28) (1994), the major difficulty with the STFT distribution is that it does not satisfy four important properties that are desired for time-frequency distributions. The two properties are the time and frequency marginals and the other two are time and frequency support. They also inform that, the joint density spectrum produced by WVD is very noisy but displays very good localization properties and it is generally concentrated around the instantaneous frequency of the signal. The Choi-Williams method proposed in 1993 is an example of a reduced interference distribution (29). Davies and Reisman (28) discovered that, although the Choi-Williams distribution does not satisfy all the desired properties for a time frequency distribution but it does satisfy an important one, reducing interference. The STFT does not satisfy the marginal properties. This factor implies that when a time slice of the STFT distribution is taken, it does not equal the power density spectrum at that point in time. The same is true for a frequency slice of the distribution. The time support property is not satisfied because the distribution is not necessarily zero before the signal begins or after it ends. Time frequency techniques require a very clean signal. There are many other
time-frequency distributions. Davies and Reisman (28) chose the STFT and Wigner-Ville distributions because they have been used widely in the past. According to their research, The STFT appears to most clearly show the compression of the spectrum as the muscle fatigue. The WVD has cross-terms and therefore is not a precise representation of the changing of the frequency components with fatigue. When walls appear in the Choi-William distribution, there is a spike in the original signal. It will decide if the walls contain any significant information for the study of muscle fatigue.
Autoregressive model
The autoregressive (AR) time series model has been used to study EMG signal. A surface electrode will pick up EMG activity from all the active muscles in its vicinity, while the intramuscular EMG is highly sensitive, with only minimal crosstalk from adjacent muscles. Thus, to combine convenience and accuracy there is a great need to develop a technique for estimating intramuscular EMG and their spectral properties from surface measurement. Researchers have represented sEMG signal as an AR model with the delayed intramuscular EMG as the input.
signals to the surface signals are identified. The identified model is then used in estimating the intramuscular signal from the surface signal. This model is illustrated using real EMG waveforms. Hefftner et al. in 1988 (34) evaluated the previous models and selected an AR model for EMG signature discrimination because of its computational speed. Bernatos et al. in 1986 (35) employed a static nonlinear element with time-varying autoregressive moving average (ARMA) model and Moser and Graupe in 1989 (36) proposed a nonstationary identifier of time-varying AR parameters. In 1992, Tohru (37) considered that the more precise model such as ARMA or ARIMA was not necessary for dynamic muscle movements. The computation cost of ARIMA model is high, and the determination of the model order is complex and sometimes difficult. AR model was chosen by Tohru (37) mainly because of its computational cost which is a problem in the simulation. Their investigation was based on AR model parameters computed by quasi-stationary processing.
Artificial intelligence
Some Artificial Intelligence techniques mainly based on Neural Networks have been proposed for processing EMG signal. This kind of technique is very useful for real-time application like EMG signal recording and analysis.
A real-time application of artificial neural network that can accurately recognize the myoelectric signal (MES) is proposed by Del and Park (38) in 1994. According to their research, MES features are first extracted through Fourier analysis and clustered using fuzzy c-means algorithm. Fuzzy c-means (FCM) is a method of clustering which allows data to belong to two or more clusters. The neural network output represents a degree of desired muscle stimulation over a synergic, but enervated muscle. Real time operation is achieved by taking advantage of hardware multipliers present in Digital signal processing (DSP) processors to perform Fast Fourier Transform for feature extraction and neurode input integration for featured classification. Adaptive interfaces are a natural and important class application for artificial neural network (ANN). Error-back propagation method is used as a learning procedure for multilayred, feedforward neural network. By means of this procedure, the network can learn to map a set of
inputs to a set of outputs. The network topology chosen was the feedforward variety with one input layer containing 64 input neurodes, one hidden layer with two neurodes and one output neurode (38). The model using ANN is not only an advance on MES signal recognition in real-time but also, it curtails subjects training to a minimum. Neural network architectures provide a two-fold solution: a fast way of system customization to the patient and a better patient adoption to the system, improving the low rate of acceptance of the devices. The method proposed by Del and Park can solve problems (acceptable cost and performance criteria) that conventional statistical methods cannot.
Another ANN based approach is made in 1996 by Cheron et al. (39) with the objectives of developing an alternative approach based on artificial dynamic recurrent neural networks (DRNN) to identify the relationship between the muscle EMG activity and the arm kinematics. His objective was to prove that this DRNN identification is bio-mechanically plausible. The neural network consists of fully interconnected neuron-like units with two types of adaptive parameters: classical weights between the units and the time constants associated with each neuron. Specifically, this network identifies some of the complex relationships between the muscle activity EMG and the upper-limb kinematics during complex movements. According to the method proposed by Pearlmutter in 1989, the artificial neural network is a fully connected 20-neuron network. The method is used by Cheron et al. (39), which is governed by equation 7:
( )
i ii i
i
dy
dt
y
F
x
I
T
=
−
+
+
(7)where yi is the state activation level of unit I, F(α) is the
squashing function
F
(
α
)
=
(
1
+
e
−α)
−1and xi is givenby equation 8.
∑
=
j ji j
i
w
y
x
(8)suitability of the DRNN is mainly due to the adaptive time constants associated to each neuron-like unit.
Fuzzy logic systems are advantageous in biomedical signal processing and classification. Biomedical signals such as EMG signals are not always strictly repeatable and may sometimes even be contradictory. According to Chan et al. (40), one of the most useful properties of fuzzy logic systems is that contradictions in the data can be tolerated. Furthermore, using trainable fuzzy systems, it is possible to discover patterns in data which are not easily detected by other methods, as can also be done with neural network. Finally, the experience of medical experts can be incorporated. It is possible to integrate this incomplete but valuable knowledge into the fuzzy logic system, due to the system’s reasoning style, which is similar to that of a human being. This is a significant advantage over the artificial neural network (ANN). Fuzzy logic systems emulate human decision-making more closely then the ANN. The kernel of a fuzzy system is the fuzzy inference engine. The knowledge of an expert or well-classified examples are expressed as or transferred to a set of “fuzzy production rules” in the form of IF-THEN, leading to algorithms describing what action or selection should be taken based on the currently observed information (40).
The blind source separation (BSS) method proposed in 2001 by Belouchrani et al. (41) is a neural network based method that separates a linear mixture of stationary independent sources received by different sensors by the use of higher-order statistical moments in the learning algorithm. In 2004, Farina et al. (42) discovered that the EMG signals generated by different muscles may overlap in the time and frequency domain, thus classic linear filtering approaches cannot be applied for the purpose of source separation. She informed that previous studies aimed at applying BSS approaches to sEMG signals did not provide any validation of the performance and did not discuss the assumptions and the limitations of the BSS method to sEMG signal analysis. To overcome the problems, an approach based on spatial time-frequency distributions were applied to separate both simulated and experimental nonstationary sEMG signals (42). Table 2 shows the diagnosis performance of Time domain, Frequency domain and wavelet coefficients using Artificial Neural Networks.
Table 2: Diagnosis performance of time domain, frequency domain and wavelet coefficients using Artificial Neural Networks.
Feature Set Average %
Time domain 78.3
Frequency domain 62.5
Wavelet DAU4 66.2
Wavelet DAU20 59.6
Wavelet CH 63.3
Wavelet BL 65.8
Higher-order statistics
Higher-order statistics (HOS) is a technique for analyzing and interpreting the characteristics and nature of a random process. The subject of HOS is based on the theory of expectation (probability theory). Due to the limitations of:
i. The detection and characterization existing nonlinearities in the sEMG signal;
ii. Estimate the phase; and
iii. Exact information due to derivation from normality. HOS have been introduced in the 1960s and applied in the 1970s.
mechanism of the muscle. According to his theory, H(w)
and λ respectively donate a single MUAP waveform and its occurring frequency is given by equation 9 and 10.
( ) ( ) (
)
(
)
22 1
2 1 2 1
,
ω
ω
ω
ω
ω
ω
λ
B
P
P
P
+
=
(9)( )
( )
λ
ω
ω
P
H
=
(10)(
1,
2) ( ) ( ) (
1 2 1 2)
arg
B
ω
ω
=
ϕ
ω
+
ϕ
ω
−
ϕ
ω
+
ω
(11) According to equation 11,ϕ
( )
ω
=
arg
H
( ) ( )
ω
.
ϕ
ω
is estimated from the bispectrum using the phase estimation algorithm. MUAP waveforms can be found using equation (9) through (11). Their research shows that MUAP amplitude increases when load weight is increased.From 1987 to 1993, HOS based signal analysis techniques have been developed by researchers like Nikias, Mendal, Raghuveer, and Petropulu for deterministic and non-deterministic phase signals, testing of Gaussianity and linearity, coherence and coupling of the signal, and more. During the 1990s, Nikias et al. (2, 46, 47) had discovered that the main advantage of HOS over SOS is that HOS can suppress Gaussian noise in detection, parameter estimation, and classification. Nikias informs that HOS is blind to any kind of Gaussian process; a non-zero HOS measurement can provide a test of the extent of non-Gaussianity in a signal. Another feature of HOS is that the HOS spectrum of the sum of two or more statistically independent random processes equal the sum of their individual HOS spectra, therefore, HOS can extract information due to derivation from Gaussianity and it provides suitable measurement of the extent of statistical dependence in time series. Further, the bispectrum, first member of HOS spectra, carries magnitude and phase information that allows one to recover both the Fourier magnitude and phase value of the system impulse response with the expectation of a linear phase term. In 2000, Kaplanis et al. (48) have given their theory of sEMG signal analysis using HOS. According to their theory, to quantify the non-Gaussianity of a random process, the normalized bispectrum, or bicoherence is estimated according to equation 12:
(
)
( ) ( ) (
(
)
)
2 1 2 1
2 1 2
1
,
ω
ω
ω
ω
,
ω
ω
ω
ω
π
=
+
P
P
P
B
B
(12)where P(.) is the power spectrum.
The test of Gaussianity is based on the mean bicoherence power defined in equation 13 with the summation performed over the non-redundant region.
(
)
∑
=
nω
1,
ω
2g
B
S
(13)The bicoherence index was used for characterizing the Gaussianity of the signal. Results indicate that sEMG signal distribution is highly non-Gaussian at low and high levels of force whereas the distribution has maximum Gaussianity at mid level of maximum voluntary contraction level (MVC). A measure of linearity of the signal, based on deciding weather or not the estimated bicoherence is constant, follows the reverse pattern with the measure of Gaussianity. The power spectrum’s median frequency decreases with the increase of force.
In 2004, Shahjahan Shahid (1) applied HOS for EMG signal analysis and characterization due to its advantages of HOS over SOS. He has proposed the “Bispectrum of Linear System.” Modeling the bispectrum of a time series signal as the output of a linear system allows an application of useful techniques for identification and characterization of the system, which produces the system output signal. Let e(n) be a zero mean, stationary random signal applied to a LTI system according to Figure 4, whose frequency response is H(k) (where the time domain system response h(n), is causal and stable). Assume that w(n) is an independent identically distributed random Gaussian white noise that represents the system noise and x(n) is the system output. According to the convolution theorem for a LTI system output x(n) can be written as equation 14.
∑
−
+
=
∞=0
(
)
(
)
(
)
)
(
k
h
k
e
n
k
w
n
n
Fig. 4: A model of the LTI system.
By using the bicepstrum, a system can be reconstructed from its output signal upon reconstructing the phase components of a system. Since an LTI system output signal carries all the information about a system plus noise, upon considering the system output signals as non-Gaussain noise, it is possible to estimate the system impulse response by using the system reconstruction algorithm. Algorithms can be developed for system’s input impulse characterization so that the actual EMG signal from the muscle can be acquired. According to Shahjahan Shahid, traditional system reconstruction algorithms have various limitations and considerable computational complexity and many show high variance. The most common bispectrum based system reconstruction algorithm has been improved by separating out the skewness parameter. Also, the
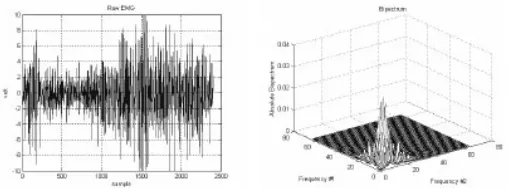
Cepstrum of Bispectrum - a new branch of cepstrum - has been developed and applied by Shahjahan Shahid to perform system impulse function reconstruction in a computationally simple manner. The algorithm developed shows better performance than traditional algorithms. The cepstrum of bispectrum is also used to develop an algorithm for reconstruction of system input impulse sequence from a LTI system output signal. The results showed that resting muscle’s EMG contains a train of impulse-like MUAPs whose peaks are oriented to both sides of zero level. This means that there is no involvement of motor unit in the resting muscle. On the other hand MUAPs tend to be oriented to one side of the zero level when the muscle is contracting. Figure 5 shows a sample raw EMG signal and its bispectrum curve.
Fig. 5: Sample EMG signal and its bispectrum curve.
Other methods
There are some other models proposed by various researchers for the purpose of EMG signal processing. Some of these models are briefly explained here.
In 1969, Rosenfalck (49) mathematically formulated
90
96
)
(
z
=
x
3e
−z−
g
based on the experimental works of Ludin on the intercostals muscle. Nandedkar and Stalberg (50) modified the expression in 1983 from g(z) toe(z) = g(2z) in order to match better experimental data, leading to
e
(
z
)
=
768
z
3e
−2z−
90
. This is taken as the default intracellular formulation for the single fiber action potential modeling.Nanderdar and Barkhaus (51) has a model proposed in 1992 based on a simple principle of vector summation. According to Slawnych, Laszlo, and Hershler theory (1990), Nandedkar model assumes that the MUAP amplitude adds algebraically to generate the compound action muscle protential (CAMP) amplitude. Since MUAP waveforms do not occur synchronously, this assumption is not valid. If two MUAPs of amplitude A1
and A2 are summated, then the amplitude of the resulted
waveform is not equal to A1+A2. In other words, a MUAP
contributes less than its amplitude to CMAP amplitude, this phenomena is called phase cancellation. According to (51) the amplitude of their sum denoted as A12 lower
then A1+A2. It is expressed in equation 15.
α
.
2
1 22 2 2 1 2
12
A
A
A
A
A
=
+
−
(15)In 1994, Englehart and Parker (52) considered two types of interpulse interval (IPI) probability density function (pdf) models. The discharge sequence as a series of IPI, estimation of the IPI mean, variance, and probability density function (pdf) have been used as descriptors of motor neuron activity. The Gaussian density function is expressed by equation 16:
( )
(
)
−
=
22
2
exp
2
1
x x
x x
x
x
f
σ
µ
π
σ
(16)The Gamma density function is expressed by equation 17:
( )
( )
α
β
α
β
α
ρ
β
ρ〈
−
−
−
Γ
=
−x
x
x
x
f
x1
exp
;
1
(17)
where α is the location parameter, β is the scale parameter, ρ is the shape parameter and Γ( ) is the gamma function.
According to the model, the estimates of the moments and the pdf of the neural discharge sequence are susceptible to bias if the data are nonstationary. Some factors that may affect the degree of stationary of experimentally IPI data are duration of contraction, the means of force production, and the level of contraction. An analytical expression for the myoelectric signal was derived using the integralpulse frequency and amplitude modulation (IPFAM) model by Zhang et al. (53) in 1995. The model has three main elements: The pulse amplitude modulation (PAM), the pulse frequency modulation (PFM) and the linear system. The PAM describes the association of the EMG amplitude with variations in muscular force, the PFM describes the variations in the EMG signal caused by changes in the nerve firing rates and the linear system, p(t), represents the compound motor unit action potential including effects of propagation dispersion and tissue filtering. In this model, the potential rises until a pre-determined threshold is reached, which causes an action potential or event to occur. Thus, the IPFAM model includes the most important features associated with the generation of real EMG signals.
A real-time system for EMG signal analysis was done by Karlsson and Nystrom in 1995 (54). The aim was to develop a system for clinical use with the characteristics of graphics feedback, flexible parameter selection, standard method and flexible addition processing. To produce a time-frequency representation of a signal, the short-time Fourier transform was proposed to be used. A major drawback of this method was that stationary signal was assumed. Even when there is no voluntary change of muscle state, myoelectric signals are non stationary simply due to the inherent physiology of the organs.
A model of EMG is proposed by Duchene and Hogrel (55) in 2000. According to Duchene and Hogrel any new processing algorithm needs to be optimized by comparing its result to the original parameter values to get an optimized criterion. This optimization can only be done if all actual values are known. Only a comprehensive simulation model can help fulfill this requirement. The extracellular action potential is calculated after the intracellular action potential for modeling the single fiber action potential. According to the initial work of de Lorente (56), the potential at an observation point [z0, y0] can be expressed by equation
18:
(
)
( )
( )
( )
∫ ∫ ∫ − ∫ ∂∂ ∂ ∂ + ∂ ∂ = +∞ ∞ −1 2 2
2 1 1
1 ,
S S S
o o
E rdz ezz rdS
z z e dS dS r z z e K y z V (18)
where z and y are the axial and radial directions, respectively, S1 and S2 are the fiber sections at the fiber ends and r is the distance between the surface elements
dS and the observation point.
Hamilton and Stashuk (57) proposed the latest simulation of clinical EMG signals so far in 2005. According to the proposal, the first requirement for EMG signal simulation is the creation of a model of the structure of a muscle. This is performed in the following stages:
1. Muscle and motor unit territory diameter calculation;
2. MY territory center location; 3. Fiber layout and assignment; 4. Updating MU territory centers;
5. Calculating actual MU territory centers; 6. Assignment of fiber diameters; and
7. Assignment of neuromuscular junction locations. This model is unique because it incorporates the followings:
1. The spatial relationship between muscle fibers, the MUs they constitute, and the macro level muscle morphology;
3. Variability of detected MUAPs due to NMJ transmission delay variability;
4. A new mechanism for MU recruitment based entirely on muscle morphology; and
5. Clinically realistic needle placement.
EMG signal classification
The common feature for classifying intramuscular EMG signal is the Euclidean distance between the MUAP waveforms. For clinical interests, the main feature of the EMG signal is the number of active motor unit (MUs), the MUAP waveforms, and the innervations time statistics. According to Wellig and Moschytz (58), the determination of the MUAP waveform and the number of active MUs can be considered as a classification problem.
The representation of time-triggered and non-overlapping MUAPs produces a shimmer. MUAP shimmer is influenced by the time-offset of the sampled waveforms, local fluctuation of the baseline and background noise. MUAP shimmer can also be influenced by all noises that are different from both background noise and noise caused by offsets. Besides background noise and the effects of the offset, white noise influences the classification. If the classification is to be performed in the wavelet domain, wavelet coefficients which refer to frequency bands lying below 150 Hz should be avoided. The classification with wavelet coefficient needs the wavelet coefficient (Ff[m,n])
of four frequency bands (m=2, 3, 4, 5). The classification performance not only depends on the MUAP shimmer on the variance within a class but also on the distance between the class means. Therefore, the best selection of these four frequency bands depends on the Fourier transform of the MUAP waveforms themselves. Boualem and Peter (59) theorized that the time frequency representation of WVD provided high-resolution signal characterization in time-frequency space and good noise rejection performance. This theory can be very useful for EMG signal classification purposes. For the purpose of classifying EMG patterns, AR parametric model is used. In 1991, Zhang et al. (60) extracted and compared two types of features based on signal processing for the purpose of classifying EMG patterns. The two features were the coefficients of AR parametric models and the components of Fourier frequency spectra. The method
showed better results while describing the EMG linear envelopes (LE).
In 1995, Christodoulou and Pattichis (61) proposed that the classification procedure using ANN is implemented in three phases:
i. In the first phase unsupervised learning is applied based on one dimensional self-organizing feature map and competitive learning.
ii. In the second phase, in order to improve classification performance, a self-supervised learning technique, the learning vector quantization is applied.
iii. In the third phase, the actual classification takes place.
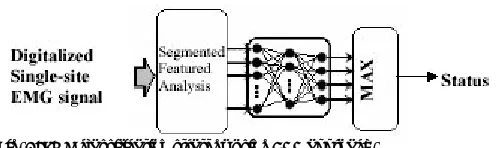
Classification of real EMG data into their constituent Motor unit action Potential is often a difficult task because of MUAPs waveform variability, jitter to single fiber potentials and MUPAs superposition. According to Christodoulou and Pattichis ANN appears attractive for the solution of such problem because of their ability to adopt and to create complex classification boundaries. Figure 6 shows EMG classification strategy using ANN approach.
Fig. 6: EMG classification strategy using ANN approach.
Table 3: Typical EMG classification accuracy rate.
Method Accuracy rate
Coefficients of AR 99%
Neural Networks 84%
Fuzzy System 85%
Motor unit number estimation (MUNE)
Accurate estimation of MUAP templates in the presence of background EMG activity and instrumentation noise is an important requirement of quantitative clinical EMG analysis, especially if EMG signal decomposition is utilized. MUNE is a procedure used to evaluate the number of motor axons connected to a muscle. All MUNE techniques rely on assumptions that must be fulfilled to produce a valid estimate.
In 1971, McComas proposed a simple neurophysiological technique for estimating the number of motor units in a muscle (62). A maximal bioelectric response of the muscle was recorded using sEMG following a supramaximal electrical stimulation of the muscle’s nerve. The maximal EMG response was then divided by an estimate of the average single motor unit response. The result was an estimate of the number of single motor unit responses that made up the maximal EMG response. According to Stashuk et al. (63), the number of motor units in a muscle can be estimated by dividing size-related parameter values measured from a maximal M-Wave by corresponding parameter values measured from an average surface-detected motor unit action potential (S-MUAP). The accuracy of the estimate is dependent on how representative the average S-MUAP is of the population of S-MUAPs which contributed to the maximal M-Wave. F-Wave responses have been shown to represent the full range of S-MUAP sizes. An automated system was been developed to obtain a maximal M-Wave, to extract a sample of F-Wave responses, to compute an average S-MUAP and to estimate the number of MUs in a muscle.
In 1998, Zhengquan Xu and Shaojun Xiao (64) presented a method for estimating the mean and standard deviation of inter-pulse intervals (IPIs) of individual MUAP trains. Through a weighted matching between the observed IPI probability density function and the modeled function, the firing parameters are estimated.
The weighted function is used to approximate the validity of IPI data so that all valid information provided by IPI data are utilized as far as possible. For this reason, the method can provide reliable estimations even if the MUAP trains are extracted with significant errors. Thus, this method is very useful for estimating the firing statistics of surface EMG where the individual MUAP trains are difficult to be accurately identified.
Given that the MUAP originates at some distance below a standard sEMG electrode, the basic shapes of surface MUAPs can ideally be represented by only a very small number of waveforms or wavelet functions. Based on this determination, Ping and Rymer (65) in 2003 evaluated ways to estimate the number of MUAPs present in standard surface EMG records, using wavelet based matching techniques to identify MUAP occurrences. The reason for this approach is that estimates of the numbers of MUAPs are likely to be a more accurate reflection of the neural command to the muscle. The wavelet matching methods, using an even more selective surface electrode, can correctly estimate the number of MUAPs in the surface EMG signals at higher force levels. However, the maximum MUAP number correctly estimated in the surface EMG cannot be significantly increased.
functional motor units in a muscle (or group of muscles) is given by equation 19.
)
(
)
(max
SMUP
mean
CMAP
N
=
(19)Hardware models
Due to the advanced development of the biomedical science, the application of biomedical instruments becomes essential in daily life. Design of application specific integrated circuit for the biomedical instrument has become quite important recently. Various hardware has been implemented to develop prosthetic hands for disabled people. Hardware chips have also been designed to filter EMG signal to achieve the accurate signal for the prosthetic arm control and other applications like grasp recognition and human computer interactions.
The microprocessor system for myoelectric signal identification proposed by Graupe et al. (67) is based on an 8080 Intel Corporation microprocessor which is an 8-bit parallel central processing unit. It is fabricated on a single Large Scale Integration (LSI) chip using N-channel silicon gates and is furnished in a 40-pin dual in-line ceramic package, having a 2 µs instruction time. The microprocessor is then interfaced with its input-output ports and with a 4K-bytes semiconductor memory. Furthermore, to increase speed, the microprocessor is interfaced with a hardware multiplier unit based on Fairchild 9344 4x2 bit multiplier modules where multiplication time is 350 ns versus 1 µs in the microprocessor itself.
Analog processor chip can be designed to handle the physiological signals. Since EMG signal has the characteristics of very low voltage amplitude and carries some low-frequency common-mode noise, Yen et al. (68) integrated the instrumentation amplifier, gain control stage, and filters into the chip for processing the EMG signal into the adequate amplitude and limited bandwidth. It is divided into three parts: analog signal processing unit, wireless data transmission unit, and digital processing unit. Their research focused on the transmission system design. By the design concept of the system on a chip, the chip has achieved goals of low cost, low power consumption and minimizing layout area.
To enhance the lives of people who has lost a hand, prosthetic hands have existed for a long time. Evolvable hardware (EHW) chip has been implemented for myoelectric prosthetic hand application. The EHW chip for an autonomous mobile robot and a myoelectric artificial hand was also developed in April 1998 to serve as an off-the-shelf device for gate-level hardware evaluation. The chip consists of three components: 1) a PLA; 2) the GA hardware with a 2K word chromosome memory and a 2K word training pattern memory; and 3) a 16-bit 33 MHz CPU core (NEC V30; 8086 compatible). Arbitrary logic circuits can be reconfigured dynamically on the PLA component according to the chromosomes obtained by the GA hardware. The CPU core interfaces with the chip’s environment and supports fitness calculations when necessary. The size of the GA hardware, excluding memories, is about 16K gates. In terms of gate size, this is almost one-tenth of a 32-bit CPU core (e.g., NEC V830). However, genetic operations carried out by this chip are 62 times faster than on a Sun Ultra2 (200 MHz). The chip implemented by Kajitani et al. in 1999 (69) consists of GA (genetic algorithm) hardware, reconfigurable hardware logic, a chromosome memory, a training data memory, and a 16-bit CPU core (NEC V30). Myoelectric prosthetic hands are operated by signals generated in muscular movement. The proposed EHW chip consists of seven functional blocks, GA unit, PLA Unit (2 array), CPU, Register File, Random Number Generator, Chromosome Memory and Training Data Memory. The workflow of the EHW chip can be divided in two phases. The first phase is to make the two children and evaluate phase and the second is the “select two chromosome” phase. The GA adaptively implements the circuit on the PLA in the EHW controller.
algorithms (GA) as the string increases. The main advantage of the method is that evolution is not performed in one operation on the complete evolvable hardware unit; instead it is performed in a bottom-up way. The digital gate based architecture of the prosthetic hand controller is illustrated in Figure 7. It consists of one subsystem for each of the six prosthetic motions. In each subsystem, the binary inputs x0. . . x15 are processed
by a number of deferent units, starting by the AND-OR unit. This is a layer of AND gates followed by a layer of OR gates. Each gate has the same number of inputs, and the number can be selected to be two, three or four. The outputs of the OR gates are routed to the Selector. This unit selects which of these outputs those are to be counted by the succeeding counter. That is, for each new input, the Counter is counting the number of selected outputs being “1” from the corresponding AND-OR unit. Finally, the Max Detector outputs which counter corresponding to onespecific motion having the largest value. Each output from the Max Detector is connected to the corresponding motor in the prosthesis. If the Counter having the largest value corresponds to the correct hand motion, the input has been correctly classified.
Fig. 7: The digital gate based architecture of the prosthetic hand controller.
Two types of artifacts usually exist in the EMG signal from an electrically-stimulated muscle: stimulation artifacts and M-wave. In 2000, Peasgood and his researchers (71) assumed that the M-wave is stationary and therefore used a fixed comb filter. But the M-wave is clearly a non-stationary signal in a statistical sense, mainly due to the fact that its temporal variation depends on many factors, such as stimulation intensity, fatigue, the contraction level of the muscle, etc. An adaptive prediction error filter (PEF) based on the Gram-Schmidt (GS) algorithm is presented in 2004 by Yeom et al. (72) for the suppression of the M-waves. The
presented filter is implemented on a field programmable gate array (FPGA). Implementation is done using a 6th
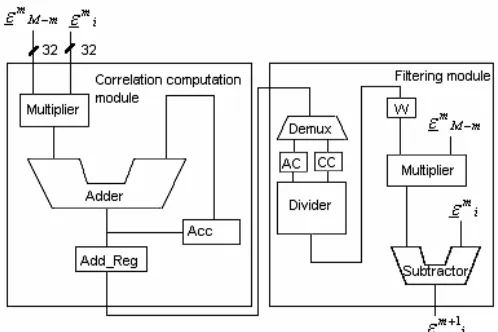
order GS PEF using Xilinx XC2S200pq208-6 FPGA chip. The design was synthesized using Xilinx ISE 5.2i and verified using ModelSim XE 5.6a. One major advantage of separating the correlation computation and filtering process in hardware is that the filter system is not involved with a complicated state machine. Figure 8 shows the schematic of the core processing unit implemented on FPGA. M-waves must be removed in order to use voluntary EMG from electrically stimulated muscle. The proposed M-wave cancellation system based on the GS PEF is not only efficient to eliminate periodic signals like M-waves, but also suitable to FPGA implementations than the conventional linear PEF (72).
Fig. 8: Schematics of the core processing unil implemented on FPGA.
Applications of EMG
EMG signals can be used for variety of applications like clinical/biomedical applications, EHW chip development, human machine interaction, etc. Clinical applications of EMG as a diagnostics tool can include neuromuscular diseases, low back pain assessment, kinesiology and disorders of motor control. EMG signals can be used to develop EHW chip for prosthetic hand control. Grasp recognition (73) is an advanced application of the prosthetic hand control.