EMPIRICAL INVESTIGATION OF VISUALIZATION
QUALITY FOR THREE-DIMENSIONAL (3D) OBJECTS OF
3D MAP ON MOBILE DEVICE FOR NAVIGATION AID
1ADAMU ABUBAKAR, 2
SARDJOENI MOEDJIONO, 3TEDDY MANTORO, 4AKRAM ZEKI,
5
HARUNA CHIROMA
1,4
Department of Information Systems, Kulliyyah of Information and Communication Technology, Interna-tional Islamic University; Malaysia
2
Faculty of Information Technology, Budi Luhur University, Jakarta, Selatan, Indonesia
3
Faculty of Science and Technology, Universitas Siswa Bangsa International, Jakarta, Indonesia
5
Department of Artificial Intelligence, Faculty of Computer Science and Information Technology, Univer-sity Malaya, Malaysia
1[email protected], 2[email protected]
3[email protected]4[email protected], 4[email protected]
ABSTRACT
Previous studies have shown some key factors that influence the success of visualization quality for 3D objects of 3D map on Personal computers (PCs) and Laptops’, crucial to that is the 3D computational pro-cessing capabilities of PCs and Laptops. Unfortunately 3D applications on mobile devices are hindered by the lack of efficient mobile rendering interfaces, low computational resources and direct 3D rendering at interactive rates. Although recently there are several attempts of building complicated 3D map visualization tasks on mobile devices, yet there is still problem of visualization quality of 3D objects of 3D map on a mobile device, this could be attributed to salient features which this paper try to uncover. An experiment that is aimed at investigating how people visualized 3D objects and orient themselves with the 3D map view on a mobile device for navigation assistance was carried out. The result indicates that the size and shape of 3D objects of 3D map significantly aided orientation, but there are no significant differences be-tween the size and color. The 3D map view can increase the user’s sense of presence; however, 3D map projections tend to represent familiar scenes by collections of their 2D views. This paper shows visual vari-ations of complex 3D map scenes on small-screen mobile devices, with a single object-centered 3D map projection.
Keywords: 3D objects, 3D map projection, Mobile device, Object-centered, Visualization
1. INTRODUCTION
People visiting unfamiliar places and searching for particular locations require guides. In ubiquitous computing environment small computing devices such PDAs, smart phones that communicate wire-lessly offers opportunity to be utilized for such guides. Ubiquitous here means that computers or computing are context that are spread everywhere at the same time [1]. Context here refers to any in-formation that can be used to characterize the situa-tion of an entity; and an entity is defined as the per-son, place, or object that is considered relevant to the interaction between a user and an application, including the user and applications themselves [2]. The quality of Visualizing of 3D objects (Spheres Cylinders, Prisms) depend on it’s the presentation.
How people visualized 3D objects and orient themselves with the 3D map view on a mobile de-vice for navigation assistance can only be determine by field experiment in order to understand the influ-ence of 3D map view on mobile devices for naviga-tion assistance. The representanaviga-tional differences of 3D map view are considered. This study undertakes an experiment, similar to the study performed by [6] in order to understand the influence of 3D map view on mobile devices for navigation aid. The rep-resentational differences of 3D map view are con-sidered different model devices with 3D map of various sizes and shapes of 3D objects are used. Some sample of respondents participated in the experiment voluntarily. Data The experiment signif-icantly were collected and analyzed with the aim at exerting visualization quality for 3D objects of 3D map on mobile device for navigation aid.
The remaining part of this paper compresses of four sections apart from this section. Section 2 is the present the visualization of 3D map. Section 3 present the experiments and section 4 provides the result, finally section 5 present the conclusion.
2. VISUALIZATION OF 3D MAP
3D Described an object which has three dimension of measurement: Width, height, and depth repre-sented as coordinates in a Cartesian coordinate sys-tem denoted as X, Y and Z [6] respectively. Visual-ization is a process of forming mental model of data, thereby gaining inside into that data [7]. This means that visualization meant constructing a visual image in the mind [8]. Stuart et al. [9] propose six major ways in which visualizations can amplify cognition with regards to physiological point of view. However, 3D visualization is important in many field, the common advantages gain in all are-as is clear and precise information displays that depends on the capabilities of the perceiver. 3D visualization attributes on mobile device in similar to were proposed by Mosmondor et al. [10]. It is a fact that human visual systems are built to perceive the shapes of 3D surfaces and that human perceive in order to operate on the environment. Thus
exper-alization. Visibility culling technique reduces 3D object complexity by hiding large parts of a given object [16]. However, this will provide fast interac-tive frame rates and free browsing in the entire 3D space, thus If an object is beyond a plane of the view frustum, it won't be visible. Contrary to this technique is the level-of-details of 3D object that may be required in some certain cases[16]. This means the visibility culling will not be suitable, for example in medical studies. Although it’s a fact that geometry described properties of a shape that re-main unchanged even if it’s subjected to transfor-mation [15]. Visualization of 3D objects in mobile devices exhibit the three common 3D primitive transformations that can be performed on vertices [12]. This includes translation, scaling, and rotation. Translation of 3D object shows a moving or dis-placement of a certain distance. Whereas Rotation indicated the rotating vertices about an axis going through the origin and Scaling shows enlarging or shrinking of the size of vector components along axis directions [15].
pro-2.2 Participants
A total of 21 participants participated in field periments. All of the participants had previous ex-perience using in-car GPS navigation systems. Nineteen of the participants were male, and two were female. In this group, 65% belonged to the age group of 25 to 40 years, and 35% were in the age group of 19 to 24 years. In terms of smart phone usage and awareness of the presence of 3D maps on mobile devices for navigation assistances, their experience was average
2.3 Experimental Task and procedure
To avoid experimental biases and to ensure that our results do not trivially reflect the learning of 3D map functionalities, which would occur if the 3D map were not known to the participants, we select-ed participants who had an awareness of 3D maps on a mobile device but who had average experience in 3D model manipulations and 2D map legend translations, and we presented pre-field awareness instructions to them.
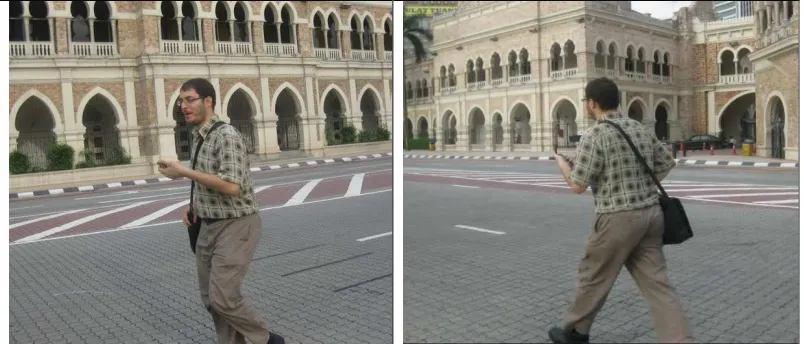
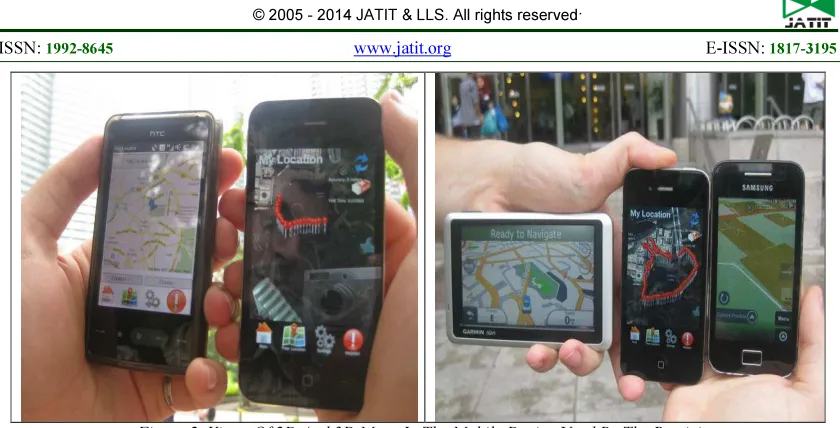
[image:3.595.102.504.396.568.2]The two field experiments begin after pre-field preparation in the laboratory, where the participants are given different mobile devices that contain both 3D and 2D maps. The first session of the experi-mental task involves presenting a mobile device that contains a 3D map to the participants; the par-ticipants then view and make a visual assessment based on what they see in the mobile device when the 2D map is given to them as well. This approach allows the participants to develop an understanding and become familiar with the experimental tasks. Then, at the end of the experiment, a structural in-terview is conducted to capture an in-depth under-standing of the key visual features of 3D maps in the mobile device for navigation assistance. The second session is similar to the first, but the partici-pants are asked to walk around an area to compare the 3D map presentation on their mobile device with what they see in reality. They are asked to pause at the point at which they see changes to al-low the changes to be tracked (see Figure 1). Some of the 2D and 3D map views of the mobile device used by the participants are presented in Figure 2.
Figure 2. Views Of 2D And 3D Maps In The Mobile Device Used By The Participants
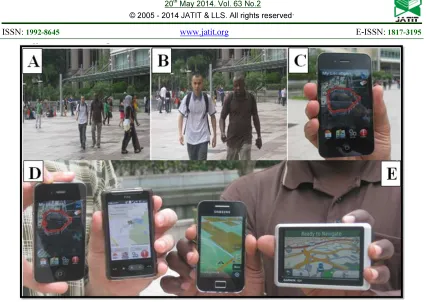
Figures 3A and 3B are part of the second ex-perimental session, which shows two participants walking; none of the participants appear to be en-gaging with the mobile devices, although one of them (from the right-hand side) is holding two mo-bile devices in both the left and right hand. The participants are walking to go around the Kuala Lumpur Conventional Center (KLCC) Park, which is located within the vicinity of Suria (KLCC) in Kuala Lumpur, Malaysia. KLCC is surrounded by many buildings, and it is a relatively densely popu-lated area, where 3D map view on a mobile device would be very important in guiding people to locate unfamiliar places. The major task here is to be able to identify the physical features in reality when compared with the 3D map view on the mobile de-vices. In Figure 3C, there is a display in a 3D map view from a mobile phone displaying the tracked path followed by two participants and having red
Figure 3. Mobile Device Interfaces Used In The First Session Of The Experiment.
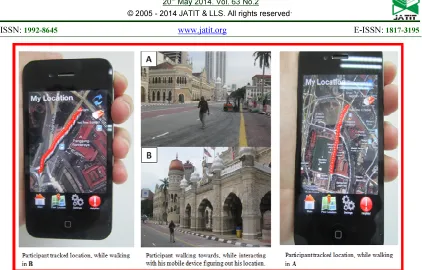
The appearance of the Google 3D map in Figure 3 is the same as Figure 2, but both of the maps are different from those on the left-hand side of Figure 3, which is designed in the Visualization of User Navigation (VisUN) project by Abubakar et al. [12]. To generate concrete facts from the respond-ents, an informative and useful representation that is different from 3D map view was shown to the participants. The average time spent by the partici-pants for viewing is 20 minutes, whereas the inter-view lasted for up to one hour per participant. The second part of the second session of the experiment was undertaken in the city center of Kuala Lumpur in the vicinity of Merdeka Square (Dataran Merdeka), as shown in Figure 8. The experiment also aimed at identifying the physical structure that had the 3D map view on the mobile devices for comparison. The path followed by the participant in Figure 4 is also indicated in the mobile devices
such that the participant could more easily compare what he sees in the mobile device and what is pre-sent in reality. This approach is also aimed at un-derstanding the visual variables for 3D maps on mobile devices as a navigation aid.
3. FIELD EXPERIMENT ANALYSES.
Figure 4. Mobile Device Interface Used In The Second Session Of The Experiment.
For each action and reaction of the partici-pants during the experiment, visual variables were examined by asking the participants questions based on the structured interview questions. Ques-tions were posed when the participants stopped. Then, after the end of the session, questions were asked again, to compare the participant’s initial
[image:6.595.88.511.474.635.2]Figure 6. Participant 8 To 14 Response Time In Which The Participants Could Detect And Compare The 3D Map View With Physical Features Around Them, Such As Buildings
Figure 7. Participant 15 To 21 Response Time In Which The Participants Could Detect And Compare The 3D Map View With Physical Features Around Them, Such As Buildings
4. RESULT
Efficiency metric time is employed to identify how long the participants take to first detect specific features in the 3D map during the experiment. Fig-ures 5-7 depict the average length (in seconds) until
the participants detect the relevant part of the 3D map. Again, people are slowest to detect the orien-tation changes compared to the color and size.
Table 2. Descriptive Statistics Of The Visual Variables
Orientation Size Color Position Shape Texture
N Valid 21 21 21 21 21 21
Missing 0 0 0 0 0 0
Mean 48.0000 3.0000 2.2857 16.6667 1.9524 17.7619
Std. Error of Mean 2.10555 .25820 .18443 .67377 .17561 .99260
[image:7.595.97.496.642.722.2]Repeated-measures analysis of variance (ANOVA) reports a significant main effect for the six tested visual variables, F(6.623) = .004, p <.05. The size and shape are significantly faster to com-prehend compared to the orientation, but there are no significant differences between the size and col-or. Orientation is significantly slower than the other test variables. The first observation that was made was the distance between the observer and the 3D map on the mobile devices. We discovered that the visual display becomes smaller as the mobile
[image:8.595.105.490.260.488.2]de-vice becomes further away from the eye; however, this relationship is not always true (see Figure 8). The 3D map view can increase the user’s sense of presence; however, 3D map projections tend to represent familiar scenes by collections of their 2D views. The visual variation of complex 3D map scenes on small-screen mobile devices, with a sin-gle object-centered 3D map projection (a smaller number of scenes), tends to change.
Figure 8. Visual interactions with the 3D maps on mobile devices
Because of the small screen size of the mobile devices, the 3D objects of 3D map are presented when they become too large; in reality, these fea-tures and landmarks appear to be too small in the device. Thus, there are some limitations on the ceptions of those landmarks from the user’s per-spective. Human visual perceptions of landmarks typically rely more on egocentric orientations, and spatial cognition ability declines with age [14].
REFRENCES:
[1] Mantoro, T., Johnson, C. W., & Ayu, M. A. A Framework in Ubiquitous Computing Environ-ment for Providing Intelligent Responses. Third International Conference on Mobile Ubiquitous Computing, Systems, Services and Technolo-gies. 289-294, (2005).
[2] Dey, A. K., Abowd, G., D. & Salber, D. A Conceptual Framework and a Toolkit for Sup-porting the Rapid Prototyping of Context-Aware Applications. Journal of Human Com-puter Interaction 16(2), 97-166, (2001). [3] Bertin, J. Sémiologie graphique. Troisième
édi-tion, Edition Gauthier-Villars, Paris, 431. (1998).
[4] Wolfe J.M. Horowitz T.S. What Attributes Guide the Deployment of Visual Attention and how do they do it? Nature Reviews Neurosci-ence 5(6), 1-7. (2004).
[5] Itti l. Koch C. Niebur E. 1998. A model of Sali-ence-Based Visual Attention for Rapid Scene Analysis. IEEE Transactions on Pattern Analy-sis and Machine Intelligence 20(11), 1254-1259.
[6] Dunser A, Billinghurst M, Wena J, Lehtinen V, Nurminen A. 2012. Exploring the use of handheld AR for outdoor navigation. Comput-ers & Graphics 36(2012) 1084–1095.
[7] Spence, R. Information Visualization. (Second edition). Pearson Education Limited. Essex: England, (2007).
[8] Ware, C. Information Visualization: Perception for Design. (Second edition) Morgan Kauf-mann. San Diego, CA. 268, (2004).
[9] Stuart, T., kard, Mackinlay, D., Jock, Schnei-derman, B. Readings in information visualiza-tion: Using vision to think. 1999 MORGAN Kaufmann publisher Inc, (San Francisco Cali-fornia, 1999).
[10] Mosmondor, M., Komericki, H., & Pandzic, I. S. 3D Visualization on mobile device. Paper presented at International Conference on Tele-communication System, 32(2-3), 181–191, (2006).
[11] Mantoro T., Ayu, M.A., Mahmud M., Akhta-ruzzaman M., (2012) "Hajj Pilgrims Tracking and Monitoring System", In Ayu. M.A. (Ed.) The Web: Its Utilisation, Evaluation and Securi-ty. IIUM Press. ISBN.: 978-967-418-112-3.
[12] Adamu A. I., Mantoro, T., & Shafi’I, M. A. (2012). Dynamic Interactive 3D Mobile Navi-gation Aid. International Journal of Theoretical and Applied Information Technology. 37 (2), 159–170.
[13] Miles, M. B., & Huberman, A. M. Qualitative data analysis: An expanded sourcebook (2nd Edition.). California: Sage. 352.(1994).
[14] Scott D. Moffat, et al. 2001. Age Differences in spatial memory in a virtual environment naviga-tion task”, Neurobiology of Aging 22 (2001); pp. 787-796.
[15] Blinn, J.F. Jim Blinn’s Corner: W Pleasure, W Fun. Journal of IEEE Computer Graphics and Applications Computer. 18(3), 78-82.(1998). [16] Cohen-Or, D., Chrysanthou, Y. L., Silva, C. T.,