ISSN: 1992-8645 www.jatit.org E-ISSN: 1817-3195
LOCAL BINARY PATTERNS AND MODIFIED RED
CHANNEL FOR OPTIC DISC SEGMENTATION
1
NUR AYUNI MOHAMED, 2MOHD ASYRAF ZULKIFLEY, 3AINI HUSSAIN, 4AOUACHE MUSTAPHA
Department of Electrical, Electronic and Systems Engineering, Faculty of Engineering and Built
Environment, Universiti Kebangsaan Malaysia, 43600 Bangi, MALAYSIA
E-mail: [email protected], [email protected], [email protected], 4
ABSTRACT
Glaucoma is one of the ocular eye diseases that can cause gradual vision loss and permanent blindness if it is not treated in the early stage. Current screening test such as intraocular pressure (IOP) assessment is not efficient since eye pressure is not the only symptom of glaucoma. The most suitable assessment of the glaucoma is by analyzing the health of the optic nerve head. In order to quantify the severity level of glaucoma, an automated detection system is developed by examining the optic disc and optic cup size. This paper explores two methods for optic disc segmentation, a part of modules in automated detection system, which are local binary patterns (LBP) and modified red channel (MRC). Both methods utilized only the red channel of RGB format fundus image as it alone is enough to achieve good performance in term of image contrast as compared to the other channels. For each method, preprocessing is first performed to enhance the quality of the input fundus image and post-processing is performed to smooth out the segmented boundary of the optic disc. RIM-One database is used to validate the simulation results for both tested methods. The results show that MRC performance is more stable in wider conditions compared to LBP. In conclusion, both methods segment the optic disc boundary with high accuracy, which can be used to calculate cup-to-disc ratio to determine severity of glaucoma.
Keywords: Local Binary Pattern, Textural Classification, Glaucoma, Fundus Image and Disc Segmentation
1. INTRODUCTION
Glaucoma is one of the ocular eye disorders in which the optic nerve head is progressively damaged over time. According to World Health Organization [1], it is the second leading cause of blindness where is predicted that there will be 80 million cases by 2020 [2]. Glaucoma can lead to vision loss and permanent blindness if proper clinical treatment is not ministered early. Usually, many glaucoma patients do not realize that they have the disease until it reaches an advanced stage because of the lack of symptoms. As such, it is important that early diagnosis and treatment are carried out to prevent total vision loss amongst people with glaucoma.
In glaucoma patient, vision impairment occurs as the optic disc becomes damaged and the condition is irreversible. An optic nerve or optic disc, which is the exit point, connects the ganglion cell axons from the eye to form photoreceptors whose function
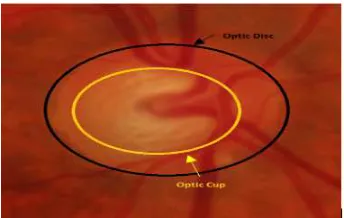
[image:1.612.337.509.541.650.2]is to transmit signals from the retina to the brain for interpretation process. Fig. 1 shows the main components of the fundus image used in glaucoma screening that consists of an optic disc and an optic cup.
Figure 1: Main components in a fundus image
damaged optic nerve which is usually conducted by a trained professional. Test for glaucoma based on visual field assessment such as perimetry and gonioscopy require special equipment. Meanwhile, the modality used to diagnose glaucoma based on IOP assessment is the tonometry test. However, the test has poor sensitivity and specificity performances because glaucoma can still be present with or without abnormal IOP. Lastly, assessment of damaged optic nerve such as pachymetry and nerve fiber analysis are done to measure the thickness of cornea and nerve fiber layer.
This paper explores two methods for optic disc segmentation which are local binary patterns and modified red channel. The rest of the paper is organized as follows: in Section 2, a brief explanation of the optic disc segmentation methods, where local binary patterns and RGB color model are given: Section 3 introduces the proposed methods of optic disc segmentation: Section 4, shows the experimental results by the proposed methods while conclusion is given in the last section.
2. BACKGROUND OF STUDY 2.1 Optic Disc Segmentation
Optic disc is known as the brightest region in a slightly elliptical shape. The optic disc is also found towards the right or left side of a fundus image. Optic disc segmentation plays a crucial step in an automated glaucoma detection system in order to estimate the optic disc boundary. The detection of optic disc and optic cup are important especially for glaucoma patients to proceed with treatment to prevent any major visual field loss. Besides that, the optic disc segmentation is also important for automated diagnosis of other ophthalmologic pathologies such as diabetic retinopathy and hemorrhages. The optic disc segmentation is a challenging task as fundus images may have noises, non-uniform illumination and the presence of blood vessels. Besides that, the variations in optic disc such as size, shape and color also making the segmentation process more difficult. Apart from that, the presence of peripapillary atrophy, the bright areas outside the optic disc rim will provide the contrast variation of optic disc and affecting the segmentation of optic disc process.
Numerous approaches of optic disc segmentation have been proposed, which can be generally categorized into three classes; template-based model [3]-[5], non-rigid model [6]-[10] and pixel-based classification method [11]. Basically, non-rigid model and template-based model are
based on edge characteristics of the optic disc. For template-based model, Zhu et al. [3] and Aquino et al. [4] employed circular Hough transform to model the disc boundary. However, clinical studies have shown that optic disc has an oval shape with 7-10% of larger vertical diameter larger than the horizontal diameter [12]. Thus, Cheng et al. [5] utilized ellipse fitting technique in optic disc segmentation by assuming the optic disc is in the shape of ellipse. For non-rigid modelling; energy function minimization method, active contour model, level set and modified active contour model are some of the techniques that have been employed in order to segment optic disc boundary. Lowell et al. [6] used active contour model by finding the optimal points based on the smoothness of the optic disc contour and image gradient. Xu et al. [7] developed non-rigid model based on energy function minimization dependent on image gradient, image intensity and smoothness of the optic disc boundary. Meanwhile, Zhang et al. [8] have combined level set method and ellipse fitting algorithm for the optic disc estimation and boundary smoothing. Joshi et al. [9] employed a modified Chan-Vese model while Yin et al. [10] combined active shape model and edge information to segment the optic disc boundary. To improve the initialization and segmentation in non-rigid modelling, pixel-based classification method was introduced. Simple Linear Iterative Clustering (SLIC) algorithm [13] is an example of pixel classification method, which is based on five-dimensional color channels to create dense and almost uniform superpixel efficiently.
2.2 Local Binary Patterns (LBP)
ISSN: 1992-8645 www.jatit.org E-ISSN: 1817-3195
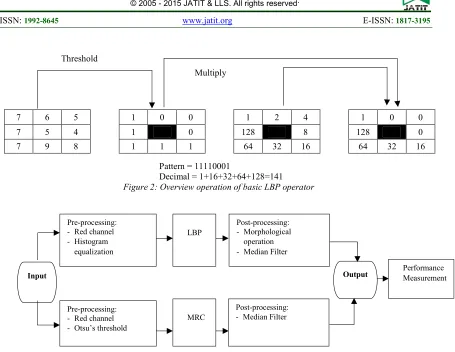
vector. Fig. 2 illustrates the basic operation of local binary patterns.
LBP operator is helpful to extract useful and unique features from a preprocessed image. LBP operator is invariant towards illumination changes since it is less affected by monotonic grayscale changes because of stable pixel intensity in a kernel neighborhood. However, LBP operator limitation is towards changes whereby its performance evaluation fluctuates according to the size of neighborhood kernel of a bigger matrix size. However, LBP has become very popular in image processing fields especially in pattern recognition due to the unique textural discriminant property at low computational cost and able to describe the texture and shape of an image. The LBP operator has also been applied to face recognition [15] and motion detection [16] applications.
2.3 RGB Color Model
Each pixel in colored digital images contains a combination of several primary colors. Primary colors are a set of colors that can be combined to produce a useful range of colors [17]. Normally,
only three primary colors are used for human applications to mimic human trichromatic color vision of three independent channels. For instance, an additive combination of colors model used red, green and blue as the primary colors while, for subtractive combination of colors model, the primary colors used are magenta, yellow and cyan. RGB color model is a type of additive color models that consists red, green and blue channels which are widely used in electronic display unit such as television and computer.
3. RESEARCH METHODOLOGY 3.1 Local Binary Patterns (LBP)
The proposed methodology herein is presented schematically as described in Fig. 3 starting with preprocessing, implementation of proposed methods, post-processing and lastly the performance evaluation on the both methods. In the preprocessing part, RGB color channel components of the input fundus image with size of 350x350 pixels are first analyzed individually. Later, it was found that the red channel has the highest discriminant property, especially for optic disc
7 6 5 1 0 0 1 2 4 1 0 0
7 5 4 1 0 128 8 128 0
7 9 8 1 1 1 64 32 16 64 32 16
Multiply
Pattern = 11110001
[image:3.612.91.546.61.413.2]Decimal = 1+16+32+64+128=141 Figure 2: Overview operation of basic LBP operator Threshold
Output Performance Measurement
Input
Pre-processing: - Red channel - Histogram
equalization
Pre-processing: - Red channel - Otsu’s threshold
LBP
Post-processing: - Morphological
operation - Median Filter
MRC
[image:3.612.97.528.67.240.2]Post-processing: - Median Filter
segmentation. It is because red channel has the highest contrast to between optic disc and non-optic disc region. However, some of the images have small intensity variations which results in low contrast images. Thus, a contrast enhancement algorithm based on histogram equalization is employed to increase the image quality for better input to the optic disc segmentation module. The histogram equalization method works by distributing the pixel intensity uniformly to cater the low contrast images.
For the proposed framework, basic uniform LBP is selected, in which the input pixels are grouped into a 3x3 matrix with 8-neighborhood pixels or sampling points, P on a circle with radius, R=1. Thresholding operation is then performed by calculating the relation between neighborhood pixels and central pixel in a clockwise direction in order to obtain the segmented boundary of optic disc. If the central pixel value is greater than the neighborhood value, the LBP operator will label the neighborhood pixel as ‘1’ and otherwise. An ordered set of binary comparisons of the pixels is obtained by the summation of binomial weights 2P to each sign of threshold differences as defined in Eq. 1 where ic and ip are the intensity value of central and neighborhood pixels respectively while, s(z) is the thresholding step function as defined in Eq. 2. The differences in the neighborhood signs are represented by 8-bit binary number in order to get decimal number of LBP distributions. Uniform LBP operator is performed to obtain a circular binary distributions whereby uniform LBP is the extension of basic operator. Uniform LBP is the condition where the binary pattern contains maximum two bitwise transitions from 1 to 0 or vice versa. The uniform LBP is chosen as it can detect most of the important features such as corner, spot, edge and end of the line [18].
In post-processing module, morphological operation and median filtering techniques are employed to smooth out the output of LBP operator. The morphological operation will erode away the regions which are not optic disc boundary. Disc structuring element is utilized with the assumption that optic disc has almost circular shape. Meanwhile, median filter is chosen to smooth out and reduce the noise without blurring the images.
3.2 Modified Red Channel (MRC)
All the channels of RGB color model are initially analyzed whereby red channel is selected
for the next segmentation process. Here, channel selection is computed by considering the contrast level of the three channels between optic disc region and background. As a result, red channel obtained the best performance in term of image contrast. On the other hand, the blue and green channels have low contrast and also contaminated by noise. Modified red channel image is obtained by computing the differences in pixel intensity between the red channel and other channels based on the best optimal level value of red channel. Basically, modified red channel is based on morphological segmentation which focused on frame differencing of all three channels. Otsu’s threshold is performed in order to find the best optimal level’s value of red channel to convert the input image into a binary image. Using the optimal level value, grayscale scaling is done on the pixel intensity differences between the red, green and blue channel. The grayscale scaling is done in order to obtain roughly the optic disc boundary in a clearer image. Next, pixel intensity differences of red and green channels are subtracted from the grayscale scaling image in order to remove the background variations and to enable the optic disc boundary to be more easily recognized. The resultant image will produce more precise and clearer optic disc boundary. Lastly, frame differencing between the resultant image and pixel intensity differences of red and green channels will result in a modified red channel image which eliminate all the background and produced a precise and clearer optic disc boundary. The segmented optic disc boundary is smooth out using median filtering and convert it into binary image using morphological dilation approach with the implementation of structuring element. In this proposed method, there are two main parameters that need to be considered carefully; firstly, the threshold level based on Otsu’s threshold and secondly, the disc size used as structuring element. These two parameters need to be focused on and selectively selected since it will result in loss of information if the two parameters are wrongly selected.
P-1 P
LBPP,R(x ,y )=c c s(i -i )2c p P=0
∑ (1)
ISSN: 1992-8645 www.jatit.org E-ISSN: 1817-3195
4. EXPERIMENTAL RESULTS
The performance of the proposed framework is validated using open access fundus image database, RIM-One database [19]. The database consists of 118 images of healthy eyes as well as the images with various glaucoma severity collected from three Spanish hospitals: Hospital Universitario de
Canarias, Hospital Clinico San Carlos and Hospital Universitario Miguel Servet. The optic disc boundary of each images is evaluated by four ophthalmologists and one optometrist to establish accurate gold standards by using variability measurement based on zones of the optic disc.
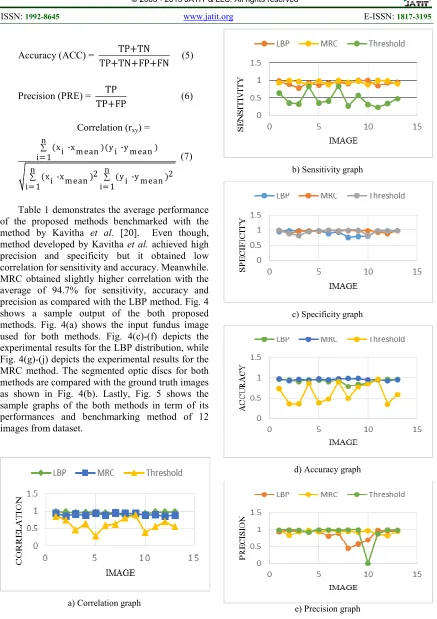
All the performances of both approaches are measured using performance measurements such as sensitivity, specificity, accuracy, precision and correlation. Sensitivity is defined as the proportion of true positive results, whereas specificity is defined as the proportion of the true negative results. Meanwhile, accuracy is defined as the proportion of detected true positives over the total number of cases examined, while precision is the
proportion of detected true positives against all the positive results. All performance measures were evaluated based on: 1) true positive (TP) which is the sum of pixels marked as optic disc from both experimental result and ground truth, 2) false positive (FP) which is the sum of pixels marked as optic disc in ground truth but not form the experimental result, 3) false negative (FN) which is the sum of pixels marked as optic disc in
experimental result but not from the ground truth and 4) true negative (TN) which is the sum of pixels marked as background region from both experimental and ground truth dataset. While, correlation is a statistical relationship between segmentation output with the ground truth images which represents the similarity in term of respective pixel intensity. The performance measures are calculated as below and the results are shown in Table 1.
Sensitivity (TPR) = TP
TP+ FN (3)
Specificity (SPC) = TN
TN+FP (4) Table 1: Performance evaluation of optic disc segmentation
Method Avg. Corr (%) Avg. TPR (%) Avg. SPC (%) Avg. Acc (%) Avg. Pre (%)
LBP 91.75 95.07 92.21 91.63 84.96
MRC 94.76 90.52 96.24 95.66 92.75
Kavitha et al. 45.46 61.96 94.93 62.17 89.83
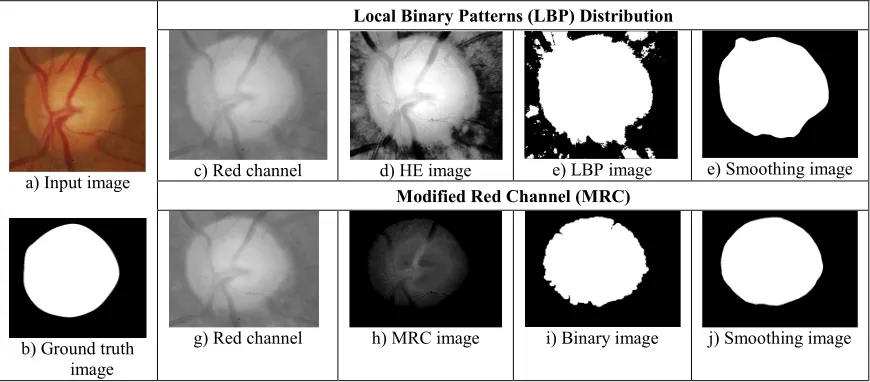
a) Input image
b) Ground truth image
Local Binary Patterns (LBP) Distribution
c) Red channel d) HE image e) LBP image e) Smoothing image Modified Red Channel (MRC)
[image:5.612.93.528.315.506.2]g) Red channel h) MRC image i) Binary image j) Smoothing image
Accuracy (ACC) = TP+TN
TP+TN+FP+FN (5)
Precision (PRE) = TP
TP+FP (6)
Correlation (rxy) =
n
(x -x )(y -y )
i m ean i m ean
i= 1
n 2 n 2
(x -x ) (y -y )
i m ean i m ean
i= 1 i= 1
∑
∑ ∑
[image:6.612.90.527.65.684.2](7)
Table 1 demonstrates the average performance of the proposed methods benchmarked with the method by Kavitha et al. [20]. Even though, method developed by Kavitha et al. achieved high precision and specificity but it obtained low correlation for sensitivity and accuracy. Meanwhile. MRC obtained slightly higher correlation with the average of 94.7% for sensitivity, accuracy and precision as compared with the LBP method. Fig. 4 shows a sample output of the both proposed methods. Fig. 4(a) shows the input fundus image used for both methods. Fig. 4(c)-(f) depicts the experimental results for the LBP distribution, while Fig. 4(g)-(j) depicts the experimental results for the MRC method. The segmented optic discs for both methods are compared with the ground truth images as shown in Fig. 4(b). Lastly, Fig. 5 shows the sample graphs of the both methods in term of its performances and benchmarking method of 12 images from dataset.
a) Correlation graph
b) Sensitivity graph
c) Specificity graph
d) Accuracy graph
e) Precision graph
ISSN: 1992-8645 www.jatit.org E-ISSN: 1817-3195
5. CONCLUSION
In this paper, two methods namely local binary patterns (LBP) and modified red channel (MRC) have been explored to segment the optic disc boundary for glaucoma detection in medical image processing. The performances such as correlation, sensitivity, specificity, accuracy and precision of each proposed method were validated by using the publicly available RIM-One database. From the recent method developed by Kavitha et al., the performances in optic disc segmentation are poor. However, by using the suggested methods, the overall results show that both methods performed better when compared to the recent method especially in terms of correlation, sensitivity and accuracy. Thus, both methods are suitable for segmenting the optic disc boundary, which will be used in order to calculate the cup-to-disc ratio for glaucoma screening purpose after the segmentation of optic cup. For the future work, the suggested methods will be used to segment the optic cup and the algorithms are implemented on large scale database in order to improve the segmentation performance.
ACKNOWLEDGMENT
This research is supported by Universiti Kebangsaan Malaysia (DIP-2012-03) and Ministry of Education (FRGS/2/2014/TK03/UKM/02/5).
REFRENCES:
[1] B. Thylefors and A. D. Negrel, “The global impact of glaucoma”, Bulletin of the World Health Organization, Vol. 72, No. 3, 1994, pp. 323-326.
[2] H. A. Quigley and A. T. Broman, “The number of people with glaucoma worldwide in 2010 and 2020”, British Journal of Ophthalmology, Vol. 90, No. 3, 2006, pp. 262-267.
[3] X. Zhu and R. M. Rangayyan, “Detection of the optic disc in images of the retina using the hough transform”, IEEE International Conference of Engineering in Medical and Biology Society, 2008, pp. 3546-3549.
[4] A. Aquino, M. Gegundez-Arias and D. Marin, “Detecting the optic disc boundary in digital fundus images using morphological, edge de- tection, and feature extraction techniques”, IEEE Transactions on Medical Imaging, Vol. 29, No. 11, 2010, pp. 1860-1869.
[5] J. Cheng, J. Liu, D. W. K. Wong, F. Yin, C. Cheung, M. Baskaran, T. Aung and T. Y.
Wong, “Automatic optic disc segmentation with peripapillary atrophy elimination”, IEEE International Conference of Engineering in Medical and Biology Society, 2011, pp. 6624-6627.
[6] J. Lowell, A. Hunter, D. Steel, A. Basu, R. Ryder, E. Fletcher and L. Kennedy, “Optic nerve head segmentation”, IEEE Transactions on Medical Imaging, Vol. 23, No. 2, 2004, pp. 256-264.
[7] J. Xu, O. Chutatape, E. Sung, C. Zheng and P. C. T. Kuan, “Optic disk feature extraction via modified deformable model technique for glaucoma analysis”, Pattern Recognition, Vol. 40, 2007, pp. 2063-2076.
[8] Z. Zhang, J. Liu, N. S. Cherian, Y. Sun, J. H. Lim, W. K.Wong, N.M. Tan, S. Lu, H. Li and T. Y. Wong, “Convex hull based neuro-retinal optic cup ellipse optimization in glaucoma diagnosis”, IEEE International Conference of Engineering in Medical and Biology Society, 2009, pp. 1441-1444.
[9] G. D. Joshi, J. Sivaswamy and S. R. Krishnadas, “Optic disk and cup segmentation from monocular color retinal images for glaucoma assessment”, IEEE Transactions on Medical Imaging, Vol. 30, No. 6, 2011, pp. 1192-1205.
[10] F. Yin, J. Liu, S. H. Ong, Y. Sun, D. W. K. Wong, N. M. Tan, C. Cheung, M. Baskaran, T. Aung and T. Y.Wong, “Model-based optic nerve head segmentation on retinal fundus images”, IEEE International Conference of Engineering in Medical and Biology Society, 2011, pp. 2626-2629.
[11] J. Cheng, J. Liu, Y. Xu, D. W. K. Wong, B. H. Lee, C. Cheung, T. Aung and T. Y. Wong, “Superpixel classification for initialization in model based optic disc segmentation”, IEEE International Conference of Engineering in Medical and Biology Society, 2012, pp. 1450-1453.
[12] J. B. Jonas, W. M. Budde and S. Panda-Jonas, “Ophthalmoscopic evaluation of the optic nerve head”, Survey of Ophthalmology, 1999, pp. 293–320.
[13] R. Achanta, A. Shaji, K. Smith, A. Lucchi, P. Fua and S. Susstrunk, “Slic superpixels compared to state-of-the-art superpixel methods”, IEEE Transactions on Pattern Analysis and Machine Intelligence, Vol. 34, No. 11, Nov. 2012, pp. 2274–2281.
Pattern Recognition, Vol. 29, No. 1, 1996, pp. 51-59.
[15] H. Jin, Q. Liu, H. Lu and X. Tong, “Face detection using improved LBP under Bayesian framework”, International Conference of IEEE Transactions on Pattern Analysis and Machine Intelligence, vol. 28, no. 12, 2006, pp. 2037-2041.
[16] M. Heikkila, M. Pietikanen and J. Heikkila, “A texture based method for detecting moving objects”, British Machine Vision Conference, 2004.
[17] Primary Color.
http://en.wikipedia.org/wiki/Primary_color [18] M. Pietikäinen, A. Hadid, G. Zhao and T.
Ahonen, “Local binary patterns for still
images”, Computer Vision, 2011, pp. 13-47.
[19] F. Fumero, S. Alayon, J. L. Sanchez, J. Sigut and M. Gonzalez-Hernandez, “RIM-ONE: An open retinal image database for optic nerve evaluation”, International Symposium on Computer-Based Medical Systems (CBMS), 2011, pp. 1-6.