ISSN 2250-3153
Theoretical Study on the effect of Radon emanation
process in soil samples on the absolute efficiency of an
HPGe detector
W.F. Bakr
Quality control and quality assurance department, Egyptian nuclear and radiological regulatory authority, Cairo, Egypt
DOI: 10.29322/IJSRP.9.06.2019.p9089
http://dx.doi.org/10.29322/IJSRP.9.06.2019.p9089
Abstract- Radium-226 activity is determined by gamma spectrometry, based on the measurement of radon progeny short lived isotopes (214Pb and 214Bi) when Ra-Rn secular equilibrium is reached. Depending on the behaviors of radon emanation from the soil
matrix, the homogeneous distribution of these radionuclides in measured soil samples may be lost, which may affect the quality of the obtained results if not taken into consideration. This paper highlights some assumptions regarding the distribution of radon daughters in the soil matrix and their effect on the detection efficiency of an HPGe detector using Mont Carlo simulation code.
Index Terms- Gamma spectrometry, Mont-Carlo simulation, Particle distribution, Radon emanation,
INTRODUCTION
amma spectrometry is a useful non-destructive method that is commonly applied to determine, indirectly, the concentration of radium-226 in environmental samples through the measurement of the progeny nuclides of radon isotopes [1]. The progeny of the radon isotope that is commonly used to determine its concentration is composed of the two short lived 214Pb and 214Bi
radionuclides with corresponding gamma energy line groups of 295.0 , 352.0 and 609.0 1120.0 , 1764.0 keV; respectively.
The importance in the measurements of radon isotopes lies in their detrimental effect on human. Since they occur in nature, man has always been exposed, mainly through inhalation of their decay products. Radon is released to the atmosphere through three modes namely; i) emanation: as its atom emanated from radium decay is escaping by recoil energy into the pores of the grains; ii) transport or diffusion: which is the diffusion flow that causes the movement of radon atoms to ground surface and iii) exhalation: where the transported atoms are exhaled to the atmosphere [2]. The most important factor relating to radon concentration is the emanation coefficient which is the fraction of radon that reaches the pore space. It depends on different factors such as crystalline structure, grain size and moisture contents [374]. The values of emanation coefficient vary from 1% to 50% over a wide range of materials, conditions, definitions and measurement methods [5&6]. The radon exhalation from soil surface is affected by the soil’s characteristics like radium contents, the internal structure, grain size, porosity, permeability and the emanation coefficient, etc.[7] For the determination of emanation coefficient of 222Rn using gamma spectrometry, the sample is sealed in a container and the
count rates from 214Pb or 214Bi gamma lines are measured at the time of sealing and after the establishment of radioactive equilibrium
between 226Ra and its progeny (28 days) [8].
Several techniques are used to determine the emanation factor and the effective 226Ra activity from 222Rn exhalation [9&10]. Two
main approaches use a time varying mean 222Rn concentration approximation in a confined atmosphere [11&12].
The emanation coefficient “E” is calculated from the following equation [8]:-
𝐸𝐸 = 𝑁𝑁𝑒𝑒𝑒𝑒−𝑁𝑁°
𝑁𝑁𝑒𝑒𝑒𝑒 --- (1)
Where Neq is the specific counts selected from peaks of 214Pb and 214Bi in equilibrium condition; and N0 is the number of counts
corresponding to Neq in initial condition.
Based on the mentioned modes of Rn gas in the soil matrix, there are three probabilities for the existing the radon atoms in the soil where:-
1- Emanation of radon from radium nuclides without transport, 2- Emanation and transport of radon through the grain pores,
3- Emanation, transport and exhalation of radon to the adjacent atmosphere,
The activity concentration of Radium in soil, in the absence of radon transport can be calculated as [13&14] :-
CRa−226,228=f∗ ρCRn−222,220
s∗ ϵ−1∗(1− ϵ)∗(µ[kT−1] + 1)− − − −(2)
CRa-226,228: is the activity concn. in dry mass of 226Ra,228Ra in soil (Bq/kg),
f: is soil emanation factor: radon (0.2) and thoron (0.1), ρs :is the density of soil, (kgm-3),
ϵ : is the porosity, (0.25),
µ: is the porosity fraction that is water filled and is zero if the soil is dry
kT : is the radon partition coefficient between water and air phases and if the soil samples are dried before measurement, then m is
zero.
By normal gamma spectrometry where the calculation is fully based on the emanation of radon gas from radium and assuming complete homogeneous distribution of the decayed atoms on the soil matrix of the sample, the activity concentration of radium (Bq/kg) is calculated through the following equation [15]:-
ARa= ε ∗Net countT∗m∗B. R.i − − − −(3)
Where
Net counti : is the net count under peak area of radon progeny gamma line (i)
ε: is the efficiency of gamma spectrometry T : is the total time of counting
B.R. : is Branching ratio of the selectedgamma line m: is the mass of the sample (kg)
This work is highlighting the effect of the other two radon modes in the soil matrix (namely, the transport and the exhalation), where the radon atoms transferred to the adjacent atmosphere and the decayed progeny is deposited on the surface of the sample, which leads to a non-uniform distribution of the atoms on the soil matrix of the sample. The absolute efficiency of the gamma detector was estimated for two assumptions i) uniform distribution of radon progeny in the soil matrix and ii) deposition of radon progeny on the surface of the soil sample. The study was carried out using the general Mont Carlo Code MCNP5 for the two assumptions considering the same properties of the soil sample as well as the same setup configuration of the modeled problem.
I. MATERIAL AND METHODS
The effect of different distributions of radon daughters in soil samples on the absolute efficiency of an HPGe detector was studied. The study was carried out on different soil samples using the MCNP5 general MC Code [16&17].
- Modeled Samples
Three different samples were modeled in this study. The sample characteristics were assumed to be identical except for material composition and density. The model was applied to the IAEA reference materials RGU, 375 and soil 6. The activity concentrations of
226Ra in the selected samples as well as their densities are illustrated in table (1) [18&19]. All samples were assumed to have the same
volume (70 cm3), and kept in polyethylene containers with the same shape and dimensions. The radon daughters that were considered
in this study are 214Pb and 214Bi with corresponding gamma energy groups of 242.0, 295.0, 352.0 ,768.7keV and 609.0 ,665.4,1120.0,
1764.0 keV, respectively. The study includes two assumptions where; i) there is a homogenous distribution of the decayed isotopes on the whole volume of the sample (referred to volume source ) and ii) there is a non-uniform distribution of the decayed isotopes where they will remain on the surface of the sample (referred as surface source).
- Monte Carlo Simulation
Monte Carlo Calculations were performed using the MCNP5 Code to calculate the absolute full energy peak efficiency for an HPGe detector. The calculations were performed to investigate the effect of radon daughters’ distribution on the accuracy of measurements. The samples were modeled according to the above mentioned assumptions. The material compositions were modeled using material cards based on data given in the references [19&20]. The fine details of the sample container and detector type and model as given in figures 1 and 2 are described elsewhere [21]. Source definition cards (SDEF) were specified to describe two cases i) volume source for which the modeled isotopes were assumed to be uniformly distributed over the whole sample volume and ii) surface source for which the isotopes were assumed to be distribute on a very thin layer on the surface of the sample. The particle display feature in the MCNP5 code is used to illustrate the two cases as shown in figure 1. The number of histories was chosen (1E7) to keep the uncertainty in MC calculations always less than 0.5%.
Table (1) : The activity concentration of 226Ra in IAEA reference materials
Sample Name Density (Bq/kg) Type 226Ra Activity (Bq/kg)
RGU 1.23 Uranium ore 857.0E+3
Soil -6 1.19 Soil 79.92±
ISSN 2250-3153
[image:3.612.163.452.56.234.2](a) (b)
Figure 1. Particle display illustrating (a) volume source and (b) surface sources
II. RESULTS AND DISCUSSION
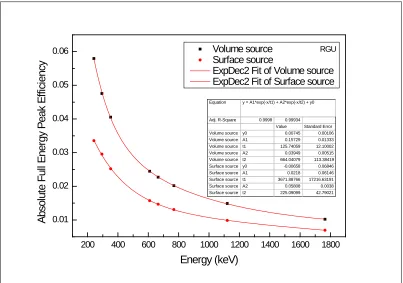
The difference in the efficiency of gamma spectrometer based on HPGe detector due to the distribution of radon progenies was carried out. Figures 2,3&4 illustrate the differences in the detector efficiency depending on the volume source and surface source for the selected reference samples .
200 400 600 800 1000 1200 1400 1600 1800 0.01
0.02 0.03 0.04 0.05
0.06 Volume source
Surface source
ExpDec2 Fit of Volume source ExpDec2 Fit of Surface source
A
bs
ol
ut
e F
ul
l E
ner
gy
P
eak
E
ff
ic
ienc
y
Energy (keV)
Equation y = A1*exp(-x/t1) + A2*exp(-x/t2) + y0
Adj. R-Square 0.9998 0.99934 Value Standard Error Volume source y0 0.00745 0.00106 Volume source A1 0.15729 0.01333 Volume source t1 125.74059 12.10002 Volume source A2 0.03949 0.00515 Volume source t2 664.04079 113.38419 Surface source y0 -0.00658 0.06846 Surface source A1 0.0218 0.06146 Surface source t1 3671.88766 17216.63191 Surface source A2 0.05808 0.0038 Surface source t2 225.09099 42.79021 RGU
[image:3.612.105.508.352.635.2]0 200 400 600 800 1000 1200 1400 1600 1800 2000 0.00 0.01 0.02 0.03 0.04 0.05 0.06 0.07 Volume source Surface source
ExpDec2 Fit of Volume source ExpDec2 Fit of Surface source
A
bs
ol
ut
e F
ul
l E
ner
gy
P
eak
E
ffi
ci
enc
y
Energy (keV)Equation y = A1*exp(-x/t1) + A2*exp(-x/t2) + y0
Adj. R-Square 1 0.99999
[image:4.612.88.528.57.317.2]Value Standard Error Volume source y0 0.00709 1.26375E-4 Volume source A1 0.15535 0.00103 Volume source t1 135.11638 1.17654 Volume source A2 0.03818 4.93222E-4 Volume source t2 718.77069 13.69685 Surface source y0 0.00492 1.72905E-4 Surface source A1 0.02402 5.96821E-4 Surface source t1 748.4152 29.40276 Surface source A2 0.09159 0.00115 Surface source t2 139.27035 2.45563
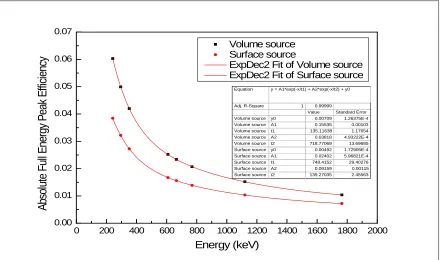
Figure 3. The detector efficiency differences in Soil-6
0 200 400 600 800 1000 1200 1400 1600 1800 2000 0.00 0.01 0.02 0.03 0.04 0.05 0.06 0.07 Volume source Surface source
ExpDec2 Fit of Volume source ExpDec2 Fit of Surface source
A
bs
ol
ut
e F
ul
l E
ner
gy
P
eak
E
ffi
ci
enc
y
Energy (keV)Equation y = A1*exp(-x/t1) + A2*exp(-x/t2) + y0
[image:4.612.94.527.353.597.2]Adj. R-Square 1 0.99998 Value Standard Error Volume source y0 0.00675 1.6703E-4 Volume source A1 0.03506 5.66142E-4 Volume source t1 759.89413 19.55285 Volume source A2 0.13179 9.49201E-4 Volume source t2 143.91179 1.58043 Surface source y0 0.00428 3.49523E-4 Surface source A1 0.06271 9.2184E-4 Surface source t1 163.96998 4.88746 Surface source A2 0.01965 7.79527E-4 Surface source t2 878.76187 71.3793 Sample 375
Figure 4: The detector efficiency differences in IAEA-375
The average differences in the detector efficiency were found to be 36.23% (32.1%-42.1%), 33.7% (30.6% -36.2%) and 36.4% (32.1%- 40.9%) based on the data of RGU-1, soil-6 and IAEA-375 respectively.
It is clear from the three figures that the same trend is repeated for which the maximum efficiency differences occurs at low gamma energies, while they reduce gradually as energies increase. Three essential factors could effectively contribute to such differences. The fractional solid angle of the source subtended by the detector is the main factor [15&22]. An estimation of the differences in such geometry factor showed a value of about 29%. The other two factors, namely, material composition and density are responsible for the rest of differences.
ISSN 2250-3153
For surface source the gamma self-attenuation is expected to be relatively high in comparison with volume source, since the all gamma rays have to cross the whole thickness of the sample before falling on the detector. The lower the energy of gamma rays, the higher the self-attenuation effect as it is clear from the figures.
Only two extreme cases were considered in this investigation, in which all the daughter nuclides of the emanated radon particles are either distributed homogeneously in the soil matrix, or they distributed on the surface of the sample due to complete exhale of emanated radon to the adjacent atmosphere. The results showed the importance of taking the emanation coefficient and exhalation flux calculations into consideration while performing gamma ray measurements on samples containing radon and radon daughters.
III. CONCLUSION
Modeling of the two assumption related to the behavior of radon gas on the soil matrix was carried out where there is a homogeneous distribution of the radon decay products on the soil matrix based on the emanation process of radon from radium atoms (referred as volume source), and the other is a non-uniform distribution of radon’s progeny on the soil matrix based on the exhalation of radon gas from the soil matrix to the sample volume’s atmosphere and re-deposition of the radon progeny on the surface of the soil (refereed as surface source). The results of the two assumptions showed that there are big differences in the absolute efficiency of the detector. The study highlighted that during the determination of 226Ra through the short lived daughters of 222Rn gas by gamma spectrometry; it is
very important to take into considerations the behavior of radon emanation from the soil sample before measurements. Suggestion for using packed sample without volume space may increase the homogeneity of the nuclides on the soil matrix. Comprehensive study on the calculation of emanation coefficient and radon flux in soil samples and study their effect on the calculation of the detector efficiency is recommended.
.
ACKNOWLEDGMENT
The author would like to thank Prof. Wael El-gmmal the head of physical protection and safeguard department/ENRRA for his valuable assistance in revising the article and in using the Mont Carlo Code.
REFERENCES
[1] Y. Ishimori, K. Lange, P. Martin, Y.S. Mayya, M. Phaneuf, Measurement and Calculation of Radon Releases from NORM Residues, IAEA Technical Reports Series No. 474,2013]
[2] MOED, B.A., NAZAROFF, W.W., SEXTRO, R.G., “Soil as a source of indoor radon: Generation, migration and entry”, Radon and its Decay Products in Indoor Air (NAZAROFF, W.W., NERO Jr., A.V., Eds), John Wiley and Sons, New York (1988) 57– 112].
[3] M. Baskaran, Radon: A Tracer for Geological, Geophysical and Geochemical Studies. Springer Geochemistry, Springer International Publishing, 1 ed., (2016).]
[4] A. Sakoda, Y. Ishimori, K. Hanamoto, T. Kataoka, A. Kawabe, and K. Yamaoka, “Experimental and modeling studies of grain size and moisture content effects on radon emanation,” Radiation Measurements, vol. 45, no. 2, pp. 204–210, (2010)]
[5] A. Sakoda, Y. Ishimori, and K. Yamaoka, “A comprehensive review of radon emanation measurements for mineral, rock, soil, mill tailing and fly ash,” Applied Radiation and Isotopes, vol. 69, no. 10, pp. 1422–1435, (2011)]
[6] R. Kardos, A. Gregoriˇc, J. J´on´as, J. Vaupotiˇc, T. Kov´acs, and Y. Ishimori, “Dependence of radon emanation of soil on
lithology,” Journal of Radioanalytical and Nuclear Chemistry, vol. 304, pp. 1321–1327(Jun, 2015)].
[7] D. Mazur, M. Janik, et al., ‘‘Measurements of radon concentration in soil gas by CR-39 detectors,’’ Radiat. Meas., 31, 295 (1999)].[ K. M. Aburnurad, M. Al Tamimi, ‘‘Emanation power of radon and its concentration in soil and rocks,’’ Radiat. Meas., 34, 423 (2001).
[8] Y. Ishimori, K. Lange, P. Martin, Y.S. Mayya, M. Phaneuf, Measurement and Calculation of Radon Releases from NORM Residues, IAEA Technical Reports Series No. 474, 2013].
[9] N. K. Ryzhakova, A new method for estimating the coefficients of diffusion and emanation of radon in the soil," Journal of Environmental Radioactivity, vol. 135, pp. 63- 66, (2014)
[10] A. Awhida, P. Uji_c, I. Vukanac, M. Dura_sevi_c, A. Kandi_c, I. _Celikovi_c, B. Lon_car, and P. Kolar_z,, Novel method of measurement of radon exhalation from building materials," Journal of Environmental Radioactivity, vol. 164, pp. 337{343, (2016)
[11] C. Ferry, P. Richon, A. Beneito, J. Cabrera, and J.-C. Sabroux,, An experimental method for measuring the radon-222 emanation factor in rocks," Radiation Measurements, vol. 35, no. 6, pp. 579{583, (2002).
[12] M. Jang, C.-S. Kang, and J. H. Moon, Estimation of 222Rn release from the phosphorgypsum board used in housing panels,"
Journal of Environmental Radioactivity, vol. 80, no. 2, pp. 153{160, (2005).
[15] Maurice Oneil Miller, Modeling a HPGe detector's absolute efficiency as a function of gamma energy and soil density in uncontaminated soil, SDRP Journal of Earth Sciences & Environ-mental Studies 3(4) (2018).
[16] X-5 Monte Carlo Team, MCNP - A General Monte Carlo N Particle Transport Code, Version 5, Volume I: Overview and Theory, LA-UR-03-1987 (Revised 10/3/05), April 24, 2003.
[17] X-5 Monte Carlo Team, MCNP - A General Monte Carlo N Particle Transport Code, Version 5, Volume II: User’s Guide, LA-CP-03-0245 (Revised 10/3/05), April 24, 2003.
[18] IAEA AQCS Catalogue for reference materials and inter-comparison exercises, (1998/1999), IAEA, Vienna.
[19] Preparation and certification of IAEA gamma-ray spectrometry reference materials RGU-1, RGTh-1 and RGK-1, IAEA/RL/148, (1987).
[20] Zhongtang Wang, Guosheng Yang, Jian Zheng, Liguo Cao, Haijun Yu, Yanbei Zhu, Keiko Tagami1, Shigeo Uchida, Effect of ashing temperature on accurate determination of plutonium in soil samples, Supporting information, Anal. Chem. (2015), 87, 5511−5515.
[21] Wafaa F. Bakr, Study the effect of sample's chemical composition on the quality of gamma measurements using Mont-Carlo simulation, International Journal of Engineering and Applied Sciences (IJEAS) ISSN: 2394-3661, Volume-6, Issue-1, January 2019
[22] I. Akkurt,1 K. Gunoglu,2 and S. S. Arda1, Detection Efficiency of NaI(Tl) Detector in 511–1332 keV Energy Range, Science and Technology of Nuclear Installations, Article ID 186798, 5 pages(2014).
AUTHORS