International Journal of Emerging Technology and Advanced Engineering
Website: www.ijetae.com (ISSN 2250-2459, ISO 9001:2008 Certified Journal, Volume 5, Issue 1, January 2015)
507
Comparative Analysis of WEKA Data Mining Algorithm
RandomForest, RandomTree and LADTree for Classification of
Indigenous News Data
Sushilkumar Rameshpant Kalmegh
Associate Professor, Department of ComputerScience, SGBAU, Amravati (M.S.), India.
Abstract—The amount of data in the world and in our lives seems ever-increasing and there’s no end to it. We are overwhelmed with data. The WWW overwhelms us with information. The Weka workbench is an organized collection of state-of-the-art machine learning algorithms and data preprocessing tools. The basic way of interacting with these methods is by invoking them from the command line. However, convenient interactive graphical user interfaces are provided for data exploration, for setting up large-scale experiments on distributed computing platforms, and for designing configurations for streamed data processing. These interfaces constitute an advanced environment for experimental data mining. Classification may refer to categorization, the process in which ideas and objects are recognized, differentiated, and understood. Classification is an important data mining technique with broad applications. It classifies data of various kinds. This paper has been carried out to make a performance evaluation of RandomForest, RandomTREE, and LADTree classification algorithm. The paper sets out to make comparative evaluation of classifiers RandomForest, RandomTREE, and LADTree in the context of dataset of Indian news to maximize true positive rate and minimize false positive rate. For processing Weka API were used. The results in the paper on dataset of Indian news also show that the efficiency and accuracy of RandomTREE is good than RandomForest and LADTree.
Keywords— LADTree, RandomForest, RandomTREE, Weka, WWW
I. INTRODUCTION
The amount of data in the world and in our lives seems ever-increasing and there’s no end to it. We are overwhelmed with data. Today Computers make it too easy to save things. Inexpensive disks and online storage make it too easy to postpone decisions about what to do with all this stuff, we simply get more memory and keep it all. The World Wide Web (WWW) overwhelms us with information; meanwhile, every choice we make is recorded. As the volume of data increases, inexorably, the proportion of it that people understand decreases alarmingly. Lying hidden in all this data is information.
In data mining, the data is stored electronically and the search is automated or at least augmented by computer. Even this is not particularly new. Economists, statisticians, and communication engineers have long worked with the idea that patterns in data can be sought automatically, identified, validated, and used for prediction. What is new is the staggering increase in opportunities for finding patterns in data.
Data mining is a topic that involves learning in a practical, non theoretical sense. We are interested in techniques for finding and describing structural patterns in data, as a tool for helping to explain that data and make predictions from it. Experience shows that in many applications of machine learning to data mining, the explicit knowledge structures that are acquired, the structural descriptions, are at least as important as the ability to perform well on new examples. People frequently use data mining to gain knowledge, not just predictions.
II. LITERATURE SURVEY
A. WEKA
Weka was developed at the University of Waikato in New Zealand; the name stands for Waikato Environment for Knowledge Analysis The system is written in Java and distributed under the terms of the GNU General Public License. It runs on almost any platform and has been tested under Linux, Windows, and Macintosh operating systems and even on a personal digital assistant. It provides a uniform interface to many different learning algorithms, along with methods for pre and post processing and for evaluating the result of learning schemes on any given dataset. Weka provides implementations of learning algorithms that can be easily apply to dataset. It also includes a variety of tools for transforming datasets, such as the algorithms.
International Journal of Emerging Technology and Advanced Engineering
Website: www.ijetae.com (ISSN 2250-2459, ISO 9001:2008 Certified Journal, Volume 5, Issue 1, January 2015)
508
It provides extensive support for the whole process of experimental data mining, including preparing the input data, evaluating learning schemes statistically, and visualizing the input data and the result of learning. As well as a variety of learning algorithms, it includes a wide range of pre processing tools. This diverse and comprehensive toolkit is accessed through a common interface so that its users can compare different methods and identify those that are most appropriate for the problem at hand. All algorithms take their input in the form of a single relational table in the ARFF format. The easiest way to use Weka is through a graphical user interface called Explorer as shown in figure I. This gives access to all of its facilities using menu selection and form filling.
FIGURE I:WEKA GUIEXPLORER
The Weka contains a collection of visualization tools and algorithms for data analysis and predictive modeling, together with graphical user interfaces for easy access to this functionality. Advantages of Weka include:
Free availability under the GNU General Public License
Portability, since it is fully implemented in the Java programming language and thus runs on almost any modern computing platform.
A comprehensive collection of data preprocessing and modeling techniques.
Ease of use due to its graphical user interfaces.
[image:2.612.49.290.302.483.2]International Journal of Emerging Technology and Advanced Engineering
Website: www.ijetae.com (ISSN 2250-2459, ISO 9001:2008 Certified Journal, Volume 5, Issue 1, January 2015)
509
International Journal of Emerging Technology and Advanced Engineering
Website: www.ijetae.com (ISSN 2250-2459, ISO 9001:2008 Certified Journal, Volume 5, Issue 1, January 2015)
510
FIGURE III:PROCESSING OF arffFILE BY RANDOMFOREST CLASSIFIER
B. Classification
Classification may refer to categorization, the process in which ideas and objects are recognized, differentiated, and understood. An algorithm that implements classification, especially in a concrete implementation, is known as a classifier. The term "classifier" sometimes also refers to the mathematical function, implemented by a classification algorithm that maps input data to a category.
In the terminology of machine learning, classification is considered an instance of supervised learning, i.e. learning where a training set of correctly identified observations is available. The corresponding unsupervised procedure is known as clustering or cluster analysis, and involves grouping data into categories based on some measure of inherent similarity.
Classification is a data mining algorithm that creates a step-by-step guide for how to determine the output of a new data instance.
The tree it creates is exactly that: a tree whereby each node in the tree represents a spot where a decision must be made based on the input, and to move to the next node and the next until one reach a leaf that tells the predicted output. Sounds confusing, but it's really quite straightforward.
There is also some argument over whether classification methods that do not involve a statistical model can be considered "statistical". Other fields may use different terminology: e.g. in community ecology, the term "classification" normally refers to cluster analysis, i.e. a type of unsupervised learning, rather than the supervised learning. [2].
I] RandomForest Classifiers:
International Journal of Emerging Technology and Advanced Engineering
Website: www.ijetae.com (ISSN 2250-2459, ISO 9001:2008 Certified Journal, Volume 5, Issue 1, January 2015)
511
The generalization error for forests converges to a limit as the number of trees in the forest becomes large.
Random Forests (RF) is a special kind of ensemble learning techniques and robust concerning the noise and the number of attributes.Random forests are an ensemble learning method for classification (and regression) that operate by constructing a multitude of decision trees at training time and outputting the class that is the mode of the classes output by individual trees. The algorithm for inducing a random forest was developed by Leo Breiman and Adele Cutler, and "Random Forests" is their trademark. The term came from random decision forest that was first proposed by Tin Kam Ho of Bell Labs in 1995. The method combines Breiman's "bagging" idea and the random selection of features, introduced independently by Ho and Amit and Geman in order to construct a collection of decision trees with controlled variation.
RF builds an ensemble of CART tree classifications using bagging mechanism. By using bagging, each node of trees only selects a small subset of features for the split, which enables the algorithm to create classifiers for high dimensional data very quickly. This somewhat counterintuitive strategy turns out to perform very well compared to the state-of-the-art methods in classification and regression. Also, RF runs efficiently on large data sets with many features and its execution speed is fast. RF produces additional facilities, especially the variable importance by numerical values.
The key idea of the regularization framework is to penalize selecting a new feature for splitting when its gain (e.g. information gain) is similar to the features used in previous splits. The regularization framework is applied on random forest and boosted trees here, and can be easily applied to other tree models. Experimental studies show that the regularized trees can select high-quality feature subsets with regard to both strong and weak classifiers. Because tree models can naturally deal with categorical and numerical variables, missing values, different scales between variables, interactions and nonlinearities etc., the tree regularization framework provides an effective and efficient feature selection solution for many practical problems. [3] [4] [5] [6] [8]
II] RandomTree Classifiers:
Random Tree is a supervised Classifier; it is an ensemble learning algorithm that generates many individual learners. It employs a bagging idea to produce a random set of data for constructing a decision tree. In standard tree each node is split using the best split among all variables.
In a random forest, each node is split using the best among the subset of predicators randomly chosen at that node.
Random trees have been introduced by Leo Breiman and Adele Cutler. The algorithm can deal with both classification and regression problems. Random trees is a collection (ensemble) of tree predictors that is called forest. The classification works as follows: the random trees classifier takes the input feature vector, classifies it with every tree in the forest, and outputs the class label that received the majority of “votes”. In case of a regression, the classifier response is the average of the responses over all the trees in the forest.
Random Trees are essentially the combination of two existing algorithms in Machine Learning: single model trees are combined with Random Forest ideas. Model trees are decision trees where every single leaf holds a linear model which is optimised for the local subspace described by this leaf. Random Forests have shown to improve the performance of single decision trees considerably: tree diversity is generated by two ways of randomization. First the training data is sampled with replacement for each single tree like in Bagging. Secondly, when growing a tree, instead of always computing the best possible split for each node only a random subset of all attributes is considered at every node, and the best split for that subset is computed. Such trees have been for classification Random model trees for the first time combine model trees and random forests. Random trees employ this produce for split selection and thus induce reasonably balanced trees where one global setting for the ridge value works across all leaves, thus simplifying the optimization procedure. [7] [9] [10]
III] LADTree Classifiers:
A least absolute deviation (LAD) is used to find the error criterion to obtain regression trees. Logical analysis of data is one other classification method proposed in optimization literature.In LAD a classifier is build based on learning a logical expression. LAD is binary classifier and hence can distinguish between positive and negative samples. The basic assumption of LAD model is that a binary point covered by some positive patterns, but not covered by any negative pattern is positive, and similarly, a binary point covered by some negative patterns, but not covered by positive pattern is negative. For a given data set LAD model constructs large set patterns and selects subset of them which satisfies the above assumption such that each pattern in the model satisfies certain requirement in terms of prevalence and homogeneity.
International Journal of Emerging Technology and Advanced Engineering
Website: www.ijetae.com (ISSN 2250-2459, ISO 9001:2008 Certified Journal, Volume 5, Issue 1, January 2015)
512
Logical Analysis of Data (LAD) tree is the classifier for binary target variable based on learning a logical expression that can distinguish between positive and negative samples in a data set. The central concept in LAD tree algorithm is that of classification, clustering, and other problems. The construction of LAD model for a given data set typically involves the generation of large set patterns and the selection of a subset of them that satisfies the above assumption such that each pattern in the model satisfies certain requirements in terms of prevalence and homogeneity.
LADTree is a class for generating a multiclass alternating decision tree using logistics strategy. LADTree produces a multi- class LADTree. It has the capability to have more than two class inputs. It performs additive logistic regression using the Logistics Strategy. [8] [11] [12] [13]
III. SYSTEM DESIGN
In order to co-relate News with the categories, a model based on the machine learning and XML search was designed. Flow diagram of the model for news resources is shown below in fig IV. As a input to the model, various news resources are considered which are available online like the news in Google news repository or online paper like Times of India, Hindustan Times etc. Around 649 news were collected on above repository. In order to extract context from the news and co-relate it with the proper e-content, the News was process with stemming and tokenization on the news contents. The news then was converted into the term frequency matrix for further analysis purpose. Based on this data, features (i.e. metadata) were extracted so that contextual assignment of the news to the appropriate content can be done. This process is known as metadata processing in the above flow diagram. Title of the also contains useful information in the abstract form, the title also can be considered as Metadata. The title of the news is processed using NLP libraries (Standford NLP Library) to extract various constituents of it. The output of NLP process was also used to co-relate the News (textual, audio, video) to the concern e-learning contents. This process can be initiated automatically when the user access any content from e-Learning data repository.
As shown in the figure, a news resource is processed to correlate with the e-Contents available. On the similar way, other text resources can be added directly with the e-Content in the repository, Image or Video resource can be processed for meta-data available. And thus can be searched with the related e-Contents. [15] [16]
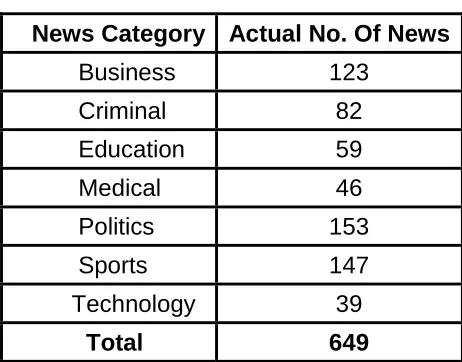
IV. DATA COLLECTION
Hence it was proposed to generate indigenous data. Consequently the national resources were used for the research purpose. Data for the purpose of research has been collected from the various news which are available in various national and regional newspapers available on internet. They are downloaded and after reading the news they are manually classified into 7 (seven) categories. There were 649 news in total. The details are as shown in Table I.
The attributes consider for this classification is the topic to which news are related; the statements made by different persons; the invention in Business, Education, Medical, Technology; the various trends in Business; various criminal acts e.g. IPC and Sports analysis. During classification some news cannot be classified easily e.g.
(1) Political leader arrested under some IPC code, (2) Some invention made in medicine and launched in
the market & business done per annum.
Hence, there will be drastic enhancement in e-Contents when we refer to the latest material available in this regards. For example, if some e-Content refers to the political situation of India, then the references needs to be dynamic as the situation may change depending on the result of election. [15] [16]
TABLE I.
CATEGORIZATION OF NEWS
News Category Actual No. Of News
Business
123
Criminal
82
Education
59
Medical
46
Politics
153
Sports
147
Technology
39
Total
649
V. PERFORMANCE ANALYSIS
[image:6.612.328.559.457.638.2]International Journal of Emerging Technology and Advanced Engineering
Website: www.ijetae.com (ISSN 2250-2459, ISO 9001:2008 Certified Journal, Volume 5, Issue 1, January 2015)
513
Stemming is used as many times when news is printed, for a same there can be many variants depending on the tense used or whether it is singular or plural. Such words when processed for stemming, generates a unique word. Stop words needs to be removed as they do not contribute much in the decision making process. Frequency matrix thus generated can be processed for generating a model and the model so generated was used in further decision process. With the model discussed above, two classifier RandomForest, RandomTree and LADTree were used on the data set of 649 news. For processing Weka APIs were used. The result after processing is given in the form of confusion matrix which is shown in Table II, IV and Table VI.
Random forests works on combination of tree predictors such that each tree depends on the values of a random vector sampled independently and with the same distribution for all trees in the forest. The generalization error for forests converges to a limit as the number of trees in the forest becomes large. The performance for Indian News repository has given 99.4% TP and 0.2% FP and area under ROC curve is 100%.
Random Tree is a supervised Classifier; it is an ensemble learning algorithm that generates many individual learners. It employs a bagging idea to produce a random set of data for constructing a decision tree. In standard tree each node is split using the best split among all variables. This makes Random Tree to achieve high accuracy. Using Random Tree the performance for Indian News repository has given 100% TP and 0% FP and area under ROC curve is 100%. LAD is binary classifier and hence can distinguish between positive and negative samples. The basic assumption of LAD model is that a binary point covered by some positive patterns, but not covered by any negative pattern is positive, and similarly, a binary point covered by some negative patterns, but not covered by positive pattern is negative. So using LAD Tree the performance for Indian News repository has given 46.4% TP and 12.7% FP and area under ROC curve is 71.2%.
It can be seen from following Table III, V and Table VII.
TABLE II.
CONFUSION MATRIX FOR RANDOMFOREST
Classified as Education Business Criminal Technology Politics Medical Sports
Education
57
1
0
0
1
0
0
Business
0
123
0
0
0
0
Criminal
0
0
82
0
0
0
Technology
0
1
0
0
0
0
0
Politics
0
0
0
0
153
0
0
Medical
0
1
0
0
0
45
0
International Journal of Emerging Technology and Advanced Engineering
Website: www.ijetae.com (ISSN 2250-2459, ISO 9001:2008 Certified Journal, Volume 5, Issue 1, January 2015)
514
TABLE III.
TABLE SHOWING TRUE POSITIVE AND FALSE POSITIVE RATE OF RANDOMFOREST
Class
TP Rate
FP Rate
Precision
Recall
F-Measure
ROC Area
Education 96.6% 0% 1 0.966 0.983 100%
Business 100% 0.6% 0.976 1 0.988 100%
Criminal 100% 0% 1 1 1 100%
Technology 97.4% 0% 1 0.974 0.987 100%
Politics 100% 0.2% 0.994 1 0.997 100%
Medical 97.8% 0% 1 0.978 0.989 100%
Sports 100% 0% 1 1 1 100%
Weighted Avg. 99.4% 0.2% 0.994 0.994 0.994 100%
TABLE IV.
CONFUSION MATRIX FOR RANDOMTREE
Classified as Education Business Criminal Technology Politics Medical Sports
Education
59
0
0
0
0
0
0
Business
0
123
0
0
0
0
0
Criminal
0
0
82
0
0
0
0
Technology
0
0
0
39
0
0
0
Politics
0
0
0
0
153
0
0
Medical
0
0
0
0
0
46
0
International Journal of Emerging Technology and Advanced Engineering
Website: www.ijetae.com (ISSN 2250-2459, ISO 9001:2008 Certified Journal, Volume 5, Issue 1, January 2015)
515
TABLE V.
TABLE SHOWING TRUE POSITIVE AND FALSE POSITIVE RATE OF RANDOMTREE
Class
TP Rate
FP Rate
Precision
Recall
F-Measure
ROC Area
Education 100% 0% 1 1 1 100%
Business 100% 0% 1 1 1 100%
Criminal 100% 0% 1 1 1 100%
Technology 100% 0% 1 1 1 100%
Politics 100% 0% 1 1 1 100%
Medical 100% 0% 1 1 1 100%
Sports 100% 0% 1 1 1 100%
Weighted Avg. 100% 0% 1 1 1 100%
TABLE VI.
CONFUSION MATRIX FOR LADTREE
Classified as Education Business Criminal Technology Politics Medical Sports
Education 0 58 0 0 1 0 0
Business 0 123 0 0 0 0 0
Criminal 0 73 0 0 7 0 2
Technology 0 36 0 0 2 0 1
Politics 0 63 0 0 89 0 1
Medical 0 43 0 0 1 0 2
International Journal of Emerging Technology and Advanced Engineering
Website: www.ijetae.com (ISSN 2250-2459, ISO 9001:2008 Certified Journal, Volume 5, Issue 1, January 2015)
516
TABLE VII.
TABLE SHOWING TRUE POSITIVE AND FALSE POSITIVE RATE OF LADTREE
Class
TP Rate
FP Rate
Precision
Recall
F-Measure
ROC Area
Education 0% 0% 0 0 0 65.5%
Business 100% 62.9% 0.27 1 0.426 68.5%
Criminal 0% 0% 0 0 0 60.4%
Technology 0% 0% 0 0 0 61.7%
Politics 58.2% 2.2% 0.89 0.582 0.704 74.3%
Medical 0% 0% 0 0 0 62.8%
Sports 60.5% 1.2% 0.937 0.605 0.736 83.6%
Weighted Avg. 46.4% 12.7% 0.473 0.464 0.413 71.2%
A consolidated performance of the three algorithms used to process News data set can be seen below in Table VIII.
TABLE VIII.
SHOWING CORRECT AND WRONG PREDICTION OF CLASSIFIER.
Classifier
RandomForest
RandomTree
LADTree
News Category
Actual No. Of
News
Correct
Wrong
Correct
Wrong
Correct
Wrong
Education
59
57
02
57
00
00 59Business
123
123
00
123
00
123 00Criminal
82
82
00
82
00
00 82Technology
39
38
01
39
00
00 39Politics
153
153
00
153
00
89 64Medical
46
45
01
46
00
0 46Sports
147
147
00
147
00
89 58Total
649
645
04
649
00
301 348International Journal of Emerging Technology and Advanced Engineering
Website: www.ijetae.com (ISSN 2250-2459, ISO 9001:2008 Certified Journal, Volume 5, Issue 1, January 2015)
517
VI. CONCLUSIONS
As per the previous discussion identification of news from dynamic resources can be done with the propose model, we used three classifier i.e. RandomForest, RandomTree and LADTree to analyze the data sets. As a result it is found that RandomTree algorithm performs well in categorizing all the News. Overall Performance of RandomForest algorithm is acceptable, except 1,1 News from Education are classified into Bussiness & Politics, 1 Technology News is distributed into Bussiness, 1 News form Medical are classified into Bussiness and whereas LADTree algorithm works worst for all the category of News. For overall data set detection rate (True Positive rate) for RandomTree is 100%, RandomForest is 99.4% and whereas LADTree is 46.4%. Hence RandomTree is good classifier as compare to RandomForest and LADTreeclassifier. This also can be seen from Table III, Table V, Table VII and Table VIII above.
REFERENCES
[1] Ian H. Witten, Eibe Frank & Mark A. Hall., “Data Mining Practical Machine Learning Tools and Techniques, Third Edition.” Morgan Kaufmann Publishers is an imprint of Elsevier.
[2] http://en.wikipedia.org/wiki/Classification
[3] Tarannum A Bloch, Prof. V.B.Vaghela, Dr.K.H.Wandra, “Applied Taxonomy Techniques Intended for Strenuous Random Forest Robustness”, Int. J. Comp. Tech. Appl., Vol 2 (6), pp-2061-2065 [4] Sneh Lata Pundir, Amrita “FEATURE SELECTION USING
RANDOM FOREST IN INTRUSION DETECTION SYSTEM” International Journal of Advances in Engineering & Technology, July 2013, Vol. 6, Issue 3, pp. 1319-1324
[5] Anubha Dubey, Bhaskar Pant, Usha Chouhan, “Machine learning model for HIV1 and HIV2 enzyme secondary structure classification”, J. Comput. Method. Mol. Design, 2011, 1 (2): pp- 1-8
[6] en.wikipedia.org/wiki/Random_forest
[7] S. Syed Shajahaan, S. Shanthi, V. ManoChitra, “Application of Data Mining Techniques to Model Breast Cancer Data”, International Journal of Emerging Technology and Advanced Engineering, Volume 3, Issue 11, November 2013, pp- 362-369.
[8] Mr. Hiren Gadhvi, Ms. Madhu Shukla “Comparative Study of Classification Algorithms for Web Spam Detection”, International Journal of Engineering Research & Technology (IJERT), Vol. 2 Issue 12, December – 2013 pp- 2497-2501
[9] en.wikipedia.org/wiki/Random_tree
[10] Bernhard Pfahringer, “Random model trees: an e_ective and scalable regression method” University of Waikato, New Zealand, http://www.cs.waikato.ac.nz/~bernhard
[11] K. Wisaeng , “A Comparison of Different Classification Techniques for Bank Direct Marketing”, International Journal of Soft Computing and Engineering (IJSCE), Volume-3, Issue-4, September 2013, pp-116-119
[12] P.Yasodha, N.R. Ananthanarayanan, “Comparative Study of Diabetic Patient Data's Using Classification Algorithm in WEKA Tool” International Journal of Computer Applications Technology and Research, Volume 3, Issue 9, pp- 554 – 558
[13] Chirag Nathwani, Viralkumar Prajapati, Deven Agravat “Comparative Study of Web Spam Detection using Data Mining”, International Journal of Computer Applications (0975 – 8887), Volume 68, No.18, April 2013, pp- 26-29
[14] Chirag Nathwani, Viralkumar Prajapati, Deven Agravat “Comparative Study of Web Spam Detection using Data Mining”, International Journal of Computer Applications (0975 – 8887), Volume 68, No.18, April 2013, pp- 26-29
[15] Sushilkumar. R. Kalmegh, “Successful Assessment of Categorization of Indian News Using JRip and Nnge Algorithm”, International Journal of Emerging Technology and Advanced engineering, Volume 4, Issue 12, December 2014 pp- 395-402 [16] S.R. Kalmegh, S.N. Deshmukh, “Categorical Identification of Indian