International Journal of Emerging Technology and Advanced Engineering
Website: www.ijetae.com (ISSN 2250-2459, ISO 9001:2008 Certified Journal, Volume 7, Issue 6, June 2017)
413
Multilevel- UPQC for Power Quality Improvement in
Distribution System Integrated with PV System
B. Gopal
1, Pannala Krishnamurthy
2, G. N. Sreenivas
31Deptartment of EEE, KITS College, Khammam,Telangana, India
2Deptartment of EEE, SBIT College, Khammam, Telangana, India
3
Department of EEE, JNTUH, Hyderabad, Telangana, India
Abstract—Nowadays power consumption is increasing day by day due to world industrialization. To conserve fossil fuels for future generations distribution energy generations (DG) are the best alternative. Wind and PV plays a key role on renewable power generation. The power quality is the main constraint while feeding power to distribution loads. In this paper DG are used to feed power to Unified Power Quality Conditioner (UPQC) through a multi-level converter. The multilevel converter is used as shunt and series converters of UPQC, by using this converter the harmonic component presented in the output of the converter is redused compared to the conventional 2level converter output. Also reduces %THD presented on the fundamental value. Due to this the filter component requirement is less compared to conventional case. The inclusion of multilevel converters in UPQC can reduce the filtering requirement, power loss and reactive power consumed by the converter.
Keywords— Distributed Generation (DG), Multilevel converter, Power Quality (PQ), Unified power quality conditioner (UPQC), Total Harmonic Distortion (THD).
I. INTRODUCTION
Now a days power consumption is increasing due to world industrialization. This distribution load performance depends on the voltage profile of the supply. The growth in industrialization causes increased non-linear loads and unbalanced loads. And the growth in power electronic device utilization in drives and automation of industries leads to rise of power quality problems.[1], [2].
By rapid growth in power electronic devices utilization cause harmonic injection into source side and due to unbalanced load power imbalances and negative sequence component of the currents flowing through neutral point of the system. On the other hand due to frequent load switching voltage fluctuations are occur [3].
The major power quality issues due to extended power utilization, which leads to increased harmonic distortions, increment in reactive power consumption, drop in power factor, increased losses and voltage fluctuations like sag and swells [4].
To overcome these power quality issues some of the compensators are used, these are series and shunt compensators. The shunt compensators are used to compensate reactive power consumption, to reduce harmonic content injection to source and to reduce unbalance factor due to the sequence component of current flowing in neutral point. The series compensators can improve the voltage profile of supply voltage given to loads by compensating sag/swells [5], [6].
However, instead of using individual series and shunt compensators, utilization of Unified power quality conditioner (UPQC) is most economical and reliable. Due to these advantages utilization of UPQC is widely used in distribution networks to improve power quality of the system [7].
The UPQC includes series and shunt converters in the form of back to back connection. The shunt and series converters are designed with multilevel topologies. This leads to reduction of filtering requirement to filter out harmonic content injected by converters and reduction in reactive power consumption. Here diode clamped 5 level converters are used; the output of the converter is smoothen than a conventional 2level converter. This implies reduced filtering system and economical [8].
The series and shunt converters are share same DC link voltage to compensate power quality issues. The DC link shared by converters is fed with external power supply. Such as battery storage system, small conventional power generating station and another is with distributed generation (DG) [9].
International Journal of Emerging Technology and Advanced Engineering
Website: www.ijetae.com (ISSN 2250-2459, ISO 9001:2008 Certified Journal, Volume 7, Issue 6, June 2017)
414
Fig. 1 Basic configuration of the UPQC
II. PROPOSED UPQC-DGSYSTEM
A. Circuit Configuration
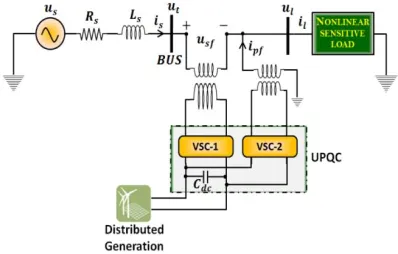
The single line representation of the proposed test system is as shown in fig. 2. The UPQC is connected in between source bus and distribution bus. The shunt compensator is connected in shunt with load to compensate harmonic content injected by load and to compensate reactive power consumed by the load. The series compensator is connected at source side to maintain a good voltage profile or for stable operation of supply voltage given to loads by mitigating sag/swell conditions in source voltage. Usf is the voltage injected by series controller and
Ipf is the current injected by shunt controller to improve
power quality of the system.
B. UPQC-DG Structure
[image:2.612.366.508.426.603.2]The internal structure of a UPQC-DG is shown in Fig. 2. It consists of two voltage source converters which are connected back to back through a common DC-link capacitor. In the proposed configuration, voltage source converter1 is connected in series with BUS and a voltage source converter2 is connected in parallel with load at the end of the feeder
[11]- [13].
Fig. 2 Simulated test system with multilevel converter
Here the renewable power generation is connected at the DC link to feed power to the UPQC. The power fed by DG is used to compensate power quality issues and increases reliability. The UPQC uses VSC based multilevel converters in series and shunt with load. The system efficiency can increased by using VSC due to its less mal operation, high stability and it can be used to facilitates to control active and reactive power individually.
C. Multilevel Converter design
Due to industry growth wide range of loads are involved in the utility. By using conventional converters for power conversions will effects the load variations due to its constant profile. The multilevel converters are giving variable operations based on load variations and it can produce smooth output than conventional converter, this will increase system performance. The diode clamped type of multilevel converters are used in this system as shown in fig.3.
In diode clamped multilevel inverters the diodes are used to provide multiple voltage levels. In this the capacitors are placed in series connection to share the voltage equally to provide equal voltage to each level. The diode is used to reduce the stress on controllable devices by transferring some amount of power through it
.
S1
S2
S3
S4
S5
S6
S7
S8 C1
C2
C3
C4
Fig. 3 5level diode clamped multilevel converter
[image:2.612.73.272.541.668.2]International Journal of Emerging Technology and Advanced Engineering
Website: www.ijetae.com (ISSN 2250-2459, ISO 9001:2008 Certified Journal, Volume 7, Issue 6, June 2017)
415 III. CONTROLLER DESIGNING
Basically UPQC controlling is divided into series and shunt control. And by involving DGs in UPQC source it can operate in two modes, one is grid connected and other island mode of operation.
In the grid connected mode of operation the load can draw power from the DGs and grid. Due to grid involvement they have increased capability to supply the power. In islanding mode of operation only DG can provide power supply to loads with limited capability.
A. Shunt controller
The shunt controller is used to control the output of shunt VSC to compensate harmonic content injected by load and reactive power consumed by the load. The harmonic content will reduce by injecting same harmonics in the opposite direction to load injection.
[image:3.612.65.277.409.548.2]It can measure the harmonic content injected by the load from the load current and power angle, then compared with a source component of angle measure from voltage and reference current. The measured deviation can inject to lines by maintaining shunt converter in synchronism with source. This can be shown in fig.4.
Fig. 4 Control block diagram of the shunt VSC
1.
Shunt VSC in Interconnected Mode:The measured load current ( ) is transformed into the synchronous dqo reference frame by using,
(1)
Where the transformation matrix is
(2)
By this transform, the fundamental positive-sequence component, which is transformed into DC quantities in the
d and q axes, can be easily extracted by low-pass filters (LPFs). Also, all harmonic components are transformed into ac quantity with a fundamental frequency shift
(3)
(4)
Where and are d-q components of load current,
and are dc components, and and are the ac
components of and [14]- [16].
If is is the feeder current and ipf is the shunt voltage
source converter current and knowing is = il -ipf , then d–q
components of the shunt voltage source converter reference current are defined as follows:
(5)
(6)
Consequently, the d–q components of the feeder current are
(7)
(8)
This means that there are no harmonic and reactive components in the feeder current. Switching losses cause the DC-link capacitor voltage to decrease. Other disturbances, such as the sudden variation of load, can also affect the DC link. In order to regulate the DC-link capacitor voltage, a proportional–integral (PI) controller is used as shown in Fig. 4. The input of the PI controller is the error between the actual capacitor voltage and its reference value The output of the PI controller is added to the component of the shunt-ML voltage source converter reference current to form a new reference current as follows:
International Journal of Emerging Technology and Advanced Engineering
Website: www.ijetae.com (ISSN 2250-2459, ISO 9001:2008 Certified Journal, Volume 7, Issue 6, June 2017)
416 The UPQC-PV System operation with interconnected mode is shown in Fig. 5.
[image:4.612.338.546.133.245.2](10)
[image:4.612.60.267.162.316.2]Fig. 5 UPQC-DG System operation with interconnected mode
Fig. 6 UPQC-DG System operation with islanding mode
2. Shunt VSC in islanding mode:
In this case the controller will adjust the power output of shunt controller to equal with load power ratings based on DG capability. The shunt inverter during voltage interruption and islanding mode are explained in [17]-[19]. The UPQC-DG System operation with Islanding mode is shown in Fig. 6.
B. Series VSC
[image:4.612.69.267.339.463.2]The series controller is used to control the voltage injected by series VSC in series with supply to maintain a constant voltage profile. The series controllers can measure voltage fluctuations by measuring source voltage. It will compensate the fluctuations by comparing the measured voltage with reference value and the deviation can inject by series VSC into supply mains.
Fig. 7 Control block diagram of the series VSC
The control block diagram of series voltage source converter is shown in Fig. 7. The bus voltage ( ) is
detected and then transformed into the synchronous dq0 reference frame using
(11)
Where
(12)
, and are fundamental frequency positive,
negative, and zero sequence components, respectively, and
uth is the harmonic component of the bus voltage.
According to control objectives of the UPQC, the load voltage should be kept sinusoidal with constant amplitude even if the bus voltage is disturbed. Therefore, the expected load voltage in the synchronous dqo reference frame ( ) only has one value.
(13)
Where the load voltage in the abc reference frame
( ) is
International Journal of Emerging Technology and Advanced Engineering
Website: www.ijetae.com (ISSN 2250-2459, ISO 9001:2008 Certified Journal, Volume 7, Issue 6, June 2017)
417 The compensating reference voltage in the synchronous dqo reference frame ( ) is defined as
(15)
IV. SYSTEM RESULTS ANALYSIS
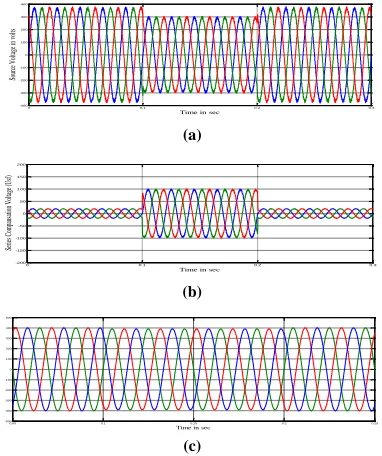
The UPQC-DG system performance is tested in three cases; they are during sag occurred in supply voltage, during fault occurred on the source side and dynamic load conditions. The UPQC can reduces the %THD injected by load from 18.64% to 3.72%.
0 0.1 0.2 0.3
-400 -300 -200 -100 0 100 200 300 400
Time in sec
So urce V ol tag e i n vo lts (a)
0 0.1 0.2 0.3
-200 -150 -100 -50 0 50 100 150 200
Time in sec
Seri es Co mp an sat io n Vo ltag e (U sf) (b)
0.05 0.1 0.15 0.2 0.25
-500 -400 -300 -200 -100 0 100 200 300 400 500
Time in sec
[image:5.612.72.263.278.506.2]PCC/ lo ad v ol tag e (c)
Fig. 8 system compensation during sag (a) sag in supply voltage (b) UPQC injected voltage (c) Compensated load voltage
A. During Sag in Supply Voltage
The sag will occurred in supply voltage from 0.1sec to 0.2sec. The voltage is reduced from 380V L-L to 300V is as shown in fig.8.a. The drooped voltage can injected by UPQC is as shown in fig.8.b. Fig.8.c shows voltage given to load after compensation.
B. Upstream Fault on Feeder
When three phase to ground fault is occurred at supply/grid side of the system. It will reduces the supply voltage drastically is as shown in fig.9.a. The fault is applied from 0.6sec to 0.7sec and in this case UPQC injects voltage to supply voltage by maintaining in phase with supply is shown in fig.9.b and it can perform the injection when the load power rating is capable to fed DG. FIG.9.c shows the voltage given to load after voltage injection.
0.5 06 0.7 0.8
-400 -300 -200 -100 0 100 200 300 400
Time in sec
So urce vo ltag e d uri ng fau lt (U t) (a)
0.5 0.6 0.7 0.8
-500 -400 -300 -200 -100 0 100 200 300 400 500
Time in sec
Seri es co mp en sat ion vo ltag e (U sf) (b)
0.45 0.5 0.55 0.6 0.65
-500 -400 -300 -200 -100 0 100 200 300 400 500
Time in sec
[image:5.612.337.547.491.694.2]PCC/ lo ad v ol tag e (c)
Fig. 9 System performance during three phase to ground fault (a) supply voltage (b) UPQC injected voltage (c) Compensated load
voltage
C. Load Change
The variable load is applied in the system. The load is changes at 0.5sec is as shown in fig.10. The load current drawn during load change is shown in fig.10.a. Supply current after compensation in fig.10.b. The %THD is reduced from 37.99% to 1.98%. The system parameters are shown in Table. I.
0.4 0.5 0.6
-80 -60 -40 -20 0 20 40 60 80
Time in sec
Lo ad cu rren t (Il ) (a)
0.4 0.42 0.44 0.46 0.48 0.5 0.52 0.54 0.56 0.58 0.6 -80 -60 -40 -20 0 20 40 60 80
Time in sec
So urce cu rren t (b)
0.4 0.42 0.44 0.46 0.48 0.5 0.52 0.54 0.56 0.58 0.6 -500 -400 -300 -200 -100 0 100 200 300 400 500
Time in sec
International Journal of Emerging Technology and Advanced Engineering
Website: www.ijetae.com (ISSN 2250-2459, ISO 9001:2008 Certified Journal, Volume 7, Issue 6, June 2017)
418
0.4 0.5 0.6
-15 -10 -5 0 5 10 15
Time in sec
Cu
rren
t in
ject
ion
(Is
f)
(d)
0 0.1 0.2 0.3 0.4 0.5 0.6 0.7 0.8 0.9 1
-50 0 50
Selected signal: 50 cycles. FFT window (in red): 1 cycles
Time (s)
0 100 200 300 400 500 600 700 800 900 1000 0
0.5 1 1.5 2
Frequency (Hz)
Fundamental (50Hz) = 37.99 , THD= 1.98%
M
ag
(
%
o
f
F
un
da
m
en
ta
l)
[image:6.612.62.278.113.320.2](e)
Fig. 10 System response during load change (a) Load current (b) Source current (c) Supply voltage and (d) Current injection (Isf) (e)
FFT analysis for source current.
TABLEI
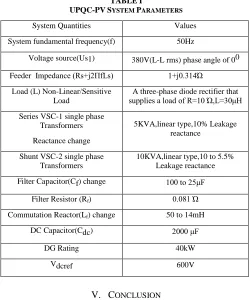
UPQC-PVSYSTEM PARAMETERS
System Quantities Values
System fundamental frequency(f) 50Hz
Voltage source(Us1) 380V(L-L rms) phase angle of 00
Feeder Impedance (Rs+j2ΠfLs) 1+j0.314Ώ
Load (L) Non-Linear/Sensitive Load
A three-phase diode rectifier that supplies a load of R=10 Ώ,L=30μH
Series VSC-1 single phase Transformers
Reactance change
5KVA,linear type,10% Leakage reactance
Shunt VSC-2 single phase Transformers
10KVA,linear type,10 to 5.5% Leakage reactance
Filter Capacitor(Cf) change 100 to 25μF
Filter Resistor (Rf) 0.081 Ώ
Commutation Reactor(Lf) change 50 to 14mH
DC Capacitor(Cdc) 2000 μF
DG Rating 40kW
Vdcref 600V
V. CONCLUSION
The power quality of the distribution network can be improved by including the UPQC in distribution network is analyzed. The total harmonic distortion was reduced from 37.99% to 1.98%.
The sag/swell compensation is performed in the system. By introducing multilevel converters in VSC topology reduces filter requirement, leakage reactance and voltage stress across the switches as shown in table. I. Also improves the system reliability.
REFERENCES
[1] H. K. Al-Hadidi, A. M. Gole, and D. A. Jacobson, ―Minimum power operation of cascade inverter-based dynamic voltage restorer,‖ IEEE Trans. Power Del., vol. 23, no. 2, pp. 889–898, Apr. 2008.
[2] J. H. R. Enslin and P. J. M. Heskes, ―Harmonic interaction between a large number of distributed power inverters and the distribution network,‖ IEEE Trans. Power Electron., vol. 19, no. 6, pp. 1586– 1593, Nov. 2004.
[3] D. D. Sabin and A. Sundaram, ―Quality enhances reliability,‖ IEEE Spectr., vol. 33, no. 2, pp. 34–41, Feb. 1996.
[4] F. Z. Peng and J. S. Lai, ―A multilevel voltage-source converter with separate DC source for static var generation,‖ IEEE Trans. Ind. Appl.,vol. 32, no. 5, pp. 1130–1138, Sep./Oct. 1996.
[5] A.Ghosh and G. Ledwich, ―A unified power quality conditioner (UPQC) for simultaneous voltage and current compensation,‖ Elect. Power Syst. Res., pp. 55–63, 2001.
[6] B.Gopal, P.Krishna Murthy and G.N.Sreenivas, ―Power Quality
Improvement using 24 pulse Bridge Rectifier for an Isolated Power Generation‖ International Journal of Advanced and Innovative Research (IJAIR) , Volume 1, Issue 3, August 2012,pp.32-38.
[7] F.Blaabjerg, R.Teodorescu, M. Liserre, and A. V. Timbus, ―Overview of control and grid synchronization for distributed power generation systems,‖ IEEE Trans. Ind. Electron., vol. 53, no. 5, pp. 1398–1409, Oct. 2006.
[8] H. K. Al-Hadidi, A. M. Gole, and D. A. Jacobson, ―Minimum power operation of cascade inverter-based dynamic voltage restorer,‖ IEEE Trans. Power Del., vol. 23, no. 2, pp. 889–898, Apr. 2008.
[9] B Han, B Bae, H Kim, S Baek, ―Combined Operation of Unified Power Quality Conditioner with Distributed Generation‖, IEEE Trans Power Delivery, vol. 21(1), 2006, pp. 330 – 338.
[10] B.Gopal, P.Krishna Murthy and G.N.Sreenivas, ―A Review on UPQC for Power Quality Improvement in Distribution System‖ Global Journal of Researches in Engineering (GJRE-F) , Volume 13, Issue 7,Version 1.0, July- 2013,pp.49-57.
[11] V. Khadkikar, A. Chandra, A. O. Barry, and T. D. Nguyen, ―Application of UPQC to protect a sensitive load on a polluted distribution network,‖ in Proc. Annu. Conf. IEEE Power Eng. Soc. Gen. Meeting 2006, pp. 867–872.
[12] B.Gopal, K.K.Vasishta Kumar and Ch.Ramulu, ―Performance of
MC- UPQC in unbalanced source voltage and voltage sag/swell migration conditions‖ ACEEE Trans. in International Journal on Recent Trends in Engineering & Technology (IJRTET), Vol. 05, No. 02, Mar, 2011,pp.157-159.
[13] V. Khadkikar, A. Chandra, A. Barry, and T. Nguyen, ―Conceptual Study of unified power quality conditioner (UPQC),‖ in Proc. IEEE In Symp Ind. Electron., Jul. 9–13,2006, pp. 1088–1093
[image:6.612.42.292.366.666.2]International Journal of Emerging Technology and Advanced Engineering
Website: www.ijetae.com (ISSN 2250-2459, ISO 9001:2008 Certified Journal, Volume 7, Issue 6, June 2017)
419 [15] P. Krishna Murthy, J.Amarnath, S.Kamakshaiah and B.P.Singh
―Wavelet Transform approach for Detection and Location of Faults in HVDC System,‖ IEEE Region 10 colloquium and the third ICIIS, Kharagpur,India,Dec.8-10,2008,pp.1-6.
[16] M. Hu and H. Chen, ―Modeling and controlling of unified power quality compensator,‖ in Proc. 5th Int. Conf. Advances in Power System Control, Operation and Management, Hong Kong, China, 2000, pp. 431–435.
[17] G. L. Campen, ―An analysis of the harmonics and power factor effects at a utility inter tied photovoltaic system,‖ IEEE Trans. Power App.Syst., vol. PAS 101, no. 12, pp. 4632–4639, Dec. 1982. [18] N. Srisaen and A. Sangswang, ―Effect of PV grid-connected system
location on a distribution system,‖ in Proc. IEEE Asia Pacific Conf. Circuit and Systems, Dec. 2006, pp. 852–855.