Original Research Article
A cross sectional study of lipid profile in stroke patients
Nirmala A. C.
1, Hrishikesh S.
2*
INTRODUCTION
As per World Health Organization , Stroke is defined as a clinical syndrome consisting of 'rapidly developing clinical signs of focal (at times global) disturbance of cerebral function, with duration lasting more than 24 hours or leading to death with no apparent cause other than that of vascular origin'.1 Ischemic stroke is the third
leading cause of death and also leading cause of hospitalization leading to disability. Acute Ischemic
stroke has more chances for rapid recovery and good outcome.2
Approximately 10% of strokes are caused by ICH.3-5
Populations with high prevalence of hypertension such as Asians and African Americans have a higher incidence of ICH. ICH affects a wide age range, with many examples in the seventh, eighth, and ninth decades of life. Higher percentage of strokes in patients younger than 40 years are hemorrhagic, and ICH is also common during the later years of life. Elevated low-density lipoprotein
1Department of Medicine, 2Department of Internal Medicine, Bangalore Medical College and Research Institute,
Bangalore, Karnataka, India
Received: 03 January 2020
Revised: 10 January 2020
Accepted: 15 February 2020
*Correspondence:
Dr. Hrishikesh S.,
E-mail: [email protected]
Copyright: © the author(s), publisher and licensee Medip Academy. This is an open-access article distributed under the terms of the Creative Commons Attribution Non-Commercial License, which permits unrestricted non-commercial use, distribution, and reproduction in any medium, provided the original work is properly cited.
ABSTRACT
Background: Atherosclerosis affects multiple vascular beds, accounting for nearly all of coronary heart disease and some proportion of ischemic strokes. Serum lipid levels have an effect on the short-term mortality due to strokes. But in some studies, there was no dyslipidemia in patients who presented with acute stroke. It is important to evaluate the serum lipid levels in both the types of strokes to guide lipid lowering therapy which can reduce incidence of stroke and related mortality. This study is undertaken to evaluate the role of serum lipids in patients of stroke in our centre. Methods: It is a cross sectional study, conducted on 176 patients of stroke, who were assessed by NIHSS stroke scale clinically. Serum lipid profile was measured in all patients. Data was entered in Microsoft Excel and analysed by descriptive statistics. Chi Square test was used for association of qualitative variables. A p value<0.05 was considered statistically significant.
Results: In this study conducted on 176 patients, LDL values were deranged more in CVA-bleed group compared to CVA-infarct group. BMI was the best anthropometric measure that correlated with LDL. LDL was also the most common parameter that was deranged in nonsmokers (61.8%) whereas in smokers, total cholesterol (66.3%) was most commonly deranged. Triglyceride and VLDL values were deranged more commonly in diabetic group than in non-diabetic group. A total of 123 out of 145patinets with CVA- infarct, had deranged lipid profile and among patients with CVA- bleed 24 out of 32 had deranged lipid profile.
Conclusions: Results of this study shows significant derangement in lipid profile especially in LDL cholesterol levels in both infarct and bleed group, therefore starting statin therapy would prove to be beneficial in preventing recurrence of stroke.
Keywords: Atherosclerosis, Body mass index, Lipid profile, Statin, Stroke
cholesterol (LDL-C) is a risk factor for coronary artery disease, and high levels of high-density lipoprotein cholesterol (HDL-C) are protective.6-10 The Third Report
of the National Cholesterol Education Program Adult Treatment Panel recommended that an HDL-C level less than40 mg/dL be considered a risk factor for ischemic heart disease.11 The role of lipids as risk factors for
ischemic stroke has been less consistently observed
Aims and objectives of the study was to study lipid profile of patients with acute ischemic and hemorrhagic stroke and to compare the lipid profiles of ischemic and hemorrhagic stroke patients.
METHODS
This cross sectional study was conducted in hospitals attached to BMCRI, between April 2018 to July 2019. The study protocol was approved by the hospital ethical committee.
Inclusion criteria
• All patients with new onset ischemic and hemorrhagic stroke, confirmed by CT and presented within 24 hours of onset of stroke were taken into study.
• Acute ischemic and hemorrhagic stroke patients who were willing for examination after signing the informed consent.
Exclusion criteria
Acute ischemic and hemorrhagic stroke patients not willing for examination or for giving informed consent.
Serum lipid profile levels of all patients were measured on the day of admission. Detailed history, physical examination and necessary investigations were undertaken.
Statistical analysis
The quantitative variables were expressed as mean± SD, while categorical variables were expressed in percentage. Mann Whitney test was used for non-parametric data. The p value <0.05 was considered as statistically significant.
RESULTS
In present study 176 patients were enrolled. The age distribution of the subjects was between 19 to 92 yrs with mean age of patients in infarct group being 63.90±12.75 yrs and bleed group being 59.16±15.21. Among the infarct group 49 were females and 96 were males and among the bleed group 14 were females and 18 were males.
Analysis of lipid profile among both the group revealed that the most common value deranged in the infarct group is increased LDL which is deranged in 58.6 % of patients and the second most common value deranged being increased total cholesterol which was deranged in 57.2 %. Among the bleed group the most common deranged value was increased LDL which was deranged in 78.1 % of patients and the second most common deranged value being increased total cholesterol which was deranged in 56.3% of patients (Figure 1).
Correlation of anthropometric measures with lipid profile showed that according to this study BMI of patients correlated best with LDL cholesterol and Total cholesterol (Table 1).
X axis -percentage of subjects
Y axis -lipid profile parameters (normal and deranged) with blue representing infarct and red representing bleed.
Figure 1:Distribution of the subjects based on lipid profile. 57.2
42.8
24.1
75.9
58.6
41.4
25.5
74.5
24.8
75.2
56.3
43.8
34.4
65.6
78.1
21.9 25
75
37.5
62.5
0 10 20 30 40 50 60 70 80 90
Deranged Normal Deranged Normal Deranged Normal Deranged Normal Deranged Normal
T. Cholestrol HDL LDL VLDL Triglycrides
P
er
ce
nta
g
e
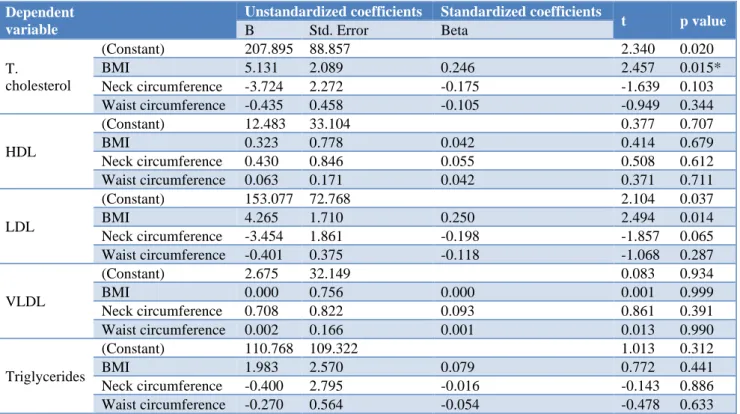
Neck circumference BMI and waist circumference were plotted against lipid profile parameters to find out which parameter best correlated with anthropometric measures. Analysis of correlation of lipid profile values with anthropometry showed that BMI of patients correlated best with LDL cholesterol and Total cholesterol. Waist circumference correlated best with LDL and Total cholesterol and that of Neck circumference with LDL.
BMI is the best anthropometric measurement that correlated with LDL values and was statistically significant. Multiple linear regression was done with lipid profile values against BMI, Neck circumference and Waist circumference to assess which was the best parameter that could predict most accurately, the variations in the lipid profile values. The anthropometric value which best predicted the variation in lipid profile parameter used to start statin therapy (LDL) was found to be BMI.
Waist circumference correlated best with LDL and total cholesterol and that of neck circumference with LDL (Table 1).
Table 1:Correlation between neck, waist circumference, BMI and lipid profile.
r value p value
Neck
circumference
T cholesterol 0.013 0.86
HDL -0.017 0.82
LDL -0.112 0.13
VLDL -0.029 0.70
Triglycerides -0.027 0.72
Waist
circumference
T cholesterol 0.07 0.31
HDL 0.03 0.68
LDL 0.07 0.31
VLDL -0.04 0.55
Triglycerides -0.016 0.83
BMI
T cholesterol 0.15 0.03*
HDL 0.07 0.32
LDL 0.14 0.04*
VLDL 0.02 0.72
Triglycerides 0.05 0.47
Table 2:Multiple linear regression analysis of anthropomety and lipid profile.
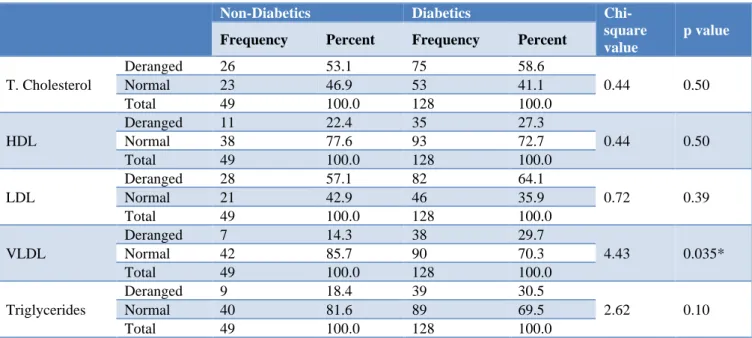
Non-Diabetics Diabetics
Chi-square value
p value
Frequency Percent Frequency Percent
T. Cholesterol
Deranged 26 53.1 75 58.6
0.44 0.50
Normal 23 46.9 53 41.1
Total 49 100.0 128 100.0
HDL
Deranged 11 22.4 35 27.3
0.44 0.50
Normal 38 77.6 93 72.7
Total 49 100.0 128 100.0
LDL
Deranged 28 57.1 82 64.1
0.72 0.39
Normal 21 42.9 46 35.9
Total 49 100.0 128 100.0
VLDL
Deranged 7 14.3 38 29.7
4.43 0.035*
Normal 42 85.7 90 70.3
Total 49 100.0 128 100.0
Triglycerides
Deranged 9 18.4 39 30.5
2.62 0.10
Normal 40 81.6 89 69.5
Total 49 100.0 128 100.0
The most common deranged lipid profile value in non-diabetic group and non-diabetic group was increased LDL followed by total cholesterol (as shown in table 3)VLDL values were more deranged in the Diabetic group (29.7%) then in non-diabetic group (14.3%) and was statistically significant (Table 2).
Lipid profile derangement in smoker’s vs nonsmokers was compared and showed that the most common parameter that was deranged in nonsmokers was LDL (61.8%) and that of smokers were total cholesterol (66.3%) (Figure 2).
BMI is the best measurement that correlated with increased LDL values and as per multiple linear regression it can be used as an indirect measure to estimate the LDL levels (Table 3).
parameter which could predict variations in total cholesterol (Table 3).
Data from the study was also used to analyze the parameters of lipid profile deranged in smokers and nonsmokers , most common parameter that was deranged
in non-smokers was increased LDL (61.8%) and that of smokers were increased total cholesterol (66.3%) (Figure 2).
Table 3: Multiple linear progression depicting relation between lipid profile and anthropometric measurements.
Dependent variable
Unstandardized coefficients Standardized coefficients
t p value
B Std. Error Beta
T.
cholesterol
(Constant) 207.895 88.857 2.340 0.020
BMI 5.131 2.089 0.246 2.457 0.015*
Neck circumference -3.724 2.272 -0.175 -1.639 0.103
Waist circumference -0.435 0.458 -0.105 -0.949 0.344
HDL
(Constant) 12.483 33.104 0.377 0.707
BMI 0.323 0.778 0.042 0.414 0.679
Neck circumference 0.430 0.846 0.055 0.508 0.612
Waist circumference 0.063 0.171 0.042 0.371 0.711
LDL
(Constant) 153.077 72.768 2.104 0.037
BMI 4.265 1.710 0.250 2.494 0.014
Neck circumference -3.454 1.861 -0.198 -1.857 0.065
Waist circumference -0.401 0.375 -0.118 -1.068 0.287
VLDL
(Constant) 2.675 32.149 0.083 0.934
BMI 0.000 0.756 0.000 0.001 0.999
Neck circumference 0.708 0.822 0.093 0.861 0.391
Waist circumference 0.002 0.166 0.001 0.013 0.990
Triglycerides
(Constant) 110.768 109.322 1.013 0.312
BMI 1.983 2.570 0.079 0.772 0.441
Neck circumference -0.400 2.795 -0.016 -0.143 0.886
Waist circumference -0.270 0.564 -0.054 -0.478 0.633
X axis -percentage of subjects
Y axis -lipid profile parameters (normal and deranged) with blue representing non-smokers and red representing smokers. Figure 2: Distribution of subjects (smokers and non smokers) based on lipid profile. 44.7
55.3
27.6
72.4
61.8
38.2 36.8
63.2
40.8
59.2 66.3
33.7
24.8
75.2
62.4
37.6
16.8
83.2
16.8
83.2
0 10 20 30 40 50 60 70 80 90
Deranged Normal Deranged Normal Deranged Normal Deranged Normal Deranged Normal
T. Cholestrol HDL LDL VLDL Triglycrides
Per
centa
g
e
Analysis of subjects belonging to diabetic and non-diabetic group revealed that 85.9% of patients in non-diabetic group had derangement in lipid profile and 73.46 % of patients in non-diabetic group had derangement in lipid profile. The most common deranged lipid profile value in non-diabetic group being increased LDL (57.1%) second most common value being increased total cholesterol (53.1%), in diabetic group the most common deranged value is increased LDL (64.4%) second most common value being increased total cholesterol (58.6%) and third being increased triglycerides (30.5%). HDL values were decreased in 22.4% of non-diabetes patients and 27.3% in Diabetes patients. VLDL values being more deranged in the Diabetic group (29.7%) then in non diabetic group (14.3%) (Table 2).
Triglyceride and VLDL values were deranged (increased) more commonly in diabetic group than in non-diabetic group (Table 2).
Among infarct group 123 out of 145 had deranged profile and among bleed group 24 out of 32 had deranged lipid profile, 31 patients in total had normal lipid profile.
DISCUSSION
LDL cholesterol which is implicated in the formation of cholesterol plaques leading to stroke was found to be the most common deranged value in this study indicating the need to start statin therapy, to prevent further recurrence.
In diabetes many factors affect blood lipid levels, because of the relationship between carbohydrates and lipid metabolism. The disorder in carbohydrate metabolism leads to disorder in lipid metabolism and vice versa. Insulin resistance is the primary defect in patients with type 2 diabetes mellitus. Insulin has an effect on the apolipoprotein production by liver and also regulates the enzymatic activity of lipoprotein lipase and cholesterol ester transport proteins, which causes dyslipidemia in patients of diabetes mellitus, which are shown in some studies. Insulin deficiency reduces the activity of hepatic lipase and several steps in the production of biologically active lipoprotein lipase.12-14 Individuals with diabetes
have Hypertriglyceridemia with decreased HDL cholesterol which is a prominent feature.15,16 The cluster
of lipid abnormalities associated with type 2 diabetes is defined by a high concentration of Triglycerides and small dense LDL and a low concentration of HDL cholesterol. Hypertriglyceridemia is the product of increased hepatic secretion of VLDL and delay in clearance of triglyceride rich lipoproteins, which is due to increased levels of free fatty acids and glucose required for triglyceride production.17
Cigarette smoking causes absorption of nicotine into the body which leads to lipolysis and release of free fatty acids into the blood stream via activation of adenyl cyclase in adipose tissue by nicotine stimulated secretion of catecholamines. These increased free fatty acids in
liver give rise to increased hepatic Triglyceride and VLDL synthesis, thus increasing the concentration of Triglyceride and VLDL-C in blood.18
Comparison with other studies
Deepa Singh conducted study on 300 subjects who were chronic smokers were evaluated at Arth Diagnostic Private Limited, Udaipur and found that In chronic smokers there was increase in serum Cholesterol with an increase in LDL-Cholesterol and decrease in HDL cholesterol.18 In this study it was found that most
common parameter that was deranged in non smokers was increased LDL (61.8%) and that of smokers were increased total cholesterol (66.3%).
Dr. Joshua Z et al, conducted a population based prospective cohort study on 3298 participants in the Northern Manhattan Study between the year 1993 and 2001 and follow up of these patients showed that baseline high-density lipoprotein cholesterol, triglyceride, and total cholesterol levels were not associated with risk of ischemic stroke. Low-density lipoprotein cholesterol (LDL-C) and non–high-density lipoprotein cholesterol levels were associated with a paradoxical reduction in risk of stroke.19
This cross sectional study of 176 patients of ischemic and hemorrhagic stroke patients showed that among infarct group 123 out of 145 had deranged profile and among bleed group 24 out of 32 had deranged lipid profile. Analysis of lipid profile among both the group revealed that the most common value deranged in the infarct group is increased LDL which is deranged in 58.6% of patients and the second most common value deranged being increased total cholesterol which was deranged in 57.2%.
Among the bleed group the most common deranged value was increased LDL which was deranged in 78.1% of patients and the second most common deranged value being increased total cholesterol which was deranged in 56.3% of patients. HDL values were decreased in 22.4% of non diabetes patients and 27.3% in Diabetes patients.
Eyal Shahar, Lloyd E Chambless, Wayne D Rosamond et al, enrolled 14,175 people in a large population based cohort study between 1987 and 1989 and found inconsistent associations between ischemic stroke and each of the 5 lipid factors.20 A significant correlation was
shown between ischemic and hemorrhagic stroke with increased LDL cholesterol and total cholesterol.
Ghanekar J et al, conducted study on 50 smoker and 50 nonsmoker males at MGM Medical College and Hospital, Navi Mumbai, Maharashtra, India, over a period of one and half year found out that There was increase in the values of total cholesterol, triglycerides and LDL-C in smokers.21 In this study it was found that total cholesterol
Aclan Ozder conducted a study on 132 patients with T2DM who were admitted to outpatient clinic of Family Medicine department in a university hospital. The study was conducted from January 2014 to June 2014. It was found that Significantly higher mean serum levels of TC, TG and LDL and significantly lower mean serum levels of HDL were noted in patients with diabetes.22 The most
common deranged lipid profile value in non-diabetic group being increased LDL (57.1%) second most common value being increased total cholesterol (53.1%), in diabetic group the most common deranged value is increased LDL (64.4%) second most common value being increased total cholesterol (58.6%) and third being increased triglycerides (30.5%). HDL values were decreased in 22.4% of non diabetes patients and 27.3% in Diabetes patients.
Magna Manjareeka et al, conducted a study on 1187 participants who were subjected to anthropometric measurements such as height, weight, waist circumference (WC), and hip circumference and serum lipid profile of these participants were measured. They found out that there is a weak correlation between body mass index (BMI) and lipid parameters. Among all the anthropometric variables studied, WC is best correlated to lipid parameters.23 It was found out that BMI is the
best measurement that correlated with increased LDL values.
The limitations of this study are that it is a cross sectional observational study, of a small sample size. Thus, a relatively larger case control study would be required to ascertain the findings of the present study. Patients, current weight could not be assessed accurately due to physical limitations, hence was assessed based on most recent measurements.
CONCLUSION
This study conducted on 176 patients ,LDL values were deranged more in hemorrhagic group compared to infarct group, BMI was the best anthropometric measure that correlated with LDL, The most common parameter that was deranged in non smokers was LDL (61.8%) and that of smokers was total cholesterol (66.3%). Triglyceride and VLDL values were deranged more commonly in diabetic group than in non diabetic group According to AHA guidelines for starting statin therapy total number of patients who were started on statin therapy was 108 patients.
ACKNOWLEDGEMENTS
Authors would like to thank Dr. KG Nirmala AC, Professor, Department of Medicine, Bangalore Medical College and Research Institute, Bangalore, for his persistent encouragement. Authors would also like to thank Dr. Ravi Professor and Head of Department of General Medicine, Bangalore Medical College and
Research Institute, for his profound enthusiasm and keen supervision of this work
Funding: No funding sources Conflict of interest: None declared
Ethical approval: The study was approved by the Institutional Ethics Committee
REFERENCES
1. World Health Organization. The world health report 2002: reducing risks, promoting healthy life. World Health Organization; 2002.
2. Egovindarajulu K, Maaran AT, Prathiba P, Saiprashanth PR. A study on Prognostic Significance of Serum Ferritin in Patients with Acute Ischemic Stroke. IOSR J Dent Med Sci. 2016Oct;15(10):31-9.
3. Kunitz SC, Gross CR, Heyman A, Kase CS, Mohr JP, Price TR, et al. The pilot Stroke Data Bank: definition, design, and data. Stroke. 1984 Jul;15(4):740-6.
4. Caplan LR, Hier DB, D'Cruz I. Cerebral embolism in the Michael Reese stroke registry. Stroke. 1983 Jul;14(4):530-6.
5. Mohr JP, Caplan LR, Melski JW, Goldstein RJ, Duncan GW, Kistler JP, et al. The Harvard cooperative stroke registry: a prospective registry. Neurology. 1978 Aug 1;28(8):754-62.
6. Ballantyne CM, Herd JA, Ferlic LL, Dunn JK, Farmer JA, Jones PH, et al. Influence of low HDL on progression of coronary artery disease and response to fluvastatin therapy. Circulation. 1999 Feb 16;99(6):736-43.
7. Gordon DJ, Probstfield JL, Garrison RJ, Neaton JD, Castelli WP, Knoke JD, et al. High-density lipoprotein cholesterol and cardiovascular disease. Four prospective American studies. Circulation. 1989 Jan;79(1):8-15.
8. Miller GJ, Miller NE. Plasma-high-density-lipoprotein concentration and development of ischaemic heart-disease. Lancet. 1975 Jan 4;305(7897):16-9.
9. Stampfer MJ, Sacks FM, Salvini S, Willett WC, Hennekens CH. A prospective study of cholesterol, apolipoproteins, and the risk of myocardial infarction. N Engl J Med. 1991 Aug 8;325(6):373-81.
10. Yaari S, Even-Zohar S, Goldbourt U, Neufeld H. Associations of serum high density lipoprotein and total cholesterol with total, cardiovascular, and cancer mortality in a 7-year prospective study of 10 000 men. Lancet. 1981 May 9;317(8228):1011-5. 11. National Cholesterol Education Program (US).
Institutes of Health; 2002. JAMA. 2002;285(19):2486-97.
12. Elnasri HA, Ahmed AM. Patterns of lipid changes among type 2 diabetes patients in Sudan. EMHJ-East Mediter Health J. 14 (2):314-24.
13. Mooradian AD. Dyslipidemia in type 2 diabetes mellitus. Nature Rev Endocrinol. 2009 Mar;5(3):150-9.
14. Smith S, Lall AM. A Study on lipid profile levels of diabetics and non-diabetics among Naini region of Allahabad, India. Turk J Biochem. 2008;33(4):138-41. 15. Howard BV. Lipoprotein metabolism in diabetes
mellitus. J Lipid Res. 1987;28(6):613-28.
16. Taskinen MR, Kahri J, Koivisto V, Shepherd J, Packard J. Metabolism of HDL apolipoprotein A-I and A-II in type 1 (insulin-dependent) diabetes mellitus. Diabetol. 1992;35(4):347-56.
17. Goldberg IJ. Lipoprotein lipase and lipolysis: central roles in lipoprotein metabolism and atherogenesis. J Lipid Res. 1996;37(4):693-707. 18. Singh D. Effect of cigarette smoking on serum lipid
profile in male population of Udaipur (Rajasthan). Int J Clin Biochem Res. 2016;3(4):368-70.
19. Willey JZ, Xu Q, Boden-Albala B, Paik MC, Moon YP, Sacco RL, et al. Lipid profile components and
risk of ischemic stroke: the Northern Manhattan Study (NOMAS). Arch Neurol. 2009 Nov 9;66(11):1400-6.
20. Shahar E, Chambless LE, Rosamond WD, Boland LL, Ballantyne CM, McGovern PG, Sharrett AR. Plasma lipid profile and incident ischemic stroke: the Atherosclerosis Risk in Communities (ARIC) study. Stroke. 2003 Mar 1;34(3):623-31.
21. Shenoi AS, Kadam V, Ghanekar J. Effect of smoking on serum lipid levels: а hospital-based study. MGM J Med Sci. 2015;2(1):13-5.
22. Ozder A. Lipid profile abnormalities seen in T2DM patients in primary healthcare in Turkey: a cross-sectional study. Lipids Health Dis. 2014;13(1). 23. Manjareeka M, Nanda S, Mishra J. Correlation
between anthropometry and lipid profile in healthy subjects of Eastern India. J Mid-life Health. 2015;6(4):164.