R E S E A R C H
Open Access
Cerebrospinal fluid lactate concentration to
distinguish bacterial from aseptic meningitis:
a systemic review and meta-analysis
Nguyen T Huy
1, Nguyen TH Thao
2, Doan TN Diep
2,3, Mihoko Kikuchi
1,4, Javier Zamora
5, Kenji Hirayama
1,4,6*Abstract
Introduction:Making a differential diagnosis between bacterial meningitis and aseptic meningitis is a critical clinical problem. The utility of a cerebrospinal fluid (CSF) lactate assay for this purpose has been debated and is not yet routinely clinically performed. To adequately evaluate this assay, a systematic review and meta-analysis of studies of the CSF lactate concentration as a marker for both bacterial meningitis and aseptic meningitis was performed. Methods:Electronic searches in PubMed, Scopus, the MEDION database and the Cochrane Library were conducted to identify relevant articles published before March 2009. A manual search of reference lists from selected articles was also conducted. Two reviewers independently selected relevant articles and extracted data on study
characteristics, quality and accuracy.
Results:Twenty-five articles were identified that met the eligibility criteria. Diagnostic odds ratios were
considerably homogenous (Chi-squareP= 0.1009,I2 = 27.6%), and the homogeneity was further confirmed by a Galbraith plot and meta-regression analysis using several covariates. The symmetrical summary receiver-operator characteristic curve (SROC), fitted using the Moses-Shapiro-Littenberg method, was positioned near the upper left corner of the SROC curve. The Q value and area under the curve were 0.9451 and 0.9840, respectively, indicating excellent accuracy. The diagnostic accuracy of the CSF lactate concentration was higher than those of other four conventional markers (CSF glucose, CSF/plasma glucose quotient, CSF protein, and CSF total number of leukocytes) using a head to head meta-analysis of the 25 included studies.
Conclusions:To distinguish bacterial meningitis from aseptic meningitis, CSF lactate is a good single indicator and a better marker compared to other conventional markers.
Introduction
Accurate and rapid diagnosis of acute bacterial meningi-tis (BM) is essential because disease outcome depends on immediate initiation of appropriate antibiotic therapy [1]. BM should be treated promptly with antibiotics, whereas acute aseptic meningitis (AM) is usually self limiting. However, differentiating BM from AM may be challen-ging for clinicians because the symptoms and laboratory assays are often similar and overlapping. In addition, clas-sical clinical manifestations of BM in infants and children are usually difficult to recognize because of the absence of signs of meningeal irritation and because of delayed
elevation of intracranial pressure. Parameters examined in cerebrospinal fluid (CSF) are less descriptive in chil-dren than in adults: in enterovirus meningitis, CSF para-meters can be practically identical to those of bacterial meningitis. For example, acute meningitis with predomi-nance of neutrophils in CSF suggests BM; however, herpes simplex-1 infected meningitis presents with > 90% neutrophils in CSF [2]. Furthermore, other assays, such as Gram stain, latex agglutination, and polymerase chain reaction-based assays, lack sensitivity [3-6]. In practice, before definitive CSF bacterial cultures are available, most patients with acute meningitis are treated with broad-spectrum antibiotics targeting BM. In general, this does not seriously harm the AM patient; however, it may enhance the local frequency of antibiotic resistance [7] and cause antibiotic adverse effects, nosocomial infections * Correspondence: [email protected]
1
Department of Immunogenetics, Institute of Tropical Medicine (NEKKEN), Nagasaki University, 1-12-4 Sakamoto, Nagasaki 852-8523, Japan Full list of author information is available at the end of the article
[8], and high medical costs [9]. Thus, it is not only impor-tant to recognize BM patients who promptly need antimi-crobial therapy but also AM patients who do not need antibiotics and/or hospital stays.
In recent years, it has been proposed that CSF lactate may be a good marker that can differentiate bacterial meningitis (> 6 mmol/l), from partially treated meningitis (4 to 6 mmol/l) and aseptic meningitis (< 2 mmol/l) [10]. However, other researchers have suggested that CSF lac-tate offers no additional clinically useful information over conventional CSF markers [11,12]. Other markers, such as C-reactive protein (CRP) [13] and procalcitonin [14], may allow differentiation of patients with bacterial meningitis from those with aseptic meningitis. However, neither of these markers is routinely used in clinical practice [4]. The reported diagnostic accuracy of CSF lactate for the differ-ential diagnosis of BM from AM has varied across studies [11,12]. To adequately evaluate its accuracy, a systematic review and meta-analysis were performed on studies that had investigated the CSF lactate concentration as a differ-ential marker in both BM and AM patients.
Materials and methods
A protocol was designed before this study was per-formed as recommended by the Quality of Reporting of Meta-analyses (QUORUM) statement [15] and the PRISMA Statement [16].
Search strategy and study selection
Four electronic databases, PubMed [17], Scopus [18], MEDION database [19] and the Cochrane Library [20], were searched for suitable studies published before March 2009. The search terms that were used included
“meningitis AND (lactate OR lactic)”. Only articles writ-ten in English that evaluated the CSF lactate/lactic acid concentration for differential diagnosis distinguishing BM from AM were included.
Clinical diagnosis was used as reference standard for BM and AM to avoid misclassification of BM patients as AM. For sub-group analysis, diagnosed BM was defined as a patient with CSF pleocytosis (CSF leukocyte count > 4 cells/μl) and one of the following criteria: (1) positive CSF Gram-stained smear for a bacterial pathogen, (2) positive CSF culture for a bacterial pathogen, (3) posi-tive CSF latex agglutination assay or polymerase chain reaction assay for a bacterial pathogen, or (4) positive blood culture. Diagnosed viral AM was defined as the diagnosis of a patient with pleocytosis in the CSF of≥4 leukocytes/μl combined with the absence of any of the four criteria for BM and with either of the following cri-teria: a positive polymerase chain reaction assay or a positive culture for viral pathogen or specific antiviral antibodies in CSF and serum [21].
Studies with fewer than 16 participants were excluded in order to limit selection bias (≥8 BM patients and≥8 AM patients were required for inclusion) [22]. Furthermore, the following studies were also excluded: (1) animal studies, case reports, replies and reviews; (2) studies in which data could not be extracted; and (3) studies that used lactate as a criteria for diagnosis of AM.
Two independent reviewers (NTH and NTHT) scanned primary titles and abstracts (when available) to select potential full text articles for further scrutiny. When the title and abstract could not be rejected by any reviewer, the full text of the article was obtained and carefully reviewed for inclusion by the two reviewers. Inclusion or exclusion of each study was determined by discussion and consensus between the two reviewers. If multiple reports contained overlapping cases, only the largest report was included. When overlap could not be determined conclusively, the study with the most inclu-sive information or the latest report was included.
Data extraction
Two independent investigators (NTH and NTHT) extracted data from the studies chosen for inclusion. Disagreements were resolved by discussion and consen-sus. Studies with criteria for establishing the diagnosis of BM that relied solely on clinical or laboratory improvement after antibiotic therapy were excluded. In selected studies, the following patients who met the fol-lowing criteria were also excluded from the BM groups: (1) patients with tuberculous or fungal meningitis, (2) BM patients who received antibiotics before lumbar puncture, (3) post-surgery or traumatic patients, and (4) patients with other central nervous system condi-tions that could contribute to elevation of CSF lactate (such as recent stroke, seizures, brain hypoxia, and brain trauma). A 2 × 2 diagnostic table was constructed from informative descriptions, lactate values, lactate plots, sensitivity, specificity, likelihood ratios, and receiver-operator characteristic (ROC) curves. Other information for each study, such as author, publication year, age range of patients, assay methods, stabilizer addition ver-sus immediate measurement of lactate, prior antibiotic treatment, tuberculosis, country and city where the study was performed, study design (cross sectional or case control), data collection (prospective or retrospec-tive), assignment of the patient (consecutive or random), and blinded interpretation of lactate measurements and diagnostic results, were also recorded.
Quality assessment
method. The quality of each study included in the meta-analysis was determined across five metrics: diagnostic criteria, study design, exclusion of patients who received antibiotics before lumbar puncture, exclusion of patients with other disorders, and the method of the lactate assay. Since case-control studies reportedly over-estimate the accuracy result [24], the study design was scored as follows: studies with cross-sectional were assigned one point; those with case-control were assigned zero points. For data collection, prospective studies were identified and assigned two points, retro-spective studies were assigned one point, and a study with unknown study design was assigned zero points. In addition, studies that recruited consecutive or random patients were assigned one point, while studies without this kind of information were assigned zero points. Stu-dies excluding chronic diseases or other central nervous disorders patients were assigned one point. Studies that originally excluded data from subjects who received antibacterial therapy prior to lumbar puncture were assigned two points, while studies that included subjects who received antibacterial therapy prior to lumbar puncture and excluded in the present report were assigned one point. Studies that originally excluded data from subjects with TB meningitis were assigned two points, while studies that included these subjects and were excluded by us in this report were assigned one point. For the quality of the method, studies with blinded assessment of the lactate assay with diagnostic results were assigned one point. Since sample processing is another important issue that may affect the accuracy of the assay [25], studies using a stabilizer for lactate sample processing or measuring immediately were assigned one point. Quality was evaluated by discussion and consensus after the independent review of each study by two authors (NTH and NTHT).
Meta-analysis
Data were analyzed using Meta-Disc (version 1.4) software (Unit of Clinical Biostatistics, Ramón y Cajal Hospital, Madrid, Spain) [26] unless otherwise stated. The software is publicly available [27]. Accuracy measures including sensitivity, specificity, positive likelihood ratio (LR+), nega-tive likelihood ratio (LR-), and diagnostic odds ratio (DOR) were computed. The DOR describes the ratio of the odds of a positive assay in a BM patient compared with a AM patient and was calculated by LR+/LR- (or (sensitivity/(1-specificity))/((1-sensitivity)/specificity)) [28]. A DOR > 1 indicated the assay had discriminative power; a higher DOR indicated more discriminative power.
Heterogeneity of both the sensitivity and specificity across the studies was tested using a c2 test. A c2
P-value of < 0.05 was considered heterogeneous. An alternative method to explore the heterogeneity, theI2
index, was also used. TheI2 index presents the percen-tage of total variation across studies that is due to het-erogeneity rather than chance [29]. I2 values of > 25%, 50%, or 75% were considered to reflect low, moderate, and high heterogeneity, respectively [29].
To further evaluate the accuracy of the CSF lactate concentration, the Q value and area under the curve (AUC) were calculated from the SROC curves. The Q value is the intersection point of the SROC curve with a diagonal line of the ROC space at which sensitivity equals specificity; a higher Q value indicates higher accuracy. AUC values ≥0.5, 0.75, 0.93, or 0.97 were con-sidered to represent fair, good, very good, or excellent accuracy [32].
Publication bias
Since publication bias is a concern for meta-analysis, the potential presence of this bias was identified using a funnel plot and Egger test [33]. If publication bias was found, the trim and fill method of Duvall and Tweedie was performed to add studies that appeared to be miss-ing [34,35] usmiss-ing the Comprehensive Meta-analysis soft-ware version 2.0 (Biostat Inc. Englewood, NJ, USA) [36]. The pooled DOR and its 95% confidence interval were adjusted after the addition of potential missing studies.
Results
Literature search
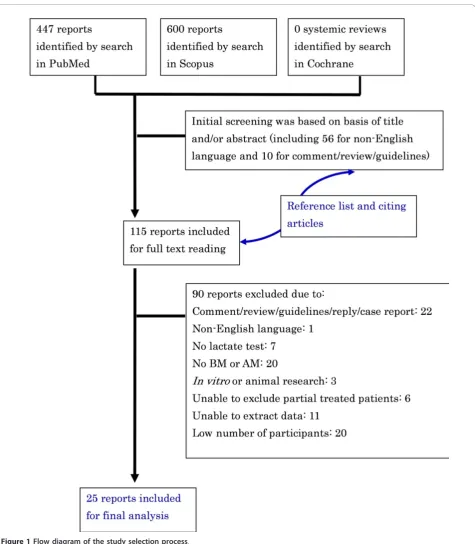
The literature search initially identified 447 and 600 publications from Pubmed and Scopus, respectively (Figure 1). After an initial screening of the title and/or abstract, 115 articles were included for full text reading. Then additional studies were identified by searching reference lists and articles that cited relevant publica-tions using Scopus databases from full text reviews, review articles, and textbook chapters. These titles and abstracts were reviewed, and the full text was read if necessary. A total of 90 articles were excluded from final analysis due to the following reasons: (1) com-ment/review/guidelines/reply/case report (n = 22), (2)non-English language (n= 1), (3) no lactate concen-tration (n = 7), (4) no BM or AM group (n= 20), (5)
in vitroor animal research (n= 3), (6) unable to exclude partially treated patients (n= 6), (7) unable to extract data (n= 11), and (8) low number of participants (n= 20). Finally, 25 studies were selected for final analysis [11,12,37-58] with agreement between the two reviewers (= 0.898).
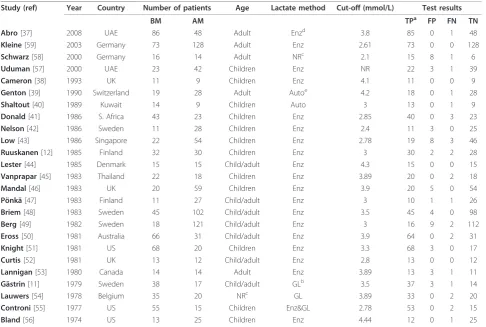
The 25 selected publications, which were performed in 16 countries and on five continents, included 783 BM and 909 AM patients. The characteristics of these stu-dies are outlined in Table 1. The average sample size of the included studies was 31 patients (range, 11 to 86) for the BM group and 36 patients (range, 9 to 128) for the AM group. A total of three different methods for lactate measurement (enzymatic:n= 19, automatic ana-lyzer:n= 2, gas-liquid chromatography n= 2) were per-formed in the 25 included studies. One study used both enzymatic and gas-liquid chromatography methods, with
consistent results between the analysis techniques. In all of the 25 included studies, the cut-off value of CSF lac-tate of < 3.5 mmol/L was applied in 12 studies, while the cut-off value of≥3.5 mmol/L was applied in 12 stu-dies. One study did not indicate the CSF lactate concen-tration cut-off value.
Quality of selected studies
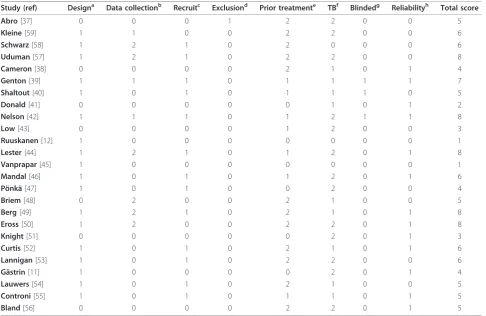
In all of the 25 included studies, the lactate assay did not play a role in the final diagnosis of BM or AM. For the study design, 18 studies (72%) were cross-sectional, while seven studies (18%) were case-control studies or not reported (Table 2). Concerning study design, five (21%) collected data prospectively, three (13%) collected data retrospectively, and 16 (69%) did not report the study design. Twelve (50%) studies used either consecu-tive or random recruitment of participants, while the remaining studies (50%) did not state the method of participant selection. Only one study (4%) described exclusion criteria for participant enrolment, which included the exclusion of patients with chronic diseases or central nervous system disorders. Eleven studies (46%) did not include data from patients who received antibacterial therapy prior to lumbar puncture, seven studies (30%) enrolled subjects who received antibacter-ial therapy prior to lumbar puncture (these data were excluded in the present report), and six studies (26%) did not mention prior antibacterial therapy. Fourteen studies (58%) originally excluded data from subjects with tuberculous meningitis; eight studies (35%) included these subjects and were excluded in the pre-sent study, while no such information could be found in two studies (9%). Concerning the quality of the lactate method, a blinded assessment of the lactate assay with diagnostic results was reported in only three studies (13%), while a stabilizer was used for the lactate sample or an immediate lactate measurement was described in 13 (54%). No study scored the maximal points (11) in the present analysis, while one study received one point. The range of total points was one to eight (Table 2).
Meta-analysis
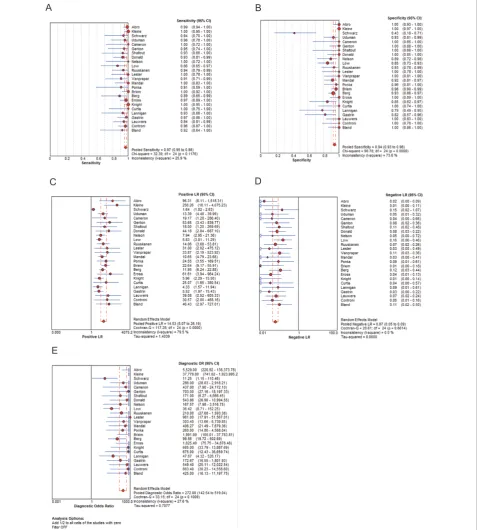
The sensitivity of included studies ranged from 0.86 to 1.00 (mean, 0.96; 95% confidence interval (CI), 0.95 to 0.98) (Figure 2), while the specificity varied widely from 0.43 to 1.00 (mean, 0.94; 95% CI, 0.93 to 0.96). The mean of LR+ was calculated at 14.53 (95% CI, 8.07 to 26.19), LR- at 0.07 (95% CI, 0.05 to 0.09) and the mean DOR was 270.0 (95% CI, 142.54 to 519.04).
(r) was calculated to measure the extent of correlation between sensitivity and specificity. The present results indicated a poor correlation between sensitivity and speci-ficity, with a Spearman P = -0.043, suggesting that variation between studies was not mainly due to different cut-off values [22]. In contrast, homogeneity was present
among the studies with regard to sensitivity (c2P= 0.12,
I2= 25.9%), LR- (c2P
= 0.66,I2= 0.0%), and for DOR (c2
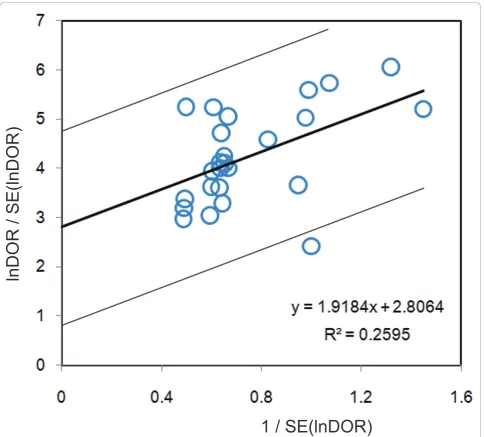
[image:5.595.62.538.85.630.2]P= 0.1009,I2= 27.6%). A Galbraith plot was created to graphically assess the homogenous nature of the lnDOR, and to identify potential outlier studies (Figure 3). On the Galbraith plot, 24 studies were inside the 95% bounds
(the zones of two outer parallel lines drawn at two units over and below the regression) from the standardized mean lnDOR, while only one study was the outlier [58]. However, the DOR was just slightly increased from 270.0 to 292.71 after removing the outlier study. further con-firming the relatively homogenous nature of the lnDOR [22]. The homogenous nature of the lnDOR across studies was also examined using meta-regression analysis with the following covariates as predictor variables: data collection, study design (prospective or retrospective), recruitment of the patient (consecutive or random), assay methods, exclu-sion criteria, prior antibiotic treatment, tuberculous meningitis, blinded interpretation of lactate measurement, reliability of the method (lactate sample stabilizer or immediate measurement), quality assessment score, cut-off points, lactate method, age of participants (children/ adult), total number of participants, and effective sample size (ESS). The present results revealed an independent association of the lnDOR with tested covariates (Data not shown). These data suggest that the lnDOR of the included studies is homogenous, and thus a SROC can be
fitted based on the pairs of sensitivity and specificity of the individual studies [22].
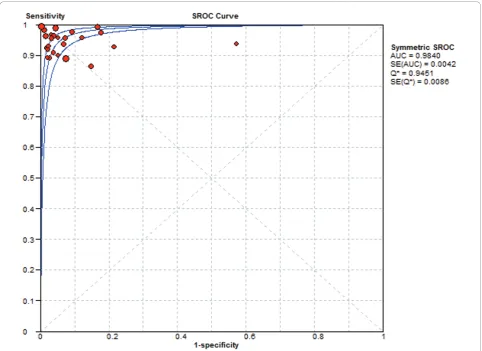
The slope of the fitted regression line of the Moses-Shapiro-Littenberg model was zero (testing whether parameter b = 0,P = 0.84), indicating a constant DOR. Therefore, a symmetrical SROC fitting was performed (Figure 4). The present results showed that the SROC curve was positioned near the upper left corner of the SROC curve, with the Q value and AUC at 0.9451 and 0.9840, respectively, indicating excellent accuracy.
Sub meta-analysis of lactate as a differential marker for diagnosed BM from AM
[image:6.595.56.543.99.426.2]Meta-analysis was further performed to assess the diag-nostic accuracy of lactate between diagnosed BM and AM. Nineteen studies [11,12,38,39,41-43,46-56,59] that analyzed only diagnosed BM and five other studies [37,40,44,45,57] that included diagnosed BM as well as clinical BM that could be extracted separately were included in the subgroup analysis. The specificity and LR+ were heterogeneous among the studies, but
Table 1 Summary of included studies
Study (ref) Year Country Number of patients Age Lactate method Cut-off (mmol/L) Test results
BM AM TPa FP FN TN
Abro[37] 2008 UAE 86 48 Adult Enzd 3.8 85 0 1 48
Kleine[59] 2003 Germany 73 128 Adult Enz 2.61 73 0 0 128
Schwarz[58] 2000 Germany 16 14 Adult NRc 2.1 15 8 1 6
Uduman[57] 2000 UAE 23 42 Children Enz NR 22 3 1 39
Cameron[38] 1993 UK 11 9 Children Enz 4.1 11 0 0 9
Genton[39] 1990 Switzerland 19 28 Adult Autoe 4.2 18 0 1 28
Shaltout[40] 1989 Kuwait 14 9 Children Auto 3 13 0 1 9
Donald[41] 1986 S. Africa 43 23 Children Enz 2.85 40 0 3 23
Nelson[42] 1986 Sweden 11 28 Children Enz 2.4 11 3 0 25
Low[43] 1986 Singapore 22 54 Children Enz 2.78 19 8 3 46
Ruuskanen[12] 1985 Finland 32 30 Children Enz 3 30 2 2 28
Lester[44] 1985 Denmark 15 15 Child/adult Enz 4.3 15 0 0 15
Vanprapar[45] 1983 Thailand 22 18 Children Enz 3.89 20 0 2 18
Mandal[46] 1983 UK 20 59 Children Enz 3.9 20 5 0 54
Pönkä[47] 1983 Finland 11 27 Child/adult Enz 3 10 1 1 26
Briem[48] 1983 Sweden 45 102 Child/adult Enz 3.5 45 4 0 98
Berg[49] 1982 Sweden 18 121 Child/adult Enz 3 16 9 2 112
Eross[50] 1981 Australia 66 31 Child/adult Enz 3.9 64 0 2 31
Knight[51] 1981 US 68 20 Children Enz 3.3 68 3 0 17
Curtis[52] 1981 UK 13 12 Child/adult Enz 2.8 13 0 0 12
Lannigan[53] 1980 Canada 14 14 Adult Enz 3.89 13 3 1 11
Gästrin[11] 1979 Sweden 38 17 Child/adult GLb 3.5 37 3 1 14
Lauwers[54] 1978 Belgium 35 20 NRc GL 3.89 33 0 2 20
Controni[55] 1977 US 55 15 Children Enz&GL 2.78 53 0 2 15
Bland[56] 1974 US 13 25 Children Enz 4.44 12 0 1 25
a
TP, true-positive; FP, false-positive; FN, false-negative; TN, true-negative;b
GL, gas-liquid chromatography;c
NR, not reported;d
Enz, Enzymatic;e
sensitivity, LR-, and DOR were significantly homoge-nous (data not shown). Symmetrical SROC fitting was also performed for these five studies due to a constant
DOR (testing whether parameter b = 0, P = 0.4452).
The result showed a SROC curve with the Q value and AUC at 0.9426 and 0.9828, respectively, indicating excellent accuracy, and was consistent with the 25 included studies (data not shown).
Sub meta-analysis of lactate as a differential marker for diagnosed BM from diagnosed viral AM
Meta-analysis was further performed to assess the diag-nostic accuracy of lactate between diagnosed BM and diagnosed viral AM. One study that recruited only diag-nosed viral AM and four other studies that included diagnosed viral AM as well as clinical AM that could be extracted separately were included in the subgroup ana-lysis. The specificity was still heterogeneous among the studies (c2 P= 0.14,I2 = 42.1%) of diagnostic accuracy, but sensitivity, LR+, LR-, and DOR were significantly homogenous (data not shown). Symmetrical SROC fit-ting was also performed for these five studies due to
a constant DOR (testing whether parameter b = 0,
P= 0.9145). The result revealed a SROC curve with the Q value and AUC at 0.9563 and 0.9891, respectively, suggesting excellent accuracy, and was consistent with above results (data not shown).
Head-to-head comparison of CSF lactate level versus conventional markers
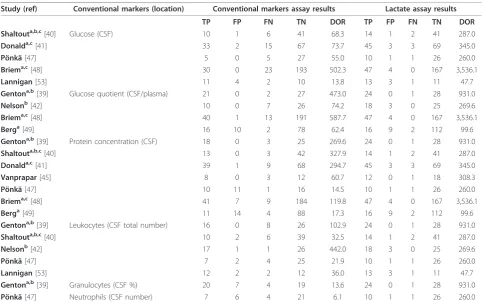
In order to compare the diagnostic accuracy of the CSF lactate concentration and other conventional markers for diagnosis of BM, data were extracted from the 25 selected articles only if the study had on the same set of specimens a parallel analysis of CSF lactate and a con-ventional marker. Since concon-ventional markers were used as the diagnostic criteria of BM, only BM patients with confirmed diagnosis were extracted in this analysis. The extracted data are shown in Table 3, which includes the DOR values for CSF lactate, CSF glucose, CSF/plasma glucose quotient, CSF protein, CSF total number leuko-cytes, CSF percentages of granuloleuko-cytes, and CSF number of granulocytes.
[image:7.595.56.543.99.415.2]In the present study, for diagnosis of BM, five studies performed head to head comparisons of CSF lactate ver-sus CSF glucose, four verver-sus the CSF/plasma glucose
Table 2 Quality of included studies
Study (ref) Designa Data collectionb Recruitc Exclusiond Prior treatmente TBf Blindedg Reliabilityh Total score
Abro[37] 0 0 0 1 2 2 0 0 5
Kleine[59] 1 1 0 0 2 2 0 0 6
Schwarz[58] 1 2 1 0 2 0 0 0 6
Uduman[57] 1 2 1 0 2 2 0 0 8
Cameron[38] 0 0 0 0 2 1 0 1 4
Genton[39] 1 1 1 0 1 1 1 1 7
Shaltout[40] 1 0 1 0 1 1 1 0 5
Donald[41] 0 0 0 0 0 1 0 1 2
Nelson[42] 1 1 1 0 1 2 1 1 8
Low[43] 0 0 0 0 1 2 0 0 3
Ruuskanen[12] 1 0 0 0 0 0 0 0 1
Lester[44] 1 2 1 0 1 2 0 1 8
Vanprapar[45] 1 0 0 0 0 0 0 0 1
Mandal[46] 1 0 1 0 1 2 0 1 6
Pönkä[47] 1 0 1 0 0 2 0 0 4
Briem[48] 0 2 0 0 2 1 0 0 5
Berg[49] 1 2 1 0 2 1 0 1 8
Eross[50] 1 2 0 0 2 2 0 1 8
Knight[51] 0 0 0 0 0 2 0 1 3
Curtis[52] 1 0 1 0 2 1 0 1 6
Lannigan[53] 1 0 1 0 2 2 0 0 6
Gästrin[11] 1 0 0 0 0 2 0 1 4
Lauwers[54] 1 0 1 0 2 1 0 0 5
Controni[55] 1 0 1 0 1 1 0 1 5
Bland[56] 0 0 0 0 2 2 0 1 5
a
Study design (cross-sectional or case-control);b
Data collection (prospective or retrospective);c
recruitment of the patient (consecutive or random);d exclusion criteria;e
prior antibiotic treatment;f
tuberculous meningitis;g
blinded interpretation of lactate measurement;h
quotient, seven versus CSF protein, five versus CSF total number of leukocytes, one versus percentages of granulo-cytes, and one versus CSF number of granulocytes. How-ever, TB meningitis patients and partially treated BM patients could not be excluded from the conventional
markers assays. Therefore, in a secondary meta-analysis these patients were included in the BM group. Higher DOR values were observed with the CSF lactate level than with the conventional markers in all studies except for one study for the CSF protein assay [40] and one
A B
C D
[image:8.595.61.542.92.623.2]E
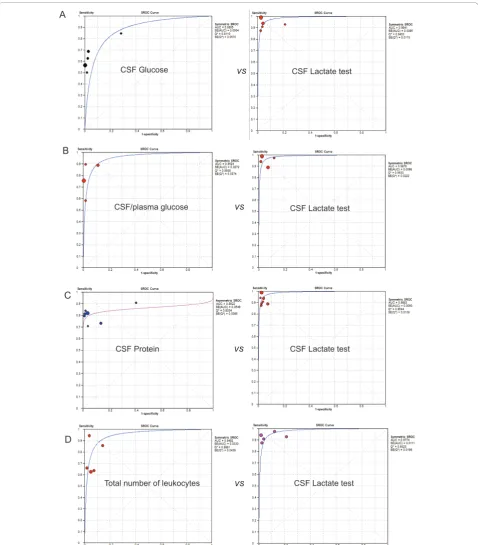
study for total number of leukocytes [42]. Since DOR values of the CSF lactate concentration, CSF glucose level, CSF/plasma glucose quotient, and CSF total num-ber of leukocytes were found to be constant (data not shown), symmetrical SROC fitting by a random effects model was performed for these assays. On the other hand, asymmetrical SROC fitting by a random effects model was computed for the CSF protein assay because the slope of the fitted regression line of the Moses-Sha-piro-Littenberg model was not zero (data not shown). Following SROC analysis for all four subgroups of the CSF lactate concentration (Figure 5), the overall AUC was 0.977 to 0.988, which was consistent with the
primary analysis of the 25 included studies. In addition, the AUC values were found to be lower for the four con-ventional markers (0.881, 0.952, 0.862, and 0.948 for CSF glucose, CSF/plasma glucose quotient, CSF protein, and CSF total number of leukocytes, respectively), suggesting a lower accuracy compared to the CSF lactate test.
Assessment of publication bias
The relatively asymmetric funnel plot (Figure 6) and the Egger intercept (2.95, two-tailedP = 0.00004) suggested the presence of a publication bias. Using the trim and fill method of Duvall and Tweedie, 11 missing studies were required in the left side of the funnel plot in order
lnDOR / SE(lnDOR)
[image:9.595.57.542.87.524.2]1 / SE(lnDOR)
to make the plot symmetric. However, the pooled lnDOR dropped just slightly from 5.60 (95% CI, 4.95 to .25) to 4.84 (95% CI, 4.16 to 5.53) after addition of these missing studies.
Discussion
The present meta-analysis revealed that the AUC of CSF lactate concentration was 0.9840 (Figure 4), indicating an excellent level of overall accuracy. The overall perfor-mance was highest for the CSF lactate concentration compared to the performances of the four conventional markers (CSF glucose, CSF/plasma glucose quotient, CSF protein, and CSF total number of leukocytes) based on head-to-head meta-analytic SROC curves and their AUC (Figure 5), which was in good agreement with pre-vious literature [4,59]. CSF lactate is less useful if it has a low concentration, but the assay is supportive if it is positive, especially if the diagnosis was otherwise not conclusive. In such cases, increased CSF lactate should
be considered a sign of BM. Because of the lactate assay, several BM patients with elevated CSF lactate and mini-mal CSF abnormini-malities have been treated with antibio-tics prior to culture test results [11,47,55]. Moreover, an increased CSF lactate level has been also proposed as a good indicator of CSF infection in intra-ventricular hemorrhagic patients with an external ventricular drain [60,61]. However, clinicians should be aware that CSF lactate is also increased in several central nervous sys-tem diseases such stroke (2 to 8 mmol/l) [62,63], con-vulsion (2 to 4 mmol/l) [64], cerebral trauma (2 to 9 mmol/l) [52], hypoglycemic coma (2 to 6 mmol/l) [65].
[image:10.595.57.540.88.439.2]The measurement of CSF lactate concentration is a simple, rapid, inexpensive assay, takes just 15 minutes, and can be performed at the bedside. In addition, the CSF lactate concentration is useful during the course of treatment, because a rapid CSF lactate decrease is indi-cative of good prognosis [39]. Since the CSF lactate con-centration is not specific for BM, the results of this
assay should be interpreted in parallel with clinical find-ings and the results of conventional assays including CSF concentrations of protein, cells, glucose, and a microbiological examination of CSF. The cut-off value for CSF lactate concentration ranges from 2.1 to 4.44 mmol/L, suggesting a variance between instrument, hospital labs, and the method. Therefore, every center should set its own cut-off value for CSF lactate concen-tration. Another disadvantage of CSF lactate is that it is not useful in the choice of antibiotic selection, which must be based on the results of microscopic examina-tion of a smear or culture for bacteria, as well as the other clinical data.
The mechanism of the increased concentration of lac-tate in the CSF of patients with BM is not clear, but it has been linked with anaerobic glycolysis of brain tissue due to a decrease cerebral blood flow and oxygen uptake [66,67]. Additionally, the concentration of CSF lactate is independent of serum lactate, probably due to its ionized state that crosses the blood-CSF barrier at a very slow rate [68], suggesting another advantage over CSF glucose assay [38].
The present systemic review has several strengths. First, the criteria and protocol were defined, the
protocol was followed, and a search of several databases and sources was performed to identify potential studies. The quality of included studies was assessed by using several criteria that could affect diagnostic accuracy. These steps were carried out by two independent researchers. Heterogeneity was explored in accordance with published guidelines. Then, the summary ROC curve was computed and Q values and AUC were calcu-lated in order to evaluate the diagnostic accuracy of CSF lactate marker. Potential effects of several covariates on the diagnostic accuracy were assessed, but none were found.
[image:11.595.56.540.98.401.2]Because publication bias can affect the accuracy of diagnostic assays, potential publication bias was assessed using funnel plots. The results showed a skewed funnel shape, suggesting a potential publication bias in the lit-erature (Figure 6). However, it was noted that the three largest studies [37,48,50] had higher DORs compared to smaller studies, and they had similar almost perfect accuracy [38,44,56]. This discrepancy could be explained by the calculation method of adding 0.5 to cells with zero, suggesting a weakness of the funnel plot when the assay investigated has excellent accuracy. Another main concern is the lack of some additional databases that
Table 3 Head-to-head comparison of CSF lactate concentration and other conventional markers
Study (ref) Conventional markers (location) Conventional markers assay results Lactate assay results
TP FP FN TN DOR TP FP FN TN DOR
Shaltouta,b,c[40] Glucose (CSF) 10 1 6 41 68.3 14 1 2 41 287.0
Donalda,c[41] 33 2 15 67 73.7 45 3 3 69 345.0
Pönkä[47] 5 0 5 27 55.0 10 1 1 26 260.0
Briema,c[48] 30 0 23 193 502.3 47 4 0 167 3,536.1
Lannigan[53] 11 4 2 10 13.8 13 3 1 11 47.7
Gentona,b[39] Glucose quotient (CSF/plasma) 21 0 2 27 473.0 24 0 1 28 931.0
Nelsonb[42] 10 0 7 26 74.2 18 3 0 25 269.6
Briema,c[48] 40 1 13 191 587.7 47 4 0 167 3,536.1
Berga[49] 16 10 2 78 62.4 16 9 2 112 99.6
Gentona,b[39] Protein concentration (CSF) 18 0 3 25 269.6 24 0 1 28 931.0
Shaltouta,b,c[40] 13 0 3 42 327.9 14 1 2 41 287.0
Donalda,c[41] 39 1 9 68 294.7 45 3 3 69 345.0
Vanprapar[45] 8 0 3 12 60.7 12 0 1 18 308.3
Pönkä[47] 10 11 1 16 14.5 10 1 1 26 260.0
Briema,c[48] 41 7 9 184 119.8 47 4 0 167 3,536.1
Berga[49] 11 14 4 88 17.3 16 9 2 112 99.6
Gentona,b[39] Leukocytes (CSF total number) 16 0 8 26 102.9 24 0 1 28 931.0
Shaltouta,b,c[40] 10 2 6 39 32.5 14 1 2 41 287.0
Nelsonb[42] 17 1 1 26 442.0 18 3 0 25 269.6
Pönkä[47] 7 2 4 25 21.9 10 1 1 26 260.0
Lannigan[53] 12 2 2 12 36.0 13 3 1 11 47.7
Gentona,b[39] Granulocytes (CSF %) 20 7 4 19 13.6 24 0 1 28 931.0
Pönkä[47] Neutrophils (CSF number) 7 6 4 21 6.1 10 1 1 26 260.0
a
Included TB meningitis;b
A
B
C
D
vs vs vs
vs CSF Lactate test
CSF Lactate test
CSF Lactate test
CSF Lactate test Total number of leukocytes
CSF Protein CSF/plasma glucose
[image:12.595.59.538.87.633.2]CSF Glucose
were used for searching, that is, we did not access EMBASE, which could have added more relevant stu-dies. we did search Scopus, which is reportedly 91.6% overlapped with EMBASE [69]. Therefore, we think that we have not missed many studies large enough to change the overall impression of our results.
In addition, non-English language studies were also excluded; the non-English language reports represented approximately 10% of all initial articles. We excluded non-English articles in meta-analyses due to limited resource and potential error in the translation and inter-pretation in several languages including Chinese, Croa-tian, Dutch, French, German, Hebrew, Italian, Korean, Norwegian, Polish, Portuguese, Romanian, Russian,
Serbian, Spanish, and Turkish. The odds ratio in meta-analyses from non-English articles is reportedly 0.8 (95% CI, 0.7 to 1.0) times lower than that from English-written publications [70], therefore, it is unlikely that the inclusion of these non-English articles would have altered our main conclusions substantially.
[image:13.595.58.540.85.486.2]In addition, studies that reported non-significant results are less likely to be accepted for publication. All of these potentially missing data could result in a signifi-cant publication bias. However, the trim and fill method of Duvall and Tweedie was used to overcome this bias, and it was found that it was unlikely to distort the over-all diagnostic performance of the lactate concentration (Figure 6).
lnDOR
SE(lnD
O
R)
Conclusions
The present meta-analysis study indicated that for dis-crimination of BM from AM, the CSF lactate concentra-tion is a good single indicator and a better marker compared to other conventional markers including CSF glucose, CSF/plasma glucose quotient, CSF protein, and CSF total number of leukocytes. Cost-effectiveness stu-dies should be performed to investigate the economic impact of using this technique as a routine assay in hos-pital to distinguish BM from AM.
Key messages
•The diagnostic accuracy of cerebrospinal fluid (CSF) lactate assay for differential diagnosis between bacterial meningitis and aseptic meningitis was excellent with Q value of 0.9451 and area under the curve of 0.9840.
•CSF lactate was a better marker for distinguishing bacterial meningitis from aseptic meningitis compared to other conventional markers including CSF glucose, CSF/plasma glucose quotient, CSF protein, and CSF total number of leukocytes
Abbreviations
AM: aseptic meningitis; AUC: area under the curve; BM: bacterial meningitis; CI: confidence interval; CRP: C-reactive protein; CSF: cerebrospinal fluids; DOR: Diagnostic odd ratio; ESS: effective sample size; lnDOR: natural log of DOR, LR+, positive likelihood ratio; LR-: negative likelihood ratio, ROC, receiver-operator characteristic; SE: standard error; SROC: summary ROC curve; TB: tuberculosis.
Acknowledgements
This work was supported in part by a Grant-in-Aid for Young Scientists (17301870, 2008-2010 for NTH) from the Ministry of Education, Culture, Sports, Science and Technology (MEXT, Japan), and was supported in part by a Grant-in-Aid for Scientific Research from Nagasaki University to NTH (2007-2009). This study was also supported in part by the Global COE Program (2008-2012) and Japan Initiative for Global Research Network on Infectious Diseases (J-GRID) for KH.
Author details
1Department of Immunogenetics, Institute of Tropical Medicine (NEKKEN), Nagasaki University, 1-12-4 Sakamoto, Nagasaki 852-8523, Japan. 2Department of Pediatrics, University of Medicine and Pharmacy at Ho Chi Minh City, 217 Hong Bang Street, District 5, Ho Chi Minh City, Vietnam. 3Children’s Hospital No.1, 2 Su Van Hanh Street, District 10, Ho Chi Minh City, Vietnam.4Center for International Collaborative Research, Nagasaki University, 1-12-4 Sakamoto, Nagasaki 852-8523, Japan.5Clinical Biostatistics Unit, Ramón y Cajal Hospital, Carretera de Colmenar km 9.100, 28034 Madrid, Spain.6Global COE program, Nagasaki University, 1-12-4 Sakamoto, Nagasaki 852-8523, Japan.
Authors’contributions
NTH designed the research, collected, analyzed and interpreted the data, and drafted and revised the manuscript. NTHT carried out the collection, analysis and interpretation of the data. DTND and MK contributed to the conception of the study and approved the final version of the manuscript. JZ helped to design the study, performed the statistical analysis and drafted the manuscript. KH participated in the design of the study and drafted and revised the manuscript. All authors read and approved the final manuscript.
Competing interests
The authors declare that they have no competing interests.
Received: 17 June 2010 Revised: 21 September 2010 Accepted: 31 December 2010 Published: 31 December 2010
References
1. Saez-Llorens X, McCracken GH Jr:Bacterial meningitis in children.Lancet 2003,361:2139-2148.
2. Durand ML, Calderwood SB, Weber DJ, Miller SI, Southwick FS, Caviness VS Jr, Swartz MN:Acute bacterial meningitis in adults. A review of 493 episodes.N Engl J Med1993,328:21-28.
3. Shelburne C, Statler M:Meningitis: distinguishing the benign from the serious.Jaapa2008,21:54-59.
4. Roos KL, Tyler KL:Meningitis, Encephalitis, Brain abscess, and Empyema.
Harrison’s Principles of Internal Medicine.16th edition. New York: McGraw-Hill Professional; 2004, 2471-2490.
5. Jacques J, Carquin J, Brodard V, Moret H, Lebrun D, Bouscambert M, Motte J, Remy G, Andreoletti L:New reverse transcription-PCR assay for rapid and sensitive detection of enterovirus genomes in cerebrospinal fluid specimens of patients with aseptic meningitis.J Clin Microbiol2003,
41:5726-5728.
6. Freeman HR, Mai NT, Diep TS, Parry C, Hien TT, Farrar JJ:The role of the polymerase chain reaction in the diagnosis of bacterial meningitis in Vietnam.Ann Trop Med Parasitol2004,98:65-70.
7. Wise R, Hart T, Cars O, Streulens M, Helmuth R, Huovinen P, Sprenger M:
Antimicrobial resistance. Is a major threat to public health.BMJ1998,
317:609-610.
8. Raymond J:[Epidemiology of nosocomial infections in pediatrics].Pathol Biol (Paris)2000,48:879-884.
9. Parasuraman TV, Frenia K, Romero J:Enteroviral meningitis. Cost of illness and considerations for the economic evaluation of potential therapies.
Pharmacoeconomics2001,19:3-12.
10. Cunha BA:Distinguishing bacterial from viral meningitis: the critical importance of the CSF lactic acid levels.Intensive Care Med2006,
32:1272-1273, author reply 1274.
11. Gastrin B, Briem H, Rombo L:Rapid diagnosis of meningitis with use of selected clinical data and gas-liquid chromatographic determination of lactate concentration in cerebrospinal fluid.J Infect Dis1979,
139:529-533.
12. Ruuskanen O, Stahlberg ML, Korvenranta H, Nikoskelainen J, Irjala K:CSF lactate in bacterial meningitis with minimal CSF abnormalities.Acta Paediatr Scand1985,74:292-293.
13. Rajs G, Finzi-Yeheskel Z, Rajs A, Mayer M:C-reactive protein concentrations in cerebral spinal fluid in gram-positive and gram-negative bacterial meningitis.Clin Chem2002,48:591-592.
14. Viallon A, Pouzet V, Zeni F, Tardy B, Guyomarc’h S, Lambert C, Page Y, Bertrand JC:[Rapid diagnosis of the type of meningitis (bacterial or viral) by the assay of serum procalcitonin].Presse Med2000,29:584-588. 15. Moher D, Cook DJ, Eastwood S, Olkin I, Rennie D, Stroup DF:Improving
the quality of reports of meta-analyses of randomised controlled trials: the QUOROM statement. Quality of Reporting of Meta-analyses.Lancet 1999,354:1896-1900.
16. The PRISMA Statement.[http://www.plosmedicine.org/article/info%3Adoi% 2F10.1371%2Fjournal.pmed.1000100].
17. The PubMed Database.[http://www.ncbi.nlm.nih.gov/sites/entrez]. 18. Scopus.[http://www.scopus.com/home.url].
19. MEDION database.[http://www.mediondatabase.nl]. 20. Cochrane Library.[http://www.cochrane.org].
21. Chavanet P, Schaller C, Levy C, Flores-Cordero J, Arens M, Piroth L, Bingen E, Portier H:Performance of a predictive rule to distinguish bacterial and viral meningitis.J Infect2007,54:328-336.
22. Deville WL, Buntinx F, Bouter LM, Montori VM, de Vet HC, van der Windt DA, Bezemer PD:Conducting systematic reviews of diagnostic studies: didactic guidelines.BMC Med Res Methodol2002,2:9. 23. Pai M, McCulloch M, Enanoria W, Colford JM Jr:Systematic reviews of
diagnostic test evaluations: What’s behind the scenes?ACP J Club2004,
141:A11-13.
24. Lijmer JG, Mol BW, Heisterkamp S, Bonsel GJ, Prins MH, van der Meulen JH, Bossuyt PM:Empirical evidence of design-related bias in studies of diagnostic tests.JAMA1999,282:1061-1066.
26. Zamora J, Abraira V, Muriel A, Khan K, Coomarasamy A:Meta-DiSc: a software for meta-analysis of test accuracy data.BMC Med Res Methodol 2006,6:31.
27. Meta-Disc (version 1.4) software.[http://www.hrc.es/investigacion/ metadisc_en.htm].
28. Moses LE, Shapiro D, Littenberg B:Combining independent studies of a diagnostic test into a summary ROC curve: data-analytic approaches and some additional considerations.Stat Med1993,12:1293-1316.
29. Higgins JP, Thompson SG, Deeks JJ, Altman DG:Measuring inconsistency in meta-analyses.BMJ2003,327:557-560.
30. Galbraith RF:A note on graphical presentation of estimated odds ratios from several clinical trials.Stat Med1988,7:889-894.
31. Deeks JJ, Macaskill P, Irwig L:The performance of tests of publication bias and other sample size effects in systematic reviews of diagnostic test accuracy was assessed.J Clin Epidemiol2005,58:882-893.
32. Jones CM, Athanasiou T:Summary receiver operating characteristic curve analysis techniques in the evaluation of diagnostic tests.Ann Thorac Surg 2005,79:16-20.
33. Egger M, Davey Smith G, Schneider M, Minder C:Bias in meta-analysis detected by a simple, graphical test.BMJ1997,315:629-634.
34. Duval S, Tweedie R:Trim and fill: A simple funnel-plot-based method of testing and adjusting for publication bias in meta-analysis.Biometrics 2000,56:455-463.
35. Mengoli C, Cruciani M, Barnes RA, Loeffler J, Donnelly JP:Use of PCR for diagnosis of invasive aspergillosis: systematic review and meta-analysis.
Lancet Infect Dis2009,9:89-96.
36. The Comprehensive Meta-analysis software version 2.0.
[http://www.meta-analysis.com].
37. Abro AH, Abdou AS, Ali H, Ustadi AM, Hasab AAH:Cerebrospinal fluid analysis acute bacterial versus viral meningitis.Pak J Med Sci2008,
24:645-650 [http://pjms.com.pk/issues/octdec108/article/article1.html]. 38. Cameron PD, Boyce JM, Ansari BM:Cerebrospinal fluid lactate in
meningitis and meningococcaemia.J Infect1993,26:245-252. 39. Genton B, Berger JP:Cerebrospinal fluid lactate in 78 cases of adult
meningitis.Intensive Care Med1990,16:196-200.
40. Shaltout AA, Helal AA, Awadallah NB, Mughal HA, Johny M:Cerebrospinal fluid lactate is useful in differentiating viral from bacterial meningitis.
Medical Principles and Practice1989,1:12-16 [http://content.karger.com/ ProdukteDB/produkte.asp?doi=157274].
41. Donald PR, Malan C:Cerebrospinal fluid lactate and lactate
dehydrogenase activity in the rapid diagnosis of bacterial meningitis.S Afr Med J1986,69:39-42.
42. Nelson N, Eeg-Olofsson O, Larsson L, Ohman S:The diagnostic and predictive value of cerebrospinal fluid lactate in children with meningitis. Its relation to current diagnostic methods.Acta Paediatr Scand1986,75:52-57.
43. Low PS, Yip WC, Tay JS, Wong HB:Cerebrospinal fluid lactate–its diagnostic value in septic meningitis.J Singapore Paediatr Soc1986,
28:243-246.
44. Lester A, Stilbo I, Bartels P, Bruun B:Value of CSF lactate in the differential diagnosis between bacterial meningitis and other diseases with meningeal involvement.Acta Pathol Microbiol Immunol Scand ([B)1985,
93:21-25.
45. Vanprapar N, Chavalittamrong B, Limsathayurat N:Cerebrospinal fluid lactate level in childhood purulent meningitis.Southeast Asian J Trop Med Public Health1983,14:186-190.
46. Mandal BK, Dunbar EM, Hooper J, Parker L:How useful is cerebrospinal fluid lactate estimation in differential diagnosis of meningitis?J Infect 1983,6:231-237.
47. Ponka A, Ojala K, Teppo AM, Weber TH:The differential diagnosis of bacterial and aseptic meningitis using cerebrospinal fluid laboratory tests.Infection1983,11:129-131.
48. Briem H:Comparison between cerebrospinal fluid concentrations of glucose, total protein, chloride, lactate, and total amino acids for the differential diagnosis of patients with meningitis.Scand J Infect Dis1983,
15:277-284.
49. Berg B, Gardsell P, Skansberg P:Cerebrospinal fluid lactate in the diagnosis of meningitis. Diagnostic value compared to standard biochemical methods.Scand J Infect Dis1982,14:111-115.
50. Eross J, Silink M, Dorman D:Cerebrospinal fluid lactic acidosis in bacterial meningitis.Arch Dis Child1981,56:692-698.
51. Knight JA, Dudek SM, Haymond RE:Early (chemical) diagnosis of bacterial meningitis–cerebrospinal fluid glucose, lactate, and lactate
dehydrogenase compared.Clin Chem1981,27:1431-1434.
52. Curtis GD, Slack MP, Tompkins DS:Cerebrospinal fluid lactate and the diagnosis of meningitis.J Infect1981,3:159-165.
53. Lannigan R, MacDonald MA, Marrie TJ, Haldane EV:Evaluation of cerebrospinal fluid lactic acid levels as an aid in differential diagnosis of bacterial and viral meningitis in adults.J Clin Microbiol1980,11:324-327. 54. Lauwers S:Lactic-acid concentration in cerebrospinal fluid and
differential diagnosis of meningitis.Lancet1978,2:163.
55. Controni G, Rodriguez WJ, Hicks JM, Ficke M, Ross S, Friedman G, Khan W:
Cerebrospinal fluid lactic acid levels in meningitis.J Pediatr1977,
91:379-384.
56. Bland RD, Lister RC, Ries JP:Cerebrospinal fluid lactic acid level and pH in meningitis. Aids in differential diagnosis.Am J Dis Child1974,
128:151-156.
57. Uduman SA, Adeyemi E, El-Khadir A, Jose K, Benedict S, Bener A:
Haemophilus influenzae type B still remains a leading cause of meningitis among unvaccinated children–a prospective CSF analysis study.J Trop Pediatr2000,46:331-334.
58. Schwarz S, Bertram M, Schwab S, Andrassy K, Hacke W:Serum procalcitonin levels in bacterial and abacterial meningitis.Crit Care Med 2000,28:1828-1832.
59. Kleine TO, Zwerenz P, Zofel P, Shiratori K:New and old diagnostic markers of meningitis in cerebrospinal fluid (CSF).Brain Res Bull2003,61:287-297. 60. Wong GK, Poon WS, Ip M:Use of ventricular cerebrospinal fluid lactate
measurement to diagnose cerebrospinal fluid infection in patients with intraventricular haemorrhage.J Clin Neurosci2008,15:654-655. 61. Sommer JB, Gaul C, Heckmann J, Neundorfer B, Erbguth FJ:Does lumbar
cerebrospinal fluid reflect ventricular cerebrospinal fluid? A prospective study in patients with external ventricular drainage.Eur Neurol2002,
47:224-232.
62. Busse O, Hoffmann O:CSF lactate and CT findings in middle cerebral artery infarction. A comparative study.Stroke1983,14:960-963. 63. Fujishima M, Sugi T, Choki J, Yamaguchi T, Omae T:Cerebrospinal fluid
and arterial lactate, pyruvate and acid-base balance in patients with intracranial hemorrhages.Stroke1975,6:707-714.
64. Simpson H, Habel AH, George EL:Cerebrospinal fluid acid-base status and lactate and pyruvate concentrations after convulsions of varied duration and aetiology in children.Arch Dis Child1977,52:844-849.
65. Yao H, Sadoshima S, Nishimura Y, Fujii K, Oshima M, Ishitsuka T,
Fujishima M:Cerebrospinal fluid lactate in patients with diabetes mellitus and hypoglycaemic coma.J Neurol Neurosurg Psychiatry1989,52:372-375. 66. Menkes JH:The causes for low spinal fluid sugar in bacterial meningitis:
another look.Pediatrics1969,44:1-3.
67. Paulson OB, Hansen EL, Kristensen HS, Brodersen P:Cerebral blood flow, cerebral metabolic rate of oxygen and CSF acid-base parameters in patients with acute pyogenic meningitis and with acute encephalitis.
Acta Neurol Scand Suppl1972,51:407-408.
68. Posner JB, Plum F:Independence of blood and cerebrospinal fluid lactate.Arch Neurol1967,16:492-496.
69. Bosman J, Mourik I, Rasch Mv, Sieverts E, Verhoeff H:Scopus reviewed and compared. The coverage and functionality of the citation database Scopus, including comparisons with Web of Science and Google Scholar.Utrecht University Library2006 [http://igitur-archive.library.uu.nl/ DARLIN/2006-1220-200432/Scopus%20doorgelicht%20%26%20vergeleken% 20-%20translated.pdf].
70. Sterne JA, Juni P, Schulz KF, Altman DG, Bartlett C, Egger M:Statistical methods for assessing the influence of study characteristics on treatment effects in‘meta-epidemiological’research.Stat Med2002,
21:1513-1524. doi:10.1186/cc9395
Cite this article as:Huyet al.:Cerebrospinal fluid lactate concentration