Volume 2011, Article ID 724697,8pages doi:10.1155/2011/724697
Research Article
Evaluation of Methods for Estimating
Fractal Dimension in Motor Imagery-Based
Brain Computer Interface
Chu Kiong Loo,
1Andrews Samraj,
2and Gin Chong Lee
31Faculty of Computer Science and Information Technology, University of Malaya,
50603 Kuala Lumpur, Malaysia
2School of Computing Science and Engineering, VIT University, Chennai Campus,
Vandalor-Kellambakkam Road, Chennai 48, India
3Faculty of Engineering and Technology, Multimedia University, Jalan Ayer Keroh Lama,
75450 Malacca, Malaysia
Correspondence should be addressed to Chu Kiong Loo,[email protected]
Received 12 July 2011; Accepted 19 October 2011
Academic Editor: Xiaohui Liu
Copyrightq2011 Chu Kiong Loo et al. This is an open access article distributed under the Creative Commons Attribution License, which permits unrestricted use, distribution, and reproduction in any medium, provided the original work is properly cited.
A brain computer interface BCI enables direct communication between a brain and a computer translating brain activity into computer commands using preprocessing, feature extraction, and classification operations. Feature extraction is crucial, as it has a substantial effect on the classification accuracy and speed. While fractal dimension has been successfully used in various domains to characterize data exhibiting fractal properties, its usage in motor imagery-based BCI has been more recent. In this study, commonly used fractal dimension estimation methods to characterize time series Katz’s method, Higuchi’s method, rescaled range method, and Renyi’s entropy were evaluated for feature extraction in motor imagery-based BCI by conducting offline analyses of a two class motor imagery dataset. Different classifiers fuzzy k-nearest neighbours FKNN, support vector machine, and linear discriminant analysis were tested in combination with these methods to determine the methodology with the best performance. This methodology was then modified by implementing the time-dependent fractal dimension TDFD, differential fractal dimension, and differential signals methods to determine if the results could be further improved. Katz’s method with FKNN resulted in the highest classification accuracy of 85%, and further improvements by 3% were achieved by implementing the TDFD method.
1. Introduction
Movement, movement preparation, and motor imagery desynchronize SMRs, whereas during relaxation or postmovement, they are synchronized 1. Since motor imagery does not require any muscular activity, motor imagery-regulated SMRs are commonly utilized in BCI 2, 3. This is particularly beneficial for people with neurological disorders, since their voluntary muscular activities might be impaired. Another advantage of the utilization of motor imagery-regulated SMRs in BCI is the short training period required 4. Motor imagery tasks are identified by detecting the synchronization and desynchronization of SMRs. The most common motor imagery tasks are imagery hand5, foot4, and tongue 3movements. Once acquired, SMRs are analyzed using preprocessing, feature extraction, and classification operations.
Feature extraction is the process of accurately simplifying the representation of data by reducing its dimensionality while extracting its relevant characteristics for the desired task. It has a substantial effect on the classification accuracy and speed, since classification carried out without a successful feature extraction process on a high dimensional and redundant data would be computationally complex and would overfit the training data. Fractal dimension is a statistical measure indicating the complexity of an object or a quantity that is self-similar over some region of space or time interval. It has been successfully used in various domains to characterize such objects and quantities6,7, but its usage in motor imagery-based BCI has been more recent8,9. There are several fractal dimension estimation methods, some of which are not applicable to all types of data exhibiting fractal properties. In order to achieve a higher classification accuracy and speed, the fractal dimension estimation method that is most suitable to the data at hand should be chosen.
In this study, Katz’s method10, Higuchi’s method11, the rescaled range R/S
method 12, and Renyi’s entropy 13 were evaluated for feature extraction in motor imagery-based BCI by conducting offline analyses of a two-class motor imagery dataset. Fuzzy k nearest neighborsFKNN, support vector machineSVM, and linear discriminant analysis LDAwere tested in combination with these methods to determine the method-ology with the best performance. This methodmethod-ology was then modified by implementing time-dependent fractal dimension TDFD 14, differential fractal dimension,DFDand differential signalsDS 15.
2. Materials and Methods
2.1. Dataset
2.2. Preprocessing
The samples from each electrode were zero phase filtered using a 6th-order bandpass digital Butterworth filter with cutofffrequencies of 0.5 and 30 Hz in both the forward and reverse directions. The last six seconds of each trial were extracted to discard the period without any motor imagery. Two different electrode configurationsC3 and C4, and C3, Cz, and C4were tested.
2.3. Feature Extraction
In Katz’s method, Higuchi’s method, and the R/S method, the fractal dimension of the samples from selected electrodes were concatenated into feature vectors. In the TDFD, DFD, and DS methods, the fractal dimensions were estimated using the fractal dimension estimation method of the methodology with the best performance.
2.3.1. Katz’s Method
Katz’s method 10 calculates the fractal dimension of a sample as follows: the sum and average of the Euclidean distances between the successive points of the sample L anda, resp.are calculated as well as the maximum distance between the first point and any other point of the sampled. The fractal dimension of the sampleDthen becomes
D logL/a
logd/a
logn
logn logd/L, 2.1
wherenisLdivided bya.
2.3.2. Higuchi’s Method
Higuchi’s method 11 calculates the fractal dimension of a sample as follows: first, sub-sample setsXkare constructed from the sampleXas
Xm
k {Xm ik}
N−m/k
i0 , 2.2
wherek ∈1,kmax,m ∈1, kandNis the sample size. Then, the length of eachXkLmis calculated as
Lmk
N−m/k
i1 |Xm ik−Xm i−1k|N−1/N−m/kk
k . 2.3
Finally, the fractal dimension of the sampleDis solved from
whereLis the average ofLm. Threekmaxvalues from the range of 8 to 1816 8, 13, and 18were tested.
2.3.3. R/S Method
The R/Smethod 12calculates the fractal dimension of a sample by iteratively dividing it into nonoverlapping subsamples with decreasing subsample size and performing the following operations at each iteration: for each subsample, a new subsample X is constructed from its zero meanξsuch that thenth point ofXis the cumulative sum of the firstnpoints ofξ. Then, the difference between the maximum and the minimum values, and the standard deviation ofXRandS, resp.are calculated in order to obtain their ratioR/S. Finally,R/Sof eachXis averagedR/Savg. After obtainingR/Savgat each iteration, the Hurst exponentHbecomes the slope of the log-log plot ofR/Savgversus subsample size. The fractal dimension then becomes 2−H.
2.3.4. Renyi’s Entropy
Renyi’s entropy13is generalization of Shannon’s entropy. Renyi’s entropy is defined as
Rq 1
1−qlog2 n
i1
pqi
, 2.5
where q > 0, q /1. However, R1 exists and the value is subset of Shannon’s entropy. Therefore, Shannon’s entropy is limit case toRqwhenq1
lim
q→1Rq S. 2.6
This is the fractal dimension on the basic of Renyi’s entropy
Dq lim
δx→0 1 1−qlog2
log2ni1pqi
log2δx , 2.7
can be replaced with faster algorithm
Dq lim
δx→0
log2ni1Nqi −qlog2N
log2δx . 2.8
2.3.5. TDFD Method
2.3.6. DFD and DS Methods
The DFD method is a variation of the DS method. In the DFD method, first, the fractal dimensions of the samples from selected electrodes are estimated, and then, the pairwise differences of the fractal dimensions are calculated. However, in the DS method15, first, the pairwise differences of the samples from selected electrodes are calculated, and then, the fractal dimensions of the pairwise differences are estimated. In both methods, the resultant values were concatenated into feature vectors. Only the three electrode configuration was tested, since the two electrode configuration results in one-dimensional feature vectors.
2.4. Classification
After constructing the feature vectors, the test samples were classified as imagery left or right hand movements using different classifiers. FKNN, SVM, and LDA were tested.
FKNN is a variation of KNN. The main difference between the two is that KNN assigns a class label to a sample that is most frequent among the k nearest neighbors of that sample, whereas FKNN assigns a membership value for each class in this neighborhood and classifies the sample as the class with the highest membership value. The membership value for a class was calculated by dividing the sum of the distances between the samples belonging to this class and the test sample by the sum of the distances between all the samples in the neighborhood and the testing sample. Number of nearest neighbors between one and the square root of the sample length were tested.
SVM separates the samples using a hyperplane that maximizes the margin between those belonging to different classes. SVM with a linear kernel was used.
LDA finds a linear combination of features that best separates the samples belonging to different classes and can be used as a classifier. To assign a class label to a sample, the probabilities of the sample belonging to each class were estimated using LDA. The label of the class with the highest probability was then assigned to the sample.
3. Results
The classification accuraciesTable 1and the computation timesTable 2were evaluated for each fractal dimension calculation method and classifier combination. Katz’s method was the fastest method, and combining it with FKNN, the highest classification accuracy of 85%the three electrode configuration andk9as well as the second highest classification accuracy of 83%the two electrode configuration andk 9were achieved.R/Smethod with any classifier performed the slowest with the classification accuracies and the computation times ranging from 69% to 71% and 7.32 to 11.07 s, respectively. On the other hand, Renyi’s entropy with any classifier performed the worst with the classification accuracies and the computation times ranging from 55% to 66% and 1.84 to 4.87 s, respectively. The performances of the rest of the combinations were similarTables1 and2. The classification accuraciesexcept for theR/Smethod and Renyi’s entropyand computation timesexcept for theR/Smethod increased with the number of the number of selected electrodes.
Table 1: Maximum classification accuraciespercentage of correctly classified testing samplesobtained by the combination of fractal dimension estimation methods and classifiers with the two and three electrode configurationsand the parametersk and kmaxused to obtain these values.
Classification accuracy%
Katz’s method Higuchi’s method R/S method Renyi’s entropy C3, C4 C3, Cz,
C4 C3, C4 C3, Cz, C4 C3, C4
C3, Cz,
C4 C3, C4
C3, Cz, C4
FKNN 83
k9 85
k9
77
k7,
kmax18
79
k5,
kmax18
71
k9 69
k9 66
k9,
q4
65
k9,
q5 SVM 77 79 78
kmax13
81
kmax13 71 70
59
q2 q554
LDA 78 81 78
kmax13
79
kmax13 71 70
59
q3
57
[image:6.600.100.504.328.455.2]q18
Table 2: Computation timestime it took for feature extraction and classificationcorresponding to the maximum classification accuracies obtained by the combination of fractal dimension estimation methods and classifiers with the two and three electrode configurationsand the parametersk and kmaxused to
obtain these values.
Computation times
Katz’s method Higuchi’s method R/S method Renyi’s entropy C3, C4 C3, Cz,
C4 C3, C4 C3, Cz, C4 C3, C4
C3, Cz,
C4 C3, C4
C3, Cz, C4
FKNN 0.17
k9 k0.239
1.03
k7,
kmax18
1.5
k5,
kmax18
7.37
k9 11.07k9
2.35
k9,
q4
2.60
k9,
q5 SVM 0.34 0.34 1.07
kmax13
1.4
kmax13 7.36 10.99
1.90
q2
4.87
q4 LDA 0.12 0.21 0.83
kmax13
1.26
kmax13 7.32 10.99
1.84
q3 q3.0118
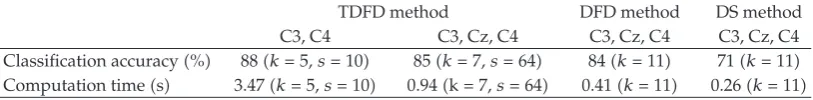
Table 3: Computation times and classification accuracies obtained by modifying the highest performing
methodologyKatz’s Method with FKNN and the parametersk and sused to obtain these values. TDFD method DFD method DS method C3, C4 C3, Cz, C4 C3, Cz, C4 C3, Cz, C4 Classification accuracy% 88k5,s10 85k7,s64 84k11 71k11 Computation times 3.47k5,s10 0.94k7,s64 0.41k11 0.26k11
only by implementing TDFD method the two channel configuration, k 5 and s 10. However, implementing the DFD and DS methods resulted in lower classification accuracies. Mental activity may modulate FD of EEG signal which implies that it is timed-ependent in nature. By implementing TDFD method in Katz’s Method with FKNN, we may measure the fractality in short time intervals of time-sequential data from one end of the waveform to the other sequentially, and we may observe the dynamical changes in the FDs with respect the time series. These FDs, namely, are referred to the time-dependent fractal dimensionsTDFD 17,18.
[image:6.600.97.504.499.549.2]accurate estimation of signal FD, when tested on synthetic data, but it is more sensitive to noise. In the experiment, EEG datasets used are real data sets which contain noise, hence Katz’s method exhibits better result19.
4. Conclusions
Since all fractal dimension estimation methods are not applicable to all types of data ex-hibiting fractal properties, commonly used fractal dimension estimation methods to char-acterize time series with different classifiers were evaluated to find the most suitable method for motor imagery data. Katz’s method with FKNN was determined to be the best meth-odology, and the results were further improved by implementing the TDFD method. The results warrant further research to use this methodology in online analysis of motor imagery data and analysis of other signals.
Acknowledgments
The authors would like to thank Alfonsius Geraldi, Umut G ¨uc¸l ¨ua, and Ya ˘gmur G ¨uc¸l ¨ut ¨urkaal and also gratefully acknowledge the helpful comments and suggestions of the reviewers.
References
1 A. K ¨ubler and K. M ¨uller, “An introduction to brain-computer interfacing,” in Toward Brain-Computer
Interfacing, G. Dornhege, J. D. R. Millan, T. Hinterberger, D. J. McFarland, and K. M ¨uller, Eds., pp.
1–25, The MIT Press, Boston, Mass, USA, 2007.
2 V. Jeyabalan, A. Samraj, and L. C. Kiong, “Classification of motor imaginary signals for machine commmunication: a novel approach for brain machine interface design,” in Proceedings of the
International Conference on Signal Acquisition and Processing (ICSAP ’09), pp. 34–38, IEEE Computer
Society, Los Alamitos, Calif, USA, 2009.
3 G. Pfurtscheller, C. Brunner, A. Schl ¨ogl, and F. H. Lopes da Silva, “Mu rhythmdesynchronization and EEG single-trial classification of different motor imagery tasks,” NeuroImage, vol. 31, no. 1, pp. 153–159, 2006.
4 G. R. M ¨uller-Putz, R. Scherer, G. Pfurtscheller, and R. Rupp, “EEG-based neuroprosthesis control: a step towards clinical practice,” Neuroscience Letters, vol. 382, no. 1-2, pp. 169–174, 2005.
5 G. Pfurtscheller, C. Neuper, A. Schlogl, and K. Lugger, “Separability of EEG signals recorded during right and left motor imagery using adaptive autoregressive parameters,” IEEE Transactions
on Rehabilitation Engineering, vol. 6, no. 3, pp. 316–325, 1998.
6 Y. Nakamura, Y. Yamamoto, and I. Muraoka, “Autonomic control of heart rate during physical exercise and fractal dimension of heart rate variability,” Journal of Applied Physiology, vol. 74, no. 2, pp. 875–881, 1993.
7 E. E. Peters, Fractal Market Analysis: Applying Chaos Theory to Investment and Economics, John Wiley & Sons, New York, NY, USA, 1994.
8 R. Boostani and M. H. Moradi, “A new approach in the BCI research based on fractal dimension as feature and Adaboost as classifier,” Journal of Neural Engineering, vol. 1, no. 4, pp. 212–217, 2004.
9 M. Phothisonothai and M. Nakagawa, “EEG-based classification of motor imagery tasks using fractal dimension and neural network for brain-computer interface,” IEICE Transactions on Information and
Systems, vol. E91-D, no. 1, pp. 44–53, 2008.
10 M. J. Katz, “Fractals and the analysis of waveforms,” Computers in Biology and Medicine, vol. 18, no. 3, pp. 145–156, 1988.
11 T. Higuchi, “Approach to an irregular time series on the basis of the fractal theory,” Physica D, vol. 31, no. 2, pp. 277–283, 1988.
13 A. R´enyi, “On a new axiomatic theory of probability,” Acta Mathematica Academiae Scientiarum
Hun-garicae, vol. 6, no. 3-4, pp. 285–335, 1955.
14 S. Sabanal and M. Nakagawa, “A study of time-dependent fractal dimensions of vocal sounds,”
Journal of the Physical Society of Japan, vol. 64, no. 9, pp. 3226–3238, 1995.
15 I. Takuya and N. Masahiro, “An application of EEG analyses based on fractal theory to emotion information processing,” IEICE Technical Report, vol. 104, no. 753, pp. 53–58, 2005.
16 S. Spasi´c, A. Kalauzi, M. ´Culi´c, G. Grbi´c, and L. Marta´c, “Estimation of parameter kmax in fractal analysis of rat brain activity,” Annals of the New York Academy of Sciences, vol. 1048, pp. 427–429, 2005.
17 A. Bashashati, R. K. Ward, G. E. Birch, M. R. Hashemi, and M. A. Khalilzadeh, “Fractal dimension-based EEG biofeedback system,” in Proceedings of the 25th Annual International Conference of the IEEE
Engineering in Medicine and Biology Society (EMBS ’03), pp. 2220–2223, September 2003.
18 M. Phothisonothai and M. Nakagawa, “EEG signal classification method based on fractal features and neural network,” in Proceedings of the 30th Annual International Conference of the IEEE Engineering
in Medicine and Biology Society (EMBS ’08), pp. 3880–3883, Vancouver, Canada, August 2008.
19 R. Esteller, G. Vachtsevanos, J. Echauz, and B. Litt, “Comparison of fractal dimension algorithms using synthetic and experimental data,” in Proceedings of the IEEE International Symposium on Circuits