Smart Compression for Telemedicine
Ershad Sharifahmadian, Shahram Latifi
Department of Electrical and Computer Engineering University of Nevada, Las Vegas
4505 Maryland Parkway Las Vegas, NV 89154-4026
ABSTRACT
In many applications in which a huge amount of data is transmitted, and the data is processed in real time, data compression is crucial. Here, a smart compression method based on the wavelet subbands arranging technique is proposed for telemedicine. The proposed method can effectively reduce the large amount of transmitted data, and provide real-time analysis. Moreover, if available bandwidth drops, the proposed method is capable of tuning the rate of compressed data, and different input channels are simultaneously compressed with different rates, as well as the quality of each compressed data is preserved. The proposed method is tested on selected records from the MIT-BIH arrhythmia database. Based on results, it is concluded that the proposed approach is an appropriate choice to intelligently and simultaneously compress large amount of multichannel data, is able to tune compressed data rate to preserve the required quality of output, and to use the bit capacity of every input channel efficiently.
Keywords
Intelligent system, Smart compression, Wavelet based compression, WSAT.
1. INTRODUCTION
When voluminous amount of data is produced by medical instruments, the data either processed by recording facilities or transmitted to a control center for observation and further processing. The traffic to/from the control center is high due to active users.
It is not always possible to increase bandwidth to support all users, and provide good service for them. However, one solution to efficiently use the bandwidth is the data compression with high accuracy and low error.
Tcheou and his colleagues attempted to bring the attention to a challenging research problem for automation, measurement and control of power systems. Special attention was given to compression techniques for electric signals [1]. The need for introduction of powerful compression techniques for smart grid applications, and some of the most important research challenges were addressed. It was emphasized that signal compression is crucial to come up with smarter grids for smart sensing, monitoring, and protection in the next generation of electric systems [1].
At the institute of applied physics and computational mathematics in Beijing, China [2], researchers proposed a smart compression method based on information theory used to accelerate the large-scale time-varying volume rendering. The approach can automatically process the importance of each sub-block in volume, then help users analyze and extract features from the huge data. The two-stage compression is used for non-critical data discarding and lossy data compression, and the subsequent data transfer is only operated on these feature data in the visualization pipeline, so the bandwidth bottleneck can be eased [2].
In this paper, a smart compression approach is proposed to reduce the large amount of medical data transmitted and use available bandwidth effectively. Here, the method is applied on clinical data for the application of telemedicine. However, the proposed method can be applied for different applications in which a huge amount of data needs to be transmitted and processed in real-time [3]–[6].
Before explaining the proposed approach, it is necessary to define some criteria. The percent root mean square difference (PRD) is used as the evaluation criterion for the fidelity of reconstructed data. The PRD is expressed as follows:
(1)
where is the ith sample from original input data, is its reconstructed sample, and Ns is the number of samples in the original input data [7].
To test the redundancy removing ability of compression techniques, the compressed data rate or CDR (bits/s) is utilized:
(2)
where is the sampling rate (samples/sec), and is the total number of bits to be transmitted or stored after compression [7], [8], [9].
In the following section, smart compression based on the wavelet subbands arranging technique is explained. In section 3, the proposed method is tested by selected data from the MIT-BIH arrhythmia database. The section 4 concludes the paper.
2. PROPOSED METHOD
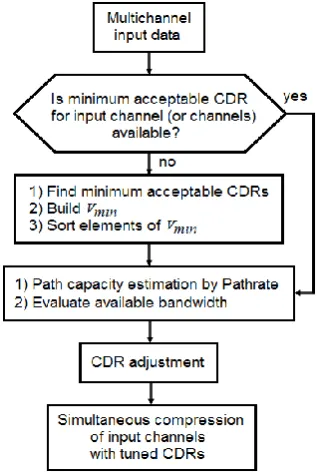
The proposed smart compression method includes different phases which are illustrated in figure 1.
2.1. Finding Minimum Acceptable CDR
In this phase, the proposed method tries to determine the compressed data rate corresponding to a predefined error; the predefined error is the maximum acceptable PRD for which clinical information of decompressed input channels is preserved. Whereas the type of data for each input channel and its maximum acceptable error are known, the CDR (i.e. minimum acceptable CDR) corresponding to the maximum acceptable error is calculated for every input data.
To calculate the minimum acceptable CDR for each input data, a small part of every input is selected as training set and is compressed by wavelet subbands arranging technique (WSAT) [14].
Ns
B
R
CDR
s
Aftercompression100 ) ˆ (
1 2 1
2
Ns
i i
Ns
i i i
Then, a vector called including the values of minimum acceptable CDRs for all input channels is built. Afterwards, elements of the are sorted based on the value of CDRs.
Figure 1. Schematic of the proposed method
2.2.
Evaluating
Available
Bandwidth
The path capacity is the maximum IP-layer throughput that a flow can get in the network path from a sender station to a receiver station [10].
The available path capacity depends on the data rate used by each active system, the number of active systems, unsuccessful transmissions, etc.
To estimate the path capacity, the tool called Pathrate is utilized [11]. The main advantage of Pathrate is that it is robust to cross traffic effects. In other words, Pathrate can estimate the path capacity even when the path is loaded significantly.
The route that the path follows should be unique during measurements. The path capacity is calculated by the link with the minimum transmission rate. Pathrate is an end-to-end capacity estimation tool, and utilizes pairs and packet-trains to estimate the path capacity.
Pathrate uses UDP (i.e. User Datagram Protocol) packets for the packet-pairs and packet-trains, and a TCP connection for exchange of control information. Pathrate can be run from user-space, and it does not require superuser privileges. Pathrate operates as follows [10]:
Step 1: Pathrate finds the maximum train-length that the path can handle. Overloading the path with long packet trains is prevented because long packet trains would lead buffer overflows and losses. Pathrate transmits a few packet trains of increasing length named as preliminary measurements, to determine if the narrow link has parallel sub-channels, or if it performs traffic shaping.
The main goal of preliminary measurements is the calculation of the bandwidth resolution.
Step 2: Pathrate produces a large number of packet-pairs to find all local modes in the packet-pair bandwidth distribution. The packets sent by Pathrate have variable size, to make the non-capacity local modes weaker and wider.
Step 3: In this step, the Asymptotic Dispersion Rate (ADR), measured with long packet trains, is estimated. ADR is a lower bound of the capacity and an upper bound of the available bandwidth [11].
Finally, Pathrate estimates the capacity of the path.
The available bandwidth, , which is distributed among the different flows during a certain period τ is formulated as [12], [13]:
(3)
where is the bandwidth utilized for the last period τ, and are constant, C is the estimated path capacity, and Q(t) is the minimum queue length happened during the last period τ. The parameter τ can be expressed as follows:
(4)
where is the actual capacity of the path, and is the system base delay or the delay excluding the queuing delay.
The error of path capacity estimation is expressed as
and it should be compensated up to a certain limit. When the capacity of the path is fully utilized, it is expected that the available bandwidth to be zero or close to zero. Thus, the estimation error limit is expressed as [12]:
(5)
2.3. CDR Adjustment
If the available bandwidth drops due to any reason, it leads to delay in data transmission. This situation is very risky if it happens during continues healthcare monitoring. Thus, the proposed method reduces the rate of compressed data for input channels corresponding to the dropped bandwidth.
The process of CDR reduction for input channels is tunable. In other words, if CDR reduction for one or more input channels lead to losing the quality of compressed data― decreasing CDR for an input may cause a CDR value less than its minimum acceptable CDR value from ― then, the proposed method tries to tune the rate of compressed data.
After CDR reduction, if an input channel has a CDR value less than its minimum acceptable CDR value, the channel is called as weak channel.
To tune the CDR value of weak channels, the proposed method reconsiders the input channels which have less minimum acceptable CDR than the CDR of weak channels (called strong channels). Then, to moderate the CDR reduction in weak channels, the CDR of the strong channels is decreased. In other words, different channels are prepared to simultaneously compress with different CDR, and the quality of each compressed data is kept.
2.4. Simultaneous Compression
To simultaneously compress input channels the wavelet subbands arranging technique (WSAT) is used.
Before encoding, the wavelet transform is applied on input data. During the wavelet decomposition, the original input data is passed through low pass and high pass filters. Then, the outputs filtered are down-sampled to generate wavelet coefficients distributed in an approximation subband and a detail subband (or subbands) [15].
which is the threshold of the Nth wavelet subband is expressed as follows:
(6)
where is the wavelet coefficient at location i [16].
2
log
2(
i Nthsubband i)
N
w
Max
Thr
real
C
a
a
)
(
1 2
)
)
(
(
))
(
(
21
t
Q
a
t
B
C
a
F
available
utilized
real
C
Q
Among the calculated thresholds, the largest threshold is selected as the initial operation threshold [14].
Wavelet coefficients with larger magnitude are typically placed in low frequency wavelet subbands [17]. Arranged wavelet subbands of input channels lead to more efficient multichannel compression, because appropriate parent-offspring relations among coefficients of wavelet subbands are hierarchically constructed [14].
To compress multichannel data, first, the subbands of input channels are appropriately rearranged. To rearrange the subbands, the largest threshold from each channel is calculated by equation (6). Among input channels, a channel with the largest threshold is selected (it is called initial channel). The second chosen channel has threshold larger than that of residual channels but its threshold is smaller than that of the initial channel. This procedure continues till all channels are chosen.
Therefore, a new structure is built in which the approximation and detail subbands of selected channels are rearranged and sorted.
Then, the coefficients are rearranged in hierarchies, with roots are in the lowest wavelet frequency subband, and branching into higher wavelet frequency subbands consecutively.
In the hierarchical form, Des(i) is defined as the set of all descendants of a node placed at location i, which is named as the set of type I. Ex(i) is defined as the set of all descendants excluding offspring of a node placed at location i, which is named as the set of type II.
After choosing the initial operation threshold, the given threshold is compared with the threshold of each subband. This process is performed from the high frequency subbands to the low frequency subbands, and the process will be finished if the threshold of a subband becomes equal to the initial operation threshold for first time [14]. Then, the location of the last coefficient from the wavelet subband where comparison was performed up to, is saved. The given location (named as frontier) limits evaluation by which the significance of Ex(i) or Des(i) is obtained [16].
During compression procedure, the main information about the wavelet coefficients is sorted as follows:
CAT1: The category of locations relating to wavelet coefficients that have magnitude smaller than a given threshold. CAT2: The category of locations relating to wavelet coefficients that have magnitude larger than/equals to a given threshold.
CAT3: A two-column matrix including the category of locations corresponding to the sets of the wavelet coefficients placed in hierarchical form; those sets have magnitude smaller than a given threshold.
The coefficients are compressed during several scans. During every scan, the wavelet coefficients with magnitudes which are larger than a certain threshold are compressed.
At first, the CAT2 is set as empty. If the length of approximation subband (i.e. ) is even, the locations of {0 to
} will be placed into the CAT1, and the locations of { to }, will be placed into the CAT3 as type I. If the length of approximation subband is odd, the locations of {0 to } will be placed into the CAT1, and the locations of { to }, will be placed into the CAT3 as type I.
A wavelet coefficient relating to the CAT1 is significant if the coefficient is larger than/equal to the current operation threshold. Therefore, a one is sent with a sign bit, and its location placed to the CAT2. If the coefficient is not significant, a zero is sent and its location saved until the next compression level. For the negative sign, the sign bit is set as 0, otherwise the sign bit is set as 1.
After checking the CAT1, coefficients relating to the CAT3 are processed.
When all sets in the first column of the CAT3 are checked, Ex(i) in the second column of the CAT3 are checked.
Before evaluation of each Ex(i), the two offspring, direct descendants of a wavelet coefficient at location i, are reconsidered. These direct children of a tree node at position i are used to improve the evaluation of Ex(i)s. If these direct children are smaller than the current operation threshold, those are selected as new entries of type I, and directly moved to the first column of the CAT3. Therefore, evaluation of Ex(i) is not performed. If at least one of the direct children is larger than/equal to the current operation threshold, evaluation of Ex(i) is done. In this case, if Ex(i) is not significant, a zero is sent. Then, the Ex(i) is omitted from the second column of the CAT3, its type and location are saved until the next compression level.
If the set of type II is significant, a one is sent. Then, its two offspring are chosen as new sets of type I and moved to the first column of the CAT3. The Ex(i) is subsequently omitted from the second column of the CAT3.
When all Ex(i)s in the second column of the CAT3 were checked, new Des(i)s in the first column of the CAT3 are checked. The evaluation of the CAT3 is finished when no new Des(i) moved to the first column of the CAT3.
After the CAT3 evaluated, the CAT2 is checked. Every old entry of the CAT2 is evaluated. When an old entry of the CAT2 is significant over the current operation threshold, a zero is sent, otherwise a one is sent.
After evaluating the CAT2, the magnitude of all coefficients for which their locations placed in the CAT2 and are larger than the current operation threshold, are subtracted by the current operation threshold.
Afterwards, the current operation threshold is halved, the evaluation of CAT1, CAT3, and CAT2 are repeated as far as the desirable bit rate is achieved.
3. RESULTS
To show the efficiency of the proposed method, it is supposed that quick extreme reduction of the bandwidth happens. Then, clinical input data are intelligently compressed by the proposed method.
The ECG records as input channels are selected from the MIT-BIH arrhythmia database [18]. The resolution of each sample is set as 11 bits per sample. The sampling rate is 360 samples per second.
ECG signals are non-stationary, each heart beat cycle consists of QRS complex, P, T, S-T segment, baseline, etc. The QRS complex, P, and T are most useful in clinical diagnosis. The major energy of the P and T waves are below 5 Hz, and the major energy of the QRS complex is between 5 to 15 Hz. Therefore, the type of filter bank and the number of wavelet decomposition levels should be appropriately selected. The biorthogonal 9/7 tap filters are chosen, and a 5-level wavelet decomposition is utilized [19], [20].
As recommended by the American Heart Association (AHA) for routine visual readings of compressed and reconstructed ECG signals, the PRD value may not exceed 5% [21].
The average percent root mean square difference (APRD) is utilized to evaluate the reconstructed signals in multichannel compression [7], [14].
It is supposed 14 dual channel ECG records (data in record numbers: 100, 104, 107, 111, 112, 115, 116, 117, 118, 119, 121, 213, 214, and 231) from the MIT-BIH arrhythmia database are compressed and transmitted.
First, the proposed method processes each input channel, and calculates minimum acceptable CDR value for every input channel. Table 1 demonstrates the values of minimum acceptable CDR for all selected input channels. In fact, if the CDR value of an input channel becomes less than the minimum acceptable CDR in for that channel, the PRD value exceeds 5% for the given channel.
With the bit rate of 7Kbps, each of 14 ECG inputs can be compressed with the CDR value of 500bps, and the quality of all ECG signals is preserved.
If available bandwidth suddenly drops 50%, the proposed method changes the CDR value of every input channel from 500 to 250 bps.
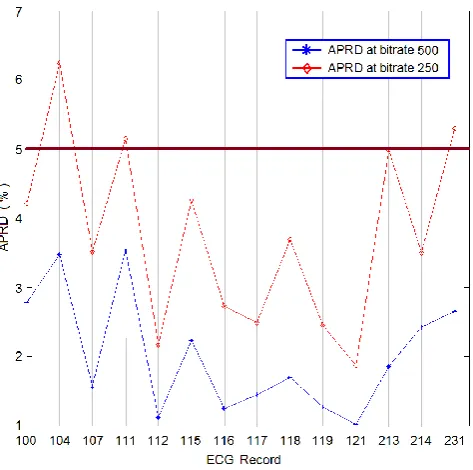
[image:4.595.308.545.73.308.2]However, if the CDR value changes from 500 to 250 bps, based on Table 1, the quality of ECG signals from the input channel of 2, 4, and 14 (i.e. record numbers: 104, 111, 231) will not be preserved after compression (Figure 2). In other words, the minimum acceptable CDR for the given channels (i.e. weak channels) is above 250bps, and the PRD of reconstructed ECG signals for the input channel of 2, 4, and 14 will be more than 5% at new CDR (i.e. 250bps).
Table 1
The value of minimum acceptable CDR for 14 ECG records from MIT-BIH arrhythmia database
Input # ECG Record
Minimum Acceptable CDR
(bps)
1 100 207
2 104 314
3 107 204
4 111 264
5 112 127
6 115 197
7 116 149
8 117 126
9 118 196
10 119 145
11 121 107
12 213 246
13 214 182
14 231 262
Therefore, the proposed method starts tuning the CDR of weak channels. To do that, the method selects the strong channels from the sorted .
Table 2 demonstrates the sorted .
To tune the CDR of the weak channels, the proposed method selects the input channel of 11, 8, and 5 as strong channel. Then, these channels will give a part of their bit capacity to the weak channels (i.e. the input channel of 2, 4, and 14). In other words, the CDR of the input channel of 11, 8, and 5 reduces to less than 250 bps, so the weak channels can use the bit capacity of the input channel of 11, 8, and 5. Therefore, the quality of reconstructed signals related to the weak channels is preserved.
[image:4.595.52.289.325.493.2]The final values of CDR for all input channels after tuning the CDR of the weak channels, are presented in Table 3.
[image:4.595.323.527.363.538.2]Figure 2. APRD values for selected records at 500 and 250 bps; the PRD of reconstructed ECG signals for the record number of 104, 111, 231 is more than 5% at 250 bps.
Table 2The sorted
Input # ECG Record
Minimum Acceptable CDR
(bps)
2 104 314
4 111 264
14 231 262
12 213 246
1 100 207
3 107 204
6 115 197
9 118 196
13 214 182
7 116 149
10 119 145
5 112 127
8 117 126
11 121 107
In Table 4, the APRD values for the selected ECG records are presented corresponding to final CDRs.
Based on Table 4, the PRD values of all input channels will be equal or less than 5%. Therefore, the quality of reconstructed ECG signals is preserved, even after quick extreme bandwidth reduction.
Table 3The final value of CDR for 14 input channels
Input # ECG Record Final Operation CDR (bps)
1 100 250
2 104 314
3 107 250
4 111 264
5 112 238
6 115 250
7 116 250
8 117 236
9 118 250
10 119 250
11 121 186
12 213 250
13 214 250
[image:5.595.65.274.216.484.2]14 231 262
Table 4The APRD values for selected ECG records corresponding to final CDRs
ECG Record
Final Operation CDR (bps)
APRD (%)
100 250 4.2
104 314 5
107 250 3.5
111 264 5
112 238 2.2
115 250 4.2
116 250 2.7
117 236 2.5
118 250 3.6
119 250 2.4
121 186 2.3
213 250 4.8
214 250 3.4
231 262 5
4. CONCLUSION
In this paper, a smart compression method was proposed to transmit a large amount of data and provide real-time analysis. Moreover, the proposed method can efficiently compress input channels even if the available bandwidth changes, to keep the continuous transmission of clinical data, and to preserve the quality of reconstructed data.
Using proposed method, (i) the bit rate of each input channel is completely under controlled, (ii) the weak channels can use the bit capacity of strong channels, (iii) input channels can be compressed with different CDRs, (iv) the signal quality can be gradually improved as the bit rate increases.
The method is an attractive choice for applications in which real time processing is crucial. In fact, the capability of more convenient real-time analysis of data can be provided for specialists.
In conclusion, the proposed method is able to intelligently and simultaneously compress huge amount of data with significant high compression ratio at controllable low error. In addition, it is possible to use bit capacity of every input channel efficiently.
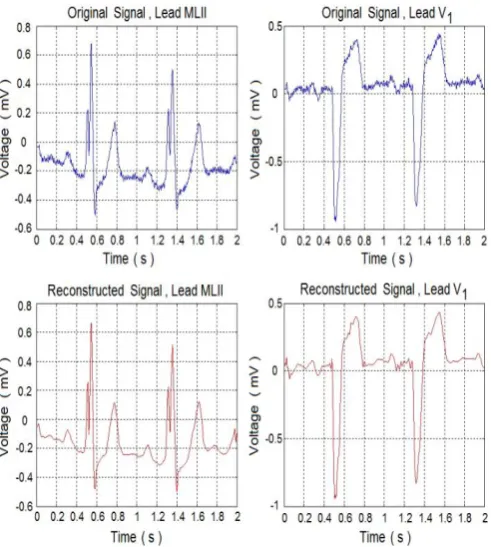
Figure 3. The original and reconstructed dual-channel ECG of record 111 which is one of weak channels
5. ACKNOWLEDGEMENT
This work is supported (in part) by the Defense Threat Reduction Agency, Basic Research Award # HDTRA1-12-1-0033, NASA EPSCoR program, and the National Science Foundation (NSF) award #EPS-IIA-1301726. Any opinions, findings, conclusions, or recommendations expressed in the material are those of the author(s) and do not necessarily reflect the views of NSF.
6. REFERENCES
[1] Tcheou M. P., et al., “The compression of electric signal waveforms for smart grids: state of the art and future trends”, IEEE trans. on smart grid, Vol. 5, No. 1, Jan. 2014, 291―302.
[2] Cao Y., Wu G., and Wang H., “A smart compression scheme for GPU-accelerated volume rendering of time-varying data”, IEEE inter. conf. on virtual reality and visualization, China, Nov. 2011, 205―210.
[3] Sharifahmadian E., “Compression of vital biosignals of patient by enhanced set partitioning in hierarchical trees algorithm,” World congress on medical physics and biomedical engineering (WC2009) & IFMBE, Sept. 2009, 86―87.
[4] Sharifahmadian E., Choi Y., Latifi S., Dascalu S., and Harris F. C., “Wavelet-based compression of multichannel climate data” SPIE international conference on sensing technology and its applications; Vol.9124, USA, May 2014, B1―B6.
algorithm,” BMES annual fall meeting, Missouri, USA, Oct. 2008, Published.
[6] Sharifahmadian E., Choi Y., Latifi S., “New sensors could evaluate astronauts’ vital signs in flight” SPIE newsroom, Feb. 2014, DOI: 10.1117/2.1201402.005321.
[7] Jalaleddine S. M. S., Hutchens C., et al., “ECG data compression techniques-A unified approach,” IEEE transaction on biomedical engineering, vol. BME-37, Apr.1990, 329―343.
[8] Nave G., Cohen A., “ECG compression using long-term prediction,” IEEE trans. on biomedical engineering, vol. 40, Sept. 1993, 877―885.
[9] Miaou S. G., and Yen H. L., “Quality driven gold washing adaptive vector quantization and its application to ECG data compression,” IEEE trans. on biomedical eng., vol. 47, Feb. 2000, 209―218.
[10] http://www.cc.gatech.edu/~dovrolis/bw-est/pathrate.html
[11] Dovrolis C., Ramanathan P., and Moore D., “Packet-dispersion techniques and a capacity-estimation methodology”, IEEE/ACM Trans. on networking, Vol.12, No.6, Dec. 2004, 963―977.
[12] Sharifahmadian E., and Latifi S., “Cognitive congestion control for data portals with variable link capacity” International journal of communications, network and system sciences, Vol. 5 No. 8, 2012, 481―489.
[13] Sharifahmadian E., and Latifi S., “A cognitive approach for congestion control in high traffic networks” IEEE international conference on systems engineering, USA, 2011, 263―266.
[14] Sharifahmadian E., Choi Y., Latifi S., “Multichannel data compression using wavelet subbands arranging technique,” International journal of computer application, Vol.91, No.4, Apr. 2014, 17―22.
[15] Shaifahmadian, E., Choi, Y., and Latifi, S., “Wavelet-based identification of objects from a distance” SPIE international conference on signal processing, sensor/information fusion, and target recognition XXIII, Vol.9191, 2014, 1B1―1B8.
[16] Sharifahmadian E., “Wavelet compression of multichannel ECG data by enhanced set partitioning in hierarchical trees algorithm,” 28th
IEEE EMBS annual international conference, New York City, USA, Sept. 2006, 5238―5243.
[17] Mallat S. G., “A theory for multiresolution signal decomposition: The wavelet representation,” IEEE trans. on pattern analysis and machine intelligence, vol. 11, July 1989, 674―693.
[18] http://www.physionet.org/physiobank/database/mitdb/
[19] Thakor N. V., Webster J. G., and Tompkins W. J., “Estimation of QRS complex power spectra for design of a QRS filter,” IEEE Trans. Biomed. Eng., vol.31, Nov. 1984, 702―706.
[20] Cohen A., Daubechies I., and Feauveau J. C., “Biorthogonal bases of compactly supported wavelets,” Communications on pure and applied mathematics, vol. 45, 1992, 485―560.