Effect of Physical Layer Limitations on the MAC
Layer Capacity of Mobile WiMAX System,
Analysis and Simulation
Safwan E. Abdul Fatah
Electrical Engineering Department University of Mosul, Mosul, IRAQ
Sami A. Mawjoud
Electrical Engineering Department University of Mosul, Mosul, IRAQ
ABSTRACT
In this paper, the effect of physical layer limitations on the MAC layer capacity of mobile WiMAX system is analyzed mathematically. The downlink physical layer simulation results show the best burst profiles for a mobile WiMAX system working in a multipath fading channel under the Quality of Service (QoS) requirements for video streaming applications. The capacity mathematical results are obtained based on the physical layer constraints after discarding the MAC layer overheads. Then, a complete simulation model for physical and MAC layers are built to validate the capacity analytical results. The simulation results show a good degree of convergence between the analytical and simulation capacity results. Also, the results show that the maximum number of users that can be served instantaneously by the BS are different depends on the used distributed subcarrier permutation mode.
Keywords
Mobile WiMAX, physical layer, MAC layer, PUSC, FUSC, ITU-R mixed users channel model, QoS.
1.
INTRODUCTION
Mobile WiMAX (Worldwide Interoperability for Microwave Access) is based on the IEEE 802.16e-2005, also known as IEEE 802.16e standard, which become one of the most popular access technologies developed for broadband wireless networks [1, 2]. The IEEE 802.16e-2005 forms the basis for the WiMAX solution for fixed, nomadic and mobile applications.
The Mobile WiMAX improves the original OFDM physical layer to an efficient multiple access technique using the scalable Orthogonal Frequency Division Multiple Access (OFDMA) for Non-Line-of-Sight (NLOS) environments [3, 4]. This is achieved by converting the wide band frequency selective fading channel with scalable channel bandwidths between 1.25 and 20 MHz into set of flat fading sub-channels with up to 2048 subcarriers. Moreover, in the digital implementation of SOFDMA, the Inter Symbol Interference (ISI) and Inter Carrier Interference (ICI) can be completely eliminated through the use of a Cyclic Prefix (CP) [5, 6].
In OFDMA frame, the base station (BS) allocates each mobile station (MS) with a subset of subcarriers which are grouped as subchannel. The mapping process to form a subchannel from multiple subcarriers is called subcarrier permutation mode, which is basically two types, distributed, and adjacent. The distributed one includes two mandatory permutation modes: Full Usage of the SubChannels (FUSC) and Partial Usage of the SubChannels (PUSC), with main advantage of frequency diversity gain over part of the channel bandwidth in the PUSC mode and over the whole channel
bandwidth in the FUSC mode. The adjacent mode includes one mandatory permutation mode: Adaptive Modulation and Coding (AMC) with main advantage of multiuser diversity gain. For more details, the mandatory subcarrier permutation modes allowed in IEEE 802.16e-2005 are discussed extensively in [7, 8].
In order to maximize mobile WiMAX capacity, an Adaptive Modulation and Coding (AMC) technique is used. In this technique, multiple Modulation and Coding Schemes (MCSs) (commonly known as burst profiles or link speeds) are employed adaptively depending on good channel conditions to achieve higher data rates at all times [9].
The resources-allocation by the BS to each MS are broadcasted to all MSs using the MAC management messages placed in the beginning of the MAC frame structure. The MAC layer is responsible of: Establishing connections; resources allocation; ensuring QoS for various applications; fragment, pack or concatenate the Service Data Units (SDUs) received from higher layers into the MAC Protocol Data Units (PDUs) which is the basic building block of MAC layer payload; and selecting the appropriate burst profile and power level to be used for the transmission of MAC PDUs [9, 10].
In this paper we present a MAC layer mathematical analysis for the distributed subcarrier permutation modes (FUSC, PUSC) by eliminating the calculated overhead slots, and considering the physical layer simulation results.The physical layer simulation results show the limitations of the physical layer on the MAC layer capacity results. These limitations are expressed in terms of the number and types of best burst profiles under the ITU-R mixed users multipath fading channel environment. The system capacity in terms of maximum number of users served by the BS is calculated for video streaming application. In order to validate the obtained capacity analytical results, a complete simulation model for physical and MAC layers has been carried out using OPNET modular under the same analytical model considerations. This paper organized as follows: In sec. 2 the time-frequency OFDMA frame structure is presented. Sec. 3 describes the mixed user channel model. Sec. 4 discusses the DL subframe capacity analysis for the FUSC and PUSC permutation modes. Sec. 5 deals with simulation parameters and results analysis. Sec. 6 concludes the paper.
2.
TIME-FREQUENCY OFDMA FRAME
STRUCTURE
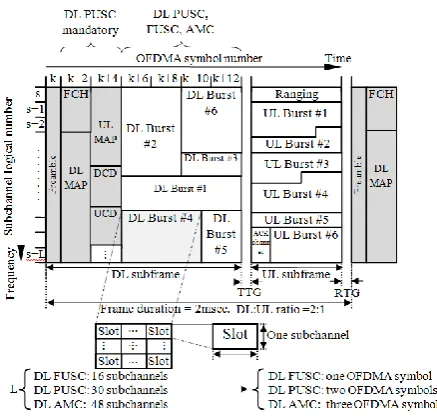
Fig 1: OFDMA TDD frame structure
duration between 2msec and 20msec with a static selection. The TDD frame consists of consecutive downlink (DL) and uplink (UL) subframes, which are transmitted on the same carrier frequency at different time separated by a guard periods called Transmit-Receive Transition Gap (TTG) and Receive-Transmit Transition Gap (RTG) as shown in Figure 1. Each DL and UL subframe in mobile WiMAX is divided into various zones. Each zone uses different subcarrier permutation mode. The OFDMA frame may include multiple zones, and the physical layer parameters may change from one zone to the next [1, 2, 9, 10].
The modulated data symbols and pilots are mapped onto subcarriers to form an OFDMA symbol, which is the minimum time resource-unit allocated by the BS. On the other hand, the subchannel is the minimum frequency resource unit allocated by the BS. Therefore, different subchannels may be allocated to different users as a multiple-access mechanism [12].
The subchannels within the OFDMA symbols are then organizing the OFDMA slot, which is the minimum possible data allocation unit that can be allocated to a single user in the time-frequency domain. The definition of the OFDMA slot differs for DL and UL subframes, and for different subcarrier permutation modes [9, 12] see Figure 1. Again the slot is the basic building block to organize the DL and UL data burst. Burst in general terms, is a data region that is a two-dimensional data block consisting of a group of contiguous subchannels by a group of contiguous OFDMA symbols. To accommodate different users with different modulation and coding schemes, the DL subframe designed to contain several bursts, each burst is modulated with a different modulation and coding scheme which is called burst profile. Each burst profile then assigned to users located approximately at the same distance from BS. The DL and UL data bursts are of variable rectangular size and carry the PDUs of the MAC layer [11, 12, 13]. The MAC layer assigns data bursts to users to be mapped into the OFDMA frame structure together with the relevant controlling messages overhead with separate time slots to accommodate both DL and UL traffic under consideration of QoS requirements.
It is worth mentioning that this paper focuses on the mandatory distributed subcarrier permutation modes. The frequency diversity advantage in these permutation modes
averages the effects of interference. Therefore, it can accommodate an environment of high mobility channel condition, even when the quality of each subcarrier varies from one symbol (or frame) to another [9, 12, 14]. The various parameters related to the distributed (PUSC, FUSC) permutation modes with 1024- FFT sizes are shown in Table 1 [1, 2].
Parameters FUSC PUSC
Number of Used Subcarriers (Nused)
(with pilots and the DC subcarrier)
851 841
Number of data subcarriers (Ndata) 768 720
Number of pilot Subcarriers 82 120 Number of subchannels (Nch) 16 30
A slot consists of
1Subch.×1O FDMA sym.
1Subch.×2 OFDMA
sym. Number of data subcarriers in each
symbol per subchannel
48 24
Number of data Subcarriers per slot 48 48
3.
THE MIXED USERS MULTIPATH
CHANNEL MODEL
The physical layer multipath fading channel simulation model presented in this paper is proposed by the WiMAX forum and called a mixed user channel. This channel depends on mixing the vehicular and pedestrian channel with different MSs speeds according to the following weights [15, 16, 17]: ITU Pedestrian B (3km/h) with a weight of 60%, ITU Vehicular A (30 km/h) with a weight of 30% and ITU Vehicular A (120 km/h) with a weight of 10%. Then an additive white Gaussian noise with a specific noise density is added to the transmitted signal to consider the effects of the background channel noise. The tapped delay line power delay profiles for the vehicular A and pedestrian B channels are given in details in [18].
4.
DL SUBFRAME CAPACITY
ANALYSIS FOR THE FUSC AND PUSC
PERMUTATION MODES
For the following mathematical analysis it is assumed a DL-OFDMA mobile WiMAX system, 10MHz bandwidth, FFT size of 1024, TDD mode of operation, frame duration is 2msec., and a DL:UL ratio of 2:1. Also, the mobile WiMAX system is assumed to be in steady state and having a specific number of users served by BS in the DL subframe, which are equal to the number of users in the UL subframe, NDL-users =
NUL-users = Nusers.
Also, the present mathematical analysis focuses on the capacity calculation for FUSC and PUSC permutation modes to obtain the maximum number of users that can be served by the BS in the DL subframe direction. Since in this direction more resources are allocated by the BS than in the UL direction, and this states a good indication for the maximum capacity provided by the mobile WiMAX system. The MAC layer allocates the time-frequency resources to various users in units of slots. So, in order to calculate the precise DL throughput at the MAC layer, the overhead slots must be calculated and removed from the total DL subframe slots.
Table 1: 1024-FFT, 10MHz-BW OFDMA PUSC, FUSC
4.1 Physical and MAC Layers Throughput
Calculations
The physical layer peak data rate calculated according to equation (1) [8, 17, 19] as follows:
RPhysical = ND * Nb * RFEC / Ts (1)
where, ND is the number of data subcarriers, see Table 1, Nb is
the number of bits per modulation symbol, depends on the selected modulation scheme, RFEC is the coding rate, and Ts is
the OFDMA symbol duration, calculated as follows [1, 2]:
Ts= (1+CP)*NFFT/(floor(n*BW/8000)*8000) (2)
where, CP is the cyclic prefix ratio, NFFT is the FFT size, n is
the sampling factor, BW is the channel bandwidth, and floor represents the floor function.
Now, according to the assumed DL OFDMA parameters and putting CP=1/8, n=28/25, Ts could be calculated using
equation (16) as: Ts=102.857 µsec.
In order to separate the DL and UL subframes throughputs, the physical layer throughput must be rewritten in terms of the number of symbols in the DL and UL subframes respectively. The total number of symbols in the TDD frame are calculated as follows [19]:
Total s ymbol
N = floor(Tf/Ts) (3)
where, Tf: frame duration.
The peak TDD frame throughput at the MAC layer can be express in terms of total number of symbols in the TDD frame ( Total
s ymbol
N ) as follows:
Total MAC
R = ND * Nb * RFEC * NTotalsymbol /Tf (4) Now, the peak DL subframe throughput at the MAC layer could be expressed as:
DL MAC
R = ND * Nb * RFEC * NDLs ymbol/Tf (5) where, DL
s ymbol
N : number of OFDMA symbols in the DL
subframe, and it depends on DL:UL ratio after subtracting the TTG and RTG durations.
Now, by substituting Tf = 2 msec., Ts=102.857 µsec. in
equation (3), and assuming that the TTG & RTG takes about 0.44 symbol duration (i.e. TTG+RTG= 45.7 µsec.) [20], we can get the following:
Total s ymbol
N = floor(Tf/Ts)= floor(2*10-3/102.84*10-6)
= floor(19.44) = 19 symbols
The preamble takes only one symbol, and the DL:UL ratio=2:1 that leads to:
18 NTotal
s ymbol symbols, N 12 DL
s ymbol symbols, N 6 UL s ymbol symbols.
The most significant overhead parameters affecting the MAC throughput is the control messages overheads. The total MAC messages overheads (in byte) are calculated according to equation (6):
OHMAC(byte)= FCH(byte) + OHDL-MAP(byte) + OHDCD(byte) +
OHUL-MAP(byte) + OHUCD(byte) (6)
where, FCH is the Frame Control Header overhead, OHDL-MAP
is the DL-MAP overhead, OHUL-MAP is the UL-MAP
overhead, OHDCD is the Downlink Channel Descriptor
overhead, and OHUCD is the Uplink Channel Descriptor
overhead. These MAC management messages overheads are calculated for the FUSC mode as follows:
FCH(byte)= 24 (7)
OHDL-MAP(byte)= ceil(18+7.5*NDL-users) (8)
OHDCD(byte)= 106+ceil((3.5*NDL-burst)+1)+(6*NDL-burst) (9)
OHUL-MAP(byte)= ceil(12+6.5*NUL-users) (10)
OHUCD(byte)= 178+(9*NUL-burst) (11)
Similarly, for the PUSC mode the same above equations are used except the OHDL-MAP(byte), which is calculated as
follows:
OHDL-MAP(byte)= ceil(15+7.5*NDL-users) (12)
The detailed calculations of the MAC messages overheads are mentioned in [21].
By assuming that DCD, UCD repeated periodically every 100 msec. The total MAC messages overheads (in bytes) for FUSC permutation mode become:
FUSC MAC
OH (byte)= 24+ceil(18+7.5*NDL-users)+[106+ceil((3.5
*NDL-burst)+1)+(6*NDL-burst)]* Tf/100+ceil(12+6.5*NUL-users)
+[178+(9*NUL-burst)]*Tf/100 (13)
Also, the total MAC messages overheads (in bytes) for PUSC permutation mode become:
PUSC MAC
OH (byte)= 24+ceil(13+7.5*NDL-users)+[106+ceil((3.5
*NDL-burst)+1)+(6*NDL-burst)]*Tf/100 + ceil(12+6.5*NUL-users)
+[178+(9*NUL-burst)]*Tf/100 (14)
Now, the calculated FUSC MAC
OH (byte) and PUSC MAC
OH (byte) are expressed in terms of the minimum MAC allocation unit (slot) by calculating the slot size in terms of bytes (Slz (byte)). The slot size in byte units for any burst profile and for FUSC, PUSC subcarrier permutation modes is given as follows:
Slz (byte) = 48 * Nb * RFEC /8 (15)
The RPhysical , and Slz (byte) of FUSC and PUSC modes are
calculated for the recommended MCSs in the mobile WiMAX system [15, 16], the results are listed in Table 2.
MCSs (burst profiles)
Nb
(bits) CTC Rate (RFEC)
FUSC PUSC Slz (byte) RPhysical
(Mbps)
DL MAC
R
(Mbps) RPhysical
(Mbps)
DL MAC
R
(Mbps) QPSK 2 1/2 7.467 4.608 7.001 4.32 6
QPSK 2 3/4 11.201 6.912 10.501 6.48 9 16QAM 4 1/2 14.935 9.216 14.002 8.64 12 16QAM 4 3/4 22.403 13.824 21.003 12.96 18 64QAM 6 1/2 22.403 13.824 21.003 12.96 18 64QAM 6 3/4 33.605 20.736 31.505 19.44 27 64QAM 6 5/6 37.339 23.040 35.005 21.6 30
Since the MAC overhead messages are always sent using the most robust MCS, QPSK1/2, where Slz (byte) = 6 bytes/slot. Then, the number of MAC overhead slots for FUSC and for
Table 2: Physical layer and DL MAC layer throughput and slot size of the FUSC and PUSC permutation modes
PUSC modes due to MAC control messages in DL subframe can be calculated as follows:
FUSC MAC OH
N (slot) =
FUSC MAC
OH (byte) / 6 for FUSC mode
PUSC MAC OH
N (slot) =
PUSC MAC
OH (byte)/ 6 for PUSC mode
Now, the number of allocated data slots by the MAC layer in the DL subframe for the FUSC and PUSC modes can be calculated as follows:
FUSC MAC data
N (slot) = FUSC MAC total
N (slot) - FUSC MAC OH
N (slot) (16)
PUSC MAC data
N (slot) = PUSC MAC total
N (slot) - PUSC MAC OH
N (slot) (17)
where, FUSC MAC total
N (slot),
PUSC MAC total
N (slot): the total number of slots in the DL subframe for the FUSC and PUSC modes, respectively, and calculated as follows:
FUSC MAC total
N (slot) = Nch* = 16*12 = 192
PUSC MAC total
N (slot) = Nch* /2 = 30*6 = 180
Then the MAC throughput at the DL subframe for the FUSC and PUSC permutation modes for multiple MCSs (burst profiles) is calculated as follows [10]:
) bps (
RFUSC
MAC
DL = 8000*
FUSC MAC data
N (slot) *
bur s t DL
N 1
i (Slzi*Wi)/Tf (18)
) bps (
RPUSC
MAC
DL = 8000*
PUSC MAC data
N (slot) *
bur s t DL
N 1
i (Slzi*Wi)/Tf (19)
where, Slzi: slot size in byte for the ith MCS (burst profile),
Wi: weighting percentage of the coverage area that served by
the ith MCS.
5.
SIMULATION PARAMETERS AND
RESULTS ANALYSIS
The physical layer performance is considered as an important indicator to show the behavior of the system working in a multipath mixed user channel. Also, providing important information about the best burst profiles to carry information efficiently between the BS and MS. This is done under the consideration of the QoS requirements in terms of PER and SNR for video streaming applications.
The physical layer simulation associated with the DL direction having the following BS-MS parameters [1, 2, 16, 18]: carrier frequency (fc) of 2.3GHz, BS antenna gain and
transmitted power of 15dBi and 30dBm, respectively. The antenna configuration is SISO system, MS antenna gain and noise figure of 0dBi and 7dB, respectively. also it is assumed that there is a perfect CSI. In addition to the assumed parameters mentioned in sec. 4. Under the same above mentioned parameters, a complete simulation model for the MAC and physical layers are built using OPNET modular. The MSs moving inside the cell according to proposed trajectories related to the pedestrian and vehicular speeds weights that mentioned previously in sec. 3.
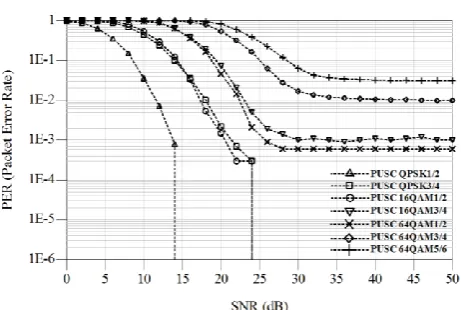
5.1 System Performance in Terms of PER:
Figures (2) and (3) show the simulation results of PER vs. SNR for the FUSC, PUSC permutation modes respectively in the multipath mixed user channel. It is obvious from the two
figures that the MCSs with coding rate 1/2 and are better in PER performance than the coding rate 3/4 even at higher modulation schemes, which carry more bits per symbol. This is due to the use of puncturing process in the 3/4 coding rate, which results in a reduction in minimum hamming distance that affects the ability for errors correction in multipath fading channel.
5.2 System Performance in Terms of Peak
Physical Layer DL Throughput
The peak physical layer error-free DL throughput (RPhysical)
per BS is given in equation (1) for a certain link speed (MCS). Now, in order to estimate the actual DL throughput (RActual)
from the peak physical layer DL throughput, equation (20) are used [8, 17, 22]:
RActual = RPhysical (1 − PER) (20)
where PER depends on SNR at the receiver, the selected MCS according to the adaptive modulation and coding technique, and the channel characteristics.
[image:4.595.315.546.365.520.2]In this throughput simulation for a broadband mobile WiMAX system, the application is assumed to be video streaming for both FUSC, PUSC permutation modes. The QoS requirements for this video streaming in terms of DL throughput and PER is as follows:
Fig 2: PER vs. SNR for FUSC permutation mode and various link speeds in the mixed user channel
DL Throughput = (1 −104
) kbps [23].
PER = (1*10-3 − 3*10-3) to be in good video quality [24]. The PER threshold of 3*10-3 is considered the highest PER acceptable for the video streaming application. Any PER in excess of this value is assumed to be too severe to maintain a practical data link.
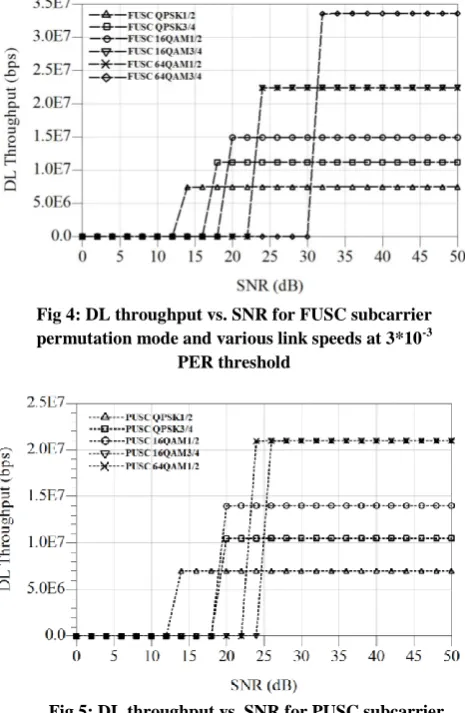
Applying the PER threshold (3*10-3) upon the simulation results in Figures 2 and 3 and using equation (20), the resulting burst profiles that meet the PER threshold constraints can be obtained as shown in Figures 4 and 5 for FUSC, PUSC modes, respectively.
It can be seen from Figures 4 and 5, that the maximum DL throughput in the FUSC mode is (33 Mbps), while it is (22 Mbps) in the PUSC mode. This is due to the better frequency diversity gain in the FUSC mode compared to the PUSC mode.
It is also clear from Figure 5 that the QPSK3/4 and the 16QAM1/2 starting at the same SNR, this is due to their very close PER performance, as shown in Figure 3. As a result when the system decides to switch to one of these burst profiles, it will choses the burst profile with the higher data rate one, which is the 16QAM1/2 and neglects the QPSK3/4. Moreover, in Figure 4, the 16QAM3/4 and 64QAM1/2 starting to be in use at the same SNR and the provided data rate are the same, so in this case when the system decides to
switch to one of these burst profiles at that SNR, it will chooses the burst profile with the more powerful coding rate, which is the 64QAM1/2 and neglect the 16QAM3/4.
The resulting FUSC burst profiles (QPSK1/2, QPSK3/4, 16QAM1/2, 64QAM1/2, 64QAM3/4) shown in Figure 4, and PUSC burst profiles (QPSK1/2, 16QAM1/2, 64QAM1/2) shown in Figure 5, represent essential information for the MAC layer throughput calculations.
5.3 System Performance in Terms of MAC
DL Throughput
In these MAC layer throughput calculations, the number of used MCSs in the DL subframe are equal to the number of DL bursts (NDL-burst) in the DL subframe. Now, from equations
(18) and (19), the FUSC MAC data
N (slot) and PUSC MAC data
N (slot) are calculated according to equations (16) and (17), respectively. Slzi values are given in Table 2 for all the MCSs, and the
NDL-burst values are obtained from the physical layer
simulation results, which represents the number of successfully working burst profiles.
These burst profiles information are summarized in Table 3 for the FUSC mode, and in Table 4 for the PUSC mode. The last factor in equations (18), (19) is the weighting percentage (Wi) of the coverage area that served by the ith MCS. This
factor represents the ratio of the circular strip area of a certain MCS to the total coverage area by the least robust MCS. This circular strip area can be calculated depending on the BS maximum coverage distance of the ith MCS.
The BS maximum coverage distance (D) is related to the channel path loss (PL (dB)) propagation model. The ITU-R M.1225 Recommendation [18] path loss propagation model for vehicular and pedestrian test environments are used with the link budget equation [20] that is given in equation (21):
(21) ) dBm ( ThN NF(dB)
) dB ( SNR ) dB ( G ) dB ( G ) dBm ( P dB
PL T BS MS
where PT is the BS transmit power, GMS is the MS antenna
gain, GBS is the BS antenna gain, SNR is the received signal
to noise ratio, NF is the receiver noise figure, and ThN is the Thermal Noise that is equal to -103.977 dBm.
A direct relationship could be derived between the BS maximum coverage distance (D) and the received SNR for the vehicular environment as shown in equation (22), and for pedestrian environment as shown in equation (23):
37.6SNR 33379 . 0
10 km
D
(22)
40SNR 196865 . 0
10 km
D (23)
Based on equations (22) and (23), the simulation results for maximum and minimum SNR for the working MCSs in Figures 4 and 5, and by considering the mixed user channel weights for the vehicular and pedestrian environments, respectively. The weighting percentage (Wi) of the coverage
[image:5.595.53.285.218.368.2]area for the ith successfully working MCS is calculated and listed with the maximum and minimum SNR in Table 3 for the FUSC permutation mode, and in Table 4 for the PUSC permutation mode.
Fig 4: DL throughput vs. SNR for FUSC subcarrier
permutation mode and various link speeds at 3*10-3
[image:5.595.51.284.220.577.2]PER threshold
Fig 5: DL throughput vs. SNR for PUSC subcarrier
permutation mode and various link speeds at 3*10-3
In this work the users are assumed to be distributed randomly in the coverage area of the cell that served by the BS.
The requested application (service) by all users is assumed to be Mobile Phone Video (H.264 Advanced Simple Profile (ASP), 176 kbps, 176×144 pixels, 20 Frame/Second) [25].
The required number of data slots in the DL subframe to accommodate the requested data rate (Rapp = 176 kbps) is
calculated for the two permutation modes FUSC and PUSC as follows:
NDL-app (slot)= Rapp / 8 * Tf * Nusers *
bur s t DL
N 1
i (Wi /Slzi)
(24)
The requested data rate by the users in the DL subframe can be calculated in similar way to equations (18) and (19) as:
RRequested (bps)=8000* NDL-app (slot) *
bur s t DL
N 1
i (Slzi Wi)/Tf (25)
The available data rate (resources) at the DL subframe is equal to the MAC data rate at the DL subframe, which are given in equations (18) and (19) for the two permutation modes FUSC and PUSC, respectively.
The maximum number of users (system capacity) in the DL subframe are obtained analytically by calculating the values of RAvailable(bps)/RRequested(bps) while increasing the number of
users in step by step progressively. When the quotient of RAvailable(bps)/RRequested(bps) = 1, the maximum number of
users that can be served simultaneously by the BS are attainable.
The OPNET simulation model are built according to different scenarios, each consists of a number of users distributed in the serving cell according to two weighting parameters: the first is the burst profile weighting ratio, in which the MCSs are distributed to users according to their locations in different ranges around the BS, these weighting ratios are calculated as given in Tables 3 and 4. The second parameter is related to the mobility speed for each user in the scenario, which is calculated according to the mixed user channel speed weighting ratios given in sec. 3. Then by combining the two
weighting ratios, we can get the users distribution around the BS in each scenario with different burst profiles and different users speed, as illustrated in Figure 1.
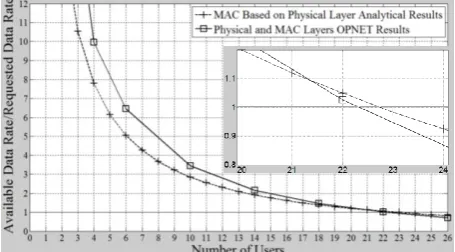
The OPNET simulation results and the MAC layer analytical results that are based on the physical layer simulation results, to calculate the maximum number of users requesting a video phone service from the serving BS are shown in Figure 6 for FUSC permutation mode, and Figure 7 for PUSC permutation mode.
It is obvious from Figure 6 that the maximum number of users calculated according to the analytical and simulation results are limited to 25 users for the FUSC mode, while Figure 7 shows that the maximum number of users are limited to 22 users in the PUSC mode. Also, the two figures point out the convergence in the analytical and OPNET simulation results when reaching the maximum number of users for both permutation modes. However, when increasing the number of users more than the above limits, the quotient of RAvailable(bps)/RRequested(bps) become less than one, which
means that there are no enough resources (slots) at the DL subframe to be assigned to more users with that requested application.
6.
CONCLUSION
The physical layer simulation results in the ITU-R mixed user channel show that only five burst profiles in the FUSC mode and only three burst profiles in PUSC mode are met the QoS requirements for the video streaming application. This is a particular difference between this paper and other papers assuming all the burst profile to be in use. It is also important to see that not all the burst profiles that meet the QoS MCS Minimum
SNR
Maximum SNR
Weighting ratio Wi%
QPSK1/2 14 18 38
QPSK3/4 18 20 13
16QAM1/2 20 24 19
64QAM1/2 24 32 18
64QAM3/4 32 50 12
MCS Minimum SNR
Maximum SNR
Weighting ratio Wi%
QPSK1/2 14 20 51
16QAM1/2 20 24 19
[image:6.595.52.268.106.199.2]64QAM1/2 24 50 30
Table 3: The Wi weighting percentage of the coverage
[image:6.595.317.544.189.319.2]area for the ith MCS with its maximum and minimum SNR for the FUSC mode
Table 4: The Wi weighting percentage of the
coverage area for the ith MCS with its maximum and minimum SNR for the PUSC mode
Fig 6: Maximum number of users in the DL subframe for the FUSC permutation mode
[image:6.595.53.262.248.305.2] [image:6.595.318.546.369.495.2]requirements for the video streaming application should be used by the system, because there are some of burst profiles share the same SNR range, which requires the system to choose the most efficient one when intended to switch from burst profile to another according to the adaptive modulation and coding technique. The MAC layer capacity analysis based on simulation results shows that it is possible to serve up to 25 users simultaneously for FUSC mode, and 22 users simultaneously for PUSC mode in the DL subframe after removing the MAC management overhead messages slots from the total DL subframe. Also, the results point out the convergence in the analytical and OPNET simulation results when reaching the maximum number of users for both subcarrier permutation modes.
7.
REFERENCES
[1] IEEE Std 802.16e-2005, IEEE Std 802. 2004/Cor 1-2005, “IEEE Standard for Local and metropolitan area networks, Part 16: Air Interface for Fixed and Mobile Broadband Wireless Access Systems, Amendment 2: Physical and Medium Access Control Layers for Combined Fixed and Mobile Operation in Licensed Bands and Corrigendum 1.”, New York, IEEE, February 28, 2006.
[2] IEEE Std 802.16™-2009, Revision of IEEE Std 802.16-2004 “IEEE Standard for Local and metropolitan area networks Part 16: Air Interface for Broadband Wireless Access Systems”, New York, IEEE, May 29, 2009.
[3] V. Bykovnikov, “The Advantages of SOFDMA for WiMAX”, Intel Corporation, 2005. Available on: http://www.bitlib.net/w/wimax+advantages.html
[4] H. Yaghoobi, “Scalable OFDMA Physical Layer in IEEE 802.16 WirelessMAN,” Intel Technology Journal, Vol. 8, No. 3, 2004, pp. 201–212.
[5] M. A. Mohamed, M. S. Abo-El-Seoud, and H. M. Abd-El-Atty, “Performance Simulation of IEEE 802.16e WiMAX Physical Layer”, The 2nd IEEE International Conference on Information Management and Engineering (ICIME), Chengdu, pp. 661–668, 2010.
[6] R. Prasad, and F. J. Velez, “WiMAX Networks Techno-Economic Vision and Challenges”, Springer, New York, 2010.
[7] S. E. Abdul Fatah, S. A. Mawjoud, “Impact of Downlink Distributed and Adjacent Subcarrier Permutation Modes on the Performance of Mobile WiMAX System in ITU-R Ped. B Channel with Obtaining Optimum Cyclic Prefix”, Al-Rafidain Engineering Journal, Vol. 20, No. 4, 2012, pp. 69-85.
[8] S. E. Abdul Fatah, S. A. Mawjoud, “Mobile WiMAX: System Performance in Terms of Distributed and Adjacent Subcarrier Permutation Modes in ITU-R Vehicular A Channel”, IEEE International Conference on Future Communication Networks (ICFCN), Baghdad, pp. 41-46, 2012.
[9] J. G. Andrews, A. Ghosh, and R. Muhamed, “Fundamentals of WiMAX Understanding Broadband Wireless Networking”, Prentice Hall Press, 2007.
[10]B. Kim, J. Yun, Y. Hur, P. America, C. So-In, R. Jain, and A. Al Tamimi, “Capacity Estimation and TCP Performance Enhancement over Mobile WiMAX Networks”, IEEE Communications Magazine, June 2009.
[11]M. Sauter, “Communication Systems for the Mobile Information Society”, John Wiley & Sons, 2006.
[12]B. G. Lee, S. Choi, “Broadband Wireless Access and Local Networks Mobile WiMAX and WiFi”, Artech House, USA, 2008.
[13]K. Balachandran, D. Calin, F. Cheng, N. Joshi, J. H. Kang,…., and J. Sun, “Design and Analysis of an IEEE 802.16e-Based OFDMA Communication System,” Bell Labs Technical Journal, Vol. 11, No. 4, pp. 53–73, 2007.
[14]Y. S. Cho, J. Kim, W. Y. Yang, C. G. Kang, “MIMO-OFDM Wireless Communications with MATLAB”, John Wiley & Sons, India, 2010.
[15]WiMAX Forum, “Mobile WiMAX - Part 1: A Technical Overview and Performance Evaluation”, August 2006.
[16]WiMAX Forum, “WiMAX System Evaluation Methodology V2.1,”, Jul. 2008.
[17]R. Colda, T. Palade, I. Vermeşan, A. Moldovan, E. Puşchiţă, “Link Adaptation in Mobile WiMAX Systems under the ITU-R Mix of Channels”, Proceedings of the 14th WSEAS International Conference on Communications, Corfu Island, Greece, pp.242 – 247, 2010.
[18]ITU Document, “Rec. ITU-R M.1225 - Guidelines for Evaluation of Radio Transmission Technologies for IMT-2000”, ITU-R, 1997.
[19]D. Pareit, V. Petrov, B. Lannoo, E. Tanghe, W. Joseph, I. Moerman, P. Demeester, L. Martens, “A Throughput Analysis at the MAC Layer of Mobile WiMAX”, IEEE Wireless Communications and Networking Conference (WCNC), Sydney, Australia, 18-21 April 2010.
[20]K. Chen, and J. de Marca, “Mobile WiMAX”, John Wiley & Sons, 2008.
[21]S. E. Abdul Fatah, S. A. Mawjoud, “Capacity Analysis and Simulation Based on Physical and MAC layers for DL Adjacent Subcarrier Permutation Mode in IEEE 802.16e Standard”, Mediterranean Journal of Electronics and Communications, Vol. 8, No. 3, pp. 417-428, 2012.
[22]H. Zerrouki, and M. Feham, “High Throughput of WiMAX MIMO-OFDM Including Adaptive Modulation and Coding”, International Journal of Computer Science and Information Security, IJCSIS, Vol.7, No.1, pp. 86- 91, USA, 2010.
[23]I. Tardy, S. Allen, N. K. Elnegaard, S. Hurley, M. Goldhammer,…, R. Taplin, “Planning Guidelines for Broadband Access Networks with Case Studies”, BROADWAN Network, May 2006.
[24]A. A. Atayero, O. I. Sheluhin, Y. A. Ivanov, and J. O. Iruemi, “Effect of Wideband Wireless Access Systems Interference Robustness on the Quality of Video Streaming”, Proceedings of the World Congress on Engineering and Computer Science (WCECS), Vol II, San Francisco, USA, 2011.