Performance Analysis of Q Factor Optical
Communication in Free Space Optics
and Single Mode Fiber
Salim Burdah*, Rahmat Alamtaha, Octarina Nur Samijayani, Suci Rahmatia, Ary Syahriar
Department of Electrical Engineering, Faculty of Science and Engineering, Al Azhar University of Indonesia, Indonesia
Copyright©2019 by authors, all rights reserved. Authors agree that this article remains permanently open access under the terms of the Creative Commons Attribution License 4.0 International License
Abstract
Developments in the technology sector are currently experiencing rapid progress, especially in data transmission technology. The increasing need for fast data traffic in the telecommunications sector requires technology that can send data quickly. Optical fiber has the speed of receiving and sending data at 2.5 Gbps while FSO has a speed of up to 100 Gbps but this depends on Wavelength, the modulation technique used and the distance of the telescope between the transmitter and receiver. The speed of receiving and sending data also depends on the Quality (Q) of the signal, the greater the value of Quality (Q) of the signal, the better the Quality of the signal. FSO is an optical communication system that uses the atmosphere as its propagation medium and Optical Fiber uses silica as its propagation medium. Therefore, in this paper, a performance analysis of Free Space Optics (FSO) and Single Mode Fiber is carried out based on the Quality Factor and Bit Error Rate (BER) of a signal that is carried out using Optical System simulations with a wavelength of 1310 nm, 1380 nm, 1550 nm, 1550 nm and 1560 nm, with 1 km, 3 km and 5 km, respectively. Then, analysis uses an Eye Diagram to analyze the output signal and compare the Factor Q and Bit Rate Error (BER).Keywords
Free Space Optics, Fiber Optics,Optisystem
1. Introduction
The transmission technique used begins with copper cable networks as a transmission medium on home telephone systems and internet networks. However, because the copper network has a small bandwidth, the latest innovation is being developed, with wireless transmission for connections between networks using radio
frequency namely Free Space Optics (FSO). Free Space Optics (FSO) systems are the latest technology in communication systems that use light beam propagating from a transmitter through empty space to send and receive data [10].
FSO is a technology that uses invisible ray lines to provide optical bandwidth connections that can send and receive data, voice and video communications at high speed [4]. FSO can provide high speed from Point to Point or Point to Multipoint which is difficult to do by Radio over Fiber (ROF) technology such as optical fiber [4]. It was implemented using a laser device that could be installed inside a building or office and basically consisted of an optical transceiver with a laser transmitter and the receiving end to provide full duplex capability [11]. In wireless communication, FSO has many disadvantages such as regulation of bandwidth, high data and power restrictions. However, FSO has the main advantage of the absence of the danger of radio frequency radiation. It does not need to excavate roads as in the case of optical fibers, large bandwidth that allows high data rates and low power consumption [2].
2. Theoretical Foundation
2.1. Free Space Optics
Free space optic is a wireless line of sight (LOS) network that uses light beams that refer to lasers on optical networks. This component models a free space optics (FSO) channel. It is a subsystem of two telescopes and the free space channel between them. It is best suited for the modeling of line of sight free space terrestrial links. FSOs can work at hundreds of meters to several kilometers [10]. Free space optical communication (FSO) or often called optical wireless can carry full-duplex data at gigabit per second at metropolitan distances from several cities blocks up to several kilometers. One implementation that gets attention is Li-fi or light fidelity, which has the same Wi-Fi function but uses visible light communication (VLC), so it has a higher speed [1]. Another implementation developed is for inter-point communication in networks that use various media such as smart city or Internet of Thing (IoT). Free Space Optic (FSO) technology is applied to buildings to buildings, cities to cities can even be island to island. The wavelength used in this paper is 1310 nm, 1380 nm, 1550 nm and 1560 nm.
2.2. Fiber Optics
Optical Fiber is a suggestion made from strands of thin glasses that can produce a communication system in the form of light waves. Light is used to carry and transmit information or data, both analog and digital. The working system of optical fibers is light released into the fiber which consists of two layers, namely the core and the outside. Light will run along the fiber through a series of reflections that occur where the core and the outside meet. Then the light will be picked up by the light sensitive receiver then the original signal will be produced. Many optical fibers have now been used to transmit data and are installed underground.
2.3. Bit Error Rate (BER)
This visualizer allows the user to calculate and display the bit error rate (BER) of an electrical signal automatically. It can estimate the BER using different algorithms such as Gaussian and Chi-Squared and derive different metrics from the eye diagram, such as Q Factor, eye opening, eye closure, extinction ratio, eye height, jitter, etc. It can also take in account Forward Error Correction (FEC), plot BER patterns and estimate system penalties and margins. BER (bit error rate) is a measure of signal Quality received for digital data transmission systems. The FSO system BER The parameter Algorithm defines the numerical method to use for the BER estimation. Assuming Gaussian noise with the standard deviations σ0 and σ1, the BER is [13]:
Pe =N+MM Pe0+M+NN Pe1 (1)
where P0 and P1 are the probabilities of the symbols, M is the number of samples for the logical 0, and N is the number of samples for the logical 1. Also, Pe0 and Pe1 are:
Pe0=12erfc(S√2−𝜇σ0
0) (2) Pe1=12erfc(𝜇√20−𝑆σ
1) (3) where µ0, µ1, σ0 and σ1 are average values and standard deviations of the sampled values respectively, and S is the threshold value.
An enhancement of the simple Gaussian approximation can be achieved by averaging the separately estimated BERs for different sampled symbols [8]. For M sampled values for the logical 0 and N sampled values for the logical 1, the corresponding error rates are:
Pe1=2N1 ∑Ni=1erfc(μ√2σ01i-S1i) (4)
Pe0=2M1 ∑Mi=1erfc(√2σμ0-S0i) (5)
If the signal is mixed with the noise, the Average Gaussian method is modified to calculate the average error patterns. The detailed description is [3]:
Pe=∑8i=1NPMerfc(√2σμi-Si) (6)
where NP is the number of one occurrence of any pattern, N is the total number of patterns, and are average values and standard deviations of the sampled values for each pattern respectively, and S is the threshold value.
2.4. Signal to Noise Ratio
Noise on a wireless optical system can be divided into two major parts, namely shot noise and thermal noise. SNR values on the FSO system [6] are as follows:
SNRFSO=S
N (7)
S is an input signal in the form of a receiver at λ = 1550 nm, and B is bandwidth (Hz) while N is a noise that can be caused by atmospheric turbulence, temperature and so on.
2.5. Q Factor
There are two modes to calculate the Q Factor: The Q Factor from BER is calculated numerically by:
Pe=12erfc(√Q2) (8) where the Q Factor is calculated:
Q= �μ1-μ0�
σ1-σ0 (9)
3. Model Design
3.1. Design Free Space Optics and Fiber Optics
Transmission performance analysis of two different channel in optical communication systems. This system is
designed using optical simulation software Optisystem. OptiSystem software can be used to model and simulate optical fibre systems and FSO optical free space systems provides a user interface that is commonly used for many other electrical engineering tools especially optics.
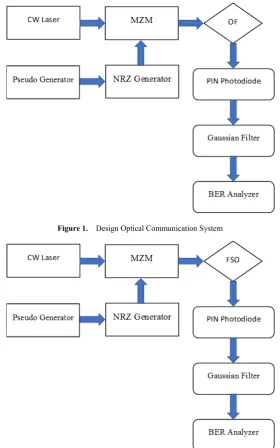
Single mode fiber is designed as shown in Fig.1 with a wavelength of 1310 nm, 1380 nm, 1550 nm and 1560 nm with 1 km, 3 km and 5 km respectively and then SMF using Low Pass Gaussian Filter.
Free Space Optics is designed as shown in Fig.2 with a wavelength of 1310 nm, 1380 nm, 1550 nm and 1560 nm with 1 km, 3 km and 5 km respectively and then FSO using Low Pass Filter.
[image:3.595.157.438.272.721.2]Then the SMF and FSO design will display the results of Q Factor and BER.
Figure 1. Design Optical Communication System
3.2. System Design
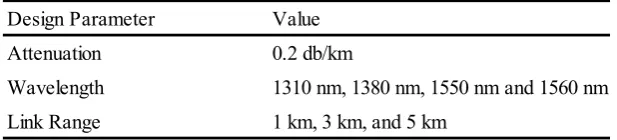
[image:4.595.144.453.211.281.2]Table 1. FSO Communication System Design Specification
Table 2. SMF Communication System Design Specification
4. Result and Discussion
4.1. Result of Q Factor, BER, Power Receiver in Fiber Optics
In previous studies conducted by Pinky Vishwakarma and Jayprakash Vijay entitled “Comparative Analysis of Free Space Optics and Single Mode Fiber” with range 1 km, 50 km, 100 km and using wavelength 750 nm, 1350 nm, and 1550 nm [14].
The following are the results of SMF simulations that have been carried out with wavelengths of 1310 nm, 1380 nm, 1550 nm and 1560 nm with distances of 1 km, 3 km and 5 km respectively, and then produce the amount of Q Factor and Bit Rate Error.
4.2. Result of Q Factor, BER, Power Receiver in Free Space Optics
In previous studies conducted by Pinky Vishwakarma and Jayprakash Vijay entitled “Comparative Analysis of Free Space Optics and Single Mode Fiber”, it used optical wireless communication (OWC) channel components. It is a subsystem of two telescopes and the wireless communication channel between them. It is best suited for the modeling of satellites and earth-satellite links with range 1 km, 50 km, 100 km and then using wavelength 750 nm, 1350 nm, and 1550 nm [14]. While in this paper the FSO channel is used for buildings to buildings.
The following are the results of FSO simulations that
have been carried out with wavelengths of 1310 nm, 1380 nm, 1550 nm and 1560 nm with distances of 1 km, 3 km and 5 km respectively and then produce the amount of Q Factor, bit rate error and power receiver. As a Quality Factor, Q is a one important indicator to determine optical performance which is used to characterize BER.
4.3. Comparison of Q Factor in Fiber Optics and Free Space Optics
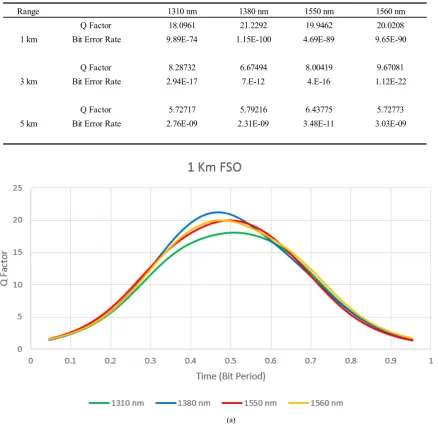
Figure 3 (a) and (b) are the results of Q Factor graph FSO and SMF simulation at wavelengths of 1310 nm, 1380 nm, 1550 nm, and 1560 nm in the range of 1 km. In FSO communication at a wavelength of 1310 nm with a distance of 1 km it produces a Q Factor of 18.0961, and BER 9.88904E-74. At wavelength 1380 nm with distance of 1 km it produces a Q Factor of 21.2292, and BER 1.15343E-100. At wavelength 1550 nm with distance of 1 km it produces a Q Factor of 19.9462, and BER 4.6897E-89. At wavelength 1560 nm with distance of 1 km it produces a Q Factor of 20.0208, and BER 9.64973E-90.
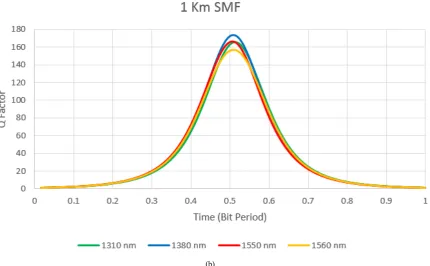
In SMF communication at a wavelength of 1310 nm with a distance of 1 km it produces a Q Factor of 165.486, and BER 0. At wavelength 1380 nm with distance of 1 km it produces a Q Factor of 172.538, and BER 0. At wavelength 1550 nm with distance of 1 km it produces a Q Factor of 165.872, and BER 0. At wavelength 1560 nm with distance of 1 km it produces a Q Factor of 156.234, and BER 0.
Design Parameter Value
Attenuation 0.2 db/km
Wavelength 1310 nm, 1380 nm, 1550 nm and 1560 nm
Link Range 1 km, 3 km, and 5 km
Design Parameter Value
Attenuation 0.2 db/km
Wavelength 1310 nm, 1380 nm, 1550 nm and 1560 nm
Table 3. SMF Communication Result Q Factor, and BER
Table 4. FSO Communication Result Q Factor, and BER
(a)
Range 1310 nm 1380 nm 1550 nm 1560 nm
Q Factor 165.486 172.538 165.872 156.234
1 km Bit Error Rate 0 0 0 0
Q Factor 74.3013 78.943 126.472 127.408
3 km Bit Error Rate 0 0 0 0
Q Factor 41.1173 45.6312 74.2918 70.2528
5 km Bit Error Rate 0 0 0 0
Range 1310 nm 1380 nm 1550 nm 1560 nm
Q Factor 18.0961 21.2292 19.9462 20.0208
1 km Bit Error Rate 9.89E-74 1.15E-100 4.69E-89 9.65E-90
Q Factor 8.28732 6.67494 8.00419 9.67081
3 km Bit Error Rate 2.94E-17 7.E-12 4.E-16 1.12E-22
Q Factor 5.72717 5.79216 6.43775 5.72773
(b)
Figure 3. (a) Graph Q Factor FSO with Wavelength 1310 nm, 1380 nm, 1550 nm, and 1560 nm at 1 km.(b) Graph Q Factor SMF with Wavelength 1310 nm, 1380 nm, 1550 nm, and 1560 nm at 1 km
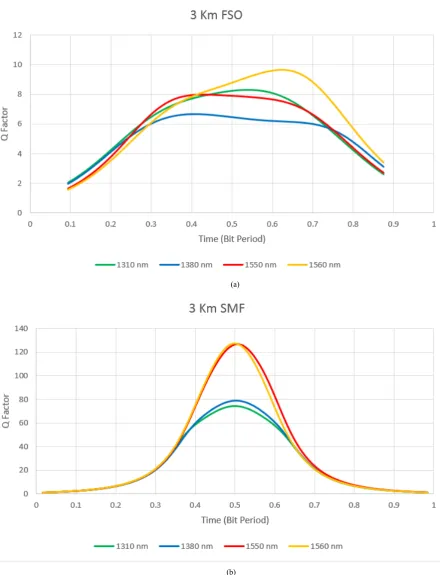
Figure 4 (a) and (b) are the results of Q Factor graph FSO and SMF simulation at wavelengths of 1310 nm, 1380 nm, 1550 nm, and 1560 nm in the range of 3 km. In FSO communication at a wavelength of 1310 nm with a distance of 3 km it produces a Q Factor of 8.28732, and BER 2.94185E-17. At wavelength 1380 nm with distance of 3 km it produces a Q Factor of 6.67494, and BER 7.E-5. At wavelength 1550 nm with distance of 3 km it produces a Q Factor of 8.00419, and BER 4.E-16. At wavelength 1560 nm with distance of 3 km it produces a Q Factor of 9.67081, and BER 1.11774E-22.
In SMF communication at a wavelength of 1310 nm with a distance of 3 km it produces a Q Factor of 74.3013, and BER 0. At wavelength 1380 nm with distance of 3 km it produces a Q Factor of 78.943, and BER 0. At wavelength 1550 nm with distance of 3 km it produces a Q Factor of 56.472, and BER 0. At wavelength 1560 nm with distance of 3 km it produces a Q Factor of 57.408, and BER 0.
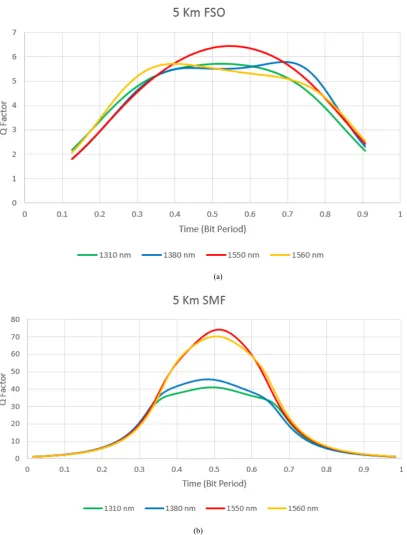
Figure 5 (a) and (b) are the results of Q Factor graph FSO and SMF simulation at wavelengths of 1310 nm, 1380 nm, 1550 nm, and 1560 nm in the range of 5 km. In FSO communication at a wavelength of 1310 nm with a distance of 5 km it produces a Q Factor of 5.72717, and BER 2.76E-09. At wavelength 1380 nm with distance of 5 km it
produces a Q Factor of 5.79216, and BER 2.31E-09. At wavelength 1550 nm with distance of 5 km it produces a Q Factor of 6.43775, and BER 3.48E-11. At wavelength 1560 nm with distance of 5 km it produces a Q Factor of 5.72773, and BER 3.03E-09.
In SMF communication at a wavelength of 1310 nm with a distance of 5 km it produces a Q Factor of 41.1173, and BER 0. At wavelength 1380 nm with distance of 5 km it produces a Q Factor of 45.6312, and BER 0. At wavelength 1550 nm with distance of 5 km it produces a Q Factor of 74.2918, and BER 0. At wavelength 1560 nm with distance of 5 km it produces a Q Factor of 70.2528, BER 0.
[image:6.595.87.518.87.353.2](a)
(b)
[image:7.595.80.521.78.654.2](a)
(b)
[image:8.595.99.507.80.616.2]5. Conclusions
This paper studied and analyzed various optical communication channels, namely Free Space Optics and Optical Fiber from the results obtained using the Optisystem software program and the simulation results obtained. Then, by looking at the ability of each channel to move along the optical path, the optical fiber channel can provide the best results at 1 km, 3 km, 5 km by calculating the minimum bit error value and increasing the value of the quality Factor. While the quality of FSO is far below optical fiber this is because the Free Space Optic channel is susceptible to atmospheric interference and the distance between the transmitter telescope and the receiver cannot be too far away. From all of the above, it can be concluded from two comparisons that the farther the distance traveled by FSO and SMF the lower the Quality of the signal.
REFERENCES
Astharini Dwi, Mayola Ary, Nur Octarina Samijayani, [1]
Syahriar Ary (2017) “Analisa Kinerja Teknik Modulasi Digital Pada Kanal Optik Nirkabel” Jurnal Elektronika dan Telekomunikasi Vol 17.
Bijayananda Patnaik, P.K. Sahu (205) “Optimized Hybrid [2]
Optical Communication System for First Mile and Last Mile Problem Solution of Today’s Optical Network” Sci Verse Science Direct 2nd International Conference on Communication, Computing and Security, pp.723-730. C.J. Anderson, J.A. Lyle, “Technique for evaluation of [3]
systems performance using Q in numerical simulation exhibiting intersymbol interference,” Electronic Letters, Vol. 30, No. 1, 1994, S. 71-72.
Ehsan Bayaki, Robert Schober and Ranjan K. Mallik (2009) [4]
“Performance Analysis of MIMO Free-Space Optical Systems in Gamma-Gamma Fading" IEEE Transactions on Communications, Vol. 57, Issue 11, pp.3415-3424. G. H. and Z. M. J. Alam, R. Alam, (2014) “Improvement of [5]
Bit Error Rate in Fiber Optic Communication,” Int. J. Futur Comput. Communication, vol. 4, no. 3, pp. 281–286. Hendrantoro Gamantyo, Mauludianto. A (205) “Kinerja [6]
Sistem Komunikasi FSO (Free Space Optics) Menggunakan Cell-Site Diversity diDaerah Tropis”, Jurnal Teknik ITS Vol 1.
ITU-T G.976 www.mapyourtech.com (Diakses 14, 1, 2019). [7]
J.C. Cartledge, G.S. Burley, “The Effect of Laser Chirping [8]
on Lightwave System Performance,” IEEE Journal of Lightwave Technology, Vol. 7, No. 3, 1989, S. 568-573. Murat Uysal, Jing (Tiffany) Li, and Meng Yu (2017) “Error [9]
Rate Performance Analysis of Coded Free Space Optical Links over Gamma-Gamma Atmospheric Turbulence Channels” IEEE Transactions on Wireless Communications.
Nazmi A. Mohammed, Amr S. El-Wakeel and Mostafa H. [10]
Aly (205 ) “Pointing Error in FSO Link under Different Weather Conditions”, International Journal of Video & Image Processing and Network Security IJVIPNS-IJENS vol. 5, No: 01, p.p 6-9.
Sanjeev Dewra, R.S.Kaler (2013) “Performance Evaluation [11]
of an Optical Network based on Optical Cross Add Drop Multiplexer” Opticheskiı˘ Zhurnal, Vol. 80, pp.46-50. Scott Bloom, Eric Korevaar, John Schuster and Heinz [12]
Willebrand (2003) “Understanding the performance of free-space optics,” Journal of optical vol. 2, pp 34-37, Jun.2003
Smith G.P. Agrawal, (1997) “Fiber Optic Communication [13]
Systems,” John Wiley & Sons, New York.
Vishwakarma Pinky, Vijay Jayprakash, (2016), [14]
“Comparative Analysis of Free Space Optics and Single Mode Fiber”, International Journal of Advanced Engineering, Management and Science (IJAEMS) Vol.2. Wartak S. Marek (2013) “Computational Photonics an [15]