Journal of Chemical and Pharmaceutical Research, 2015, 7(4):605-614
Research Article
CODEN(USA) : JCPRC5
ISSN : 0975-7384
Effects of pv cell modification to its performance in generating current and
voltage with KI/KI
3electrolytes system
Rera Aga Salihat*, Arif Yasthophi, Admin Alif and Hermansyah Aziz
Department of Chemistry, Faculty of Mathematics and Natural Science, Andalas University, Padang, West Sumatra, Indonesia
____________________________________________________________________________________________
INTRODUCTION
World energy demand continues to increase along with the progress of human civilization. Utilization of conventional energy sources such as coal, fuel oil, natural gas and others, on the one hand has low operational costs, but on the other hand faces greater obstacles. Hence, the development of renewable and pollution-free alternative
used membranes. To study the performance of pv cells in generating current and voltage, the continuous flow of number code (ie: cell 0, cell 1, cell 2, cell 3, cell 4 and cell 5), according to the amount of titania coating on the
ABSTRACT
A research of the effects of pv cell modification to its performance in generating current and voltage with KI/KI3
electrolytes system has been performed. This research intended on studying the effect of ceramic membranes
modified with titania (TiO2) on the performance of pv cells to generate current and voltage in generating currents
and voltages.The pv cells that were assembled in this study have a thickness of 9.5 mm. Each cells were givena
electrons system was used at the time of measurement. SEM and EDX analysis proved that the dip-coating process
with titania onthe cell 5’s ceramic membrane successfully modified surface and the pore size of the
ceramic membrane. The values of the performance characterization parameters of the cell 5 are as follows:
short circuit
voltagecurrent (Isc) 0,085 mA, open circuit voltage (Voc) 80,9 mV, maximum current (Imax)
0,025 mA, maximum (Vmax) 41,8 mV, maximum power (Pmax) 1,045 x 10-6 Watt, Fill Factor (FF) 0,152
and energy coversionefficiency (η) 0,553 %.
Keywords:pv cell, KI/KI3 electrolytes, ceramic membrane, UV-Vis spectrophotometer, SEM-EDX
_____________________________________________________________________________________________
energy sources is an urgent need for mankind [1].
Solar energy is the energy source that will never run out availability (solar energy that reaches the earth's atmosphere is about 1018 kWh / year). One of many tools for converting solar energy directly into electricity called photovoltaic (pv) cell. In 1970, when the world was faced with an energy crisis, researches on high efficiency photovoltaic cells were conducted intensively and expected to become an alternative energy to replace fossil fuels [2]. Pv cell has changed people’s perspective about energy and provided a new way to obtain electrical energy without the need to burn fossil fuels. Photovoltaic cells attracted attention because of its low cost and the flexibility in generating energy [3]. Photovoltaics also offer the highest probability in providing meaningful and sustainable change in the business community to generate energy [4]. Photovoltaic cells can operate properly in almost all regionon the earth without causing pollution that can damage the environment making it more environmentally friendly [5].
EXPERIMENTAL SECTION
and design a photovoltaic cell which has a slim size. As well, to study the effects of titania modification on ceramic membrane to the performance of the photovoltaic cells. Although the current photovoltaic cells have been widely available commercially, market expansion is still limited because of the use of liquid electrolytes, where stability is very low due to the reduction of solvent and electrode erosion. Replacement of liquid electrodes with solid medium is one good solution. However, compared to the liquid electrolytes, solid electrolyte pv cells have lower energy conversion efficiency [7].
volumetric flask to obtain I2 with a concentration of 1000 mg/L.
6.Measurement of Current and Voltage
One part of the cell was filled with 1.5 mL KI and other part with KI3 with equal volume. The part containing KI
was facing the light source. Current and voltage generated during the process of photovoltaic were measured using a multimeter that has been linked to the two electrodes of photovoltaic cell.
7.Measurement of Stability Photovoltaic Cells
Stability test was perfomed by measuring the current and voltage produced by the photovoltaic cells every day from 10.00 AM to 14.00 PM with a 30 minutes interval of measurement time.
Materials
Circular rubber (diameter of 25 mm, thickness of 4 mm), transparent plastic sheet, ceramic membrane (diameter of 50 mm, thickness of 1 mm), carbon rod (diameter of 1 mm), and pipe glue, were used to assemble the pv cell.
Chemicals
Titanium isopropoxide (C12H28O4Ti), diethanolamine/DEA (C4H11NO2), potassium iodide (KI) and iodine (I2)
were obtained from Merck, Germany. Isopropanol (C3H7OH) was obtained from Fisons, UK. These chemicals
were analytical grade. And Aqua DM (H2O) was obtained from Brata Co Chemika PT, Indonesia.
Instruments
UV-Vis Spectrophotometer (SPECTROstar Nano-BMG Labtech) was used to analyze iodine absorbance. SEM (Hitachi S-3400N) was used for membrane surface morphology characterization.
Procedures
1.Preparation of Ceramic Membranes
Ceramic membranes with a thickness of 1 mm were prepared from ceramic floor. We created six membranes for this study.
2.Preparation of Sol Titania (TiO2)
Titania sol preparation process was performed by mixing 30 mL of isopropanol with 4 mL of DEA in a beaker and stirred, then followed by the addition of 6 mL of TIP. Stirring was performed for about 4 hours to obtain titania sol.
3.Preparation of Ceramic Membrane Coating Variations with Titania
Ceramic membrane coating process was carried out by immersing five ceramic membranes into the titania sol for approximately 20 seconds. The process was followed by drying the solvent in the oven for approximately 15 minutes at 100oC. Furthermore, the ceramic membranes were calcined in the furnace at a temperature of 400oC for
about 1 hour.
Coating process was repeated to obtain a ceramic membrane with subsequent coating variations. This process was carried out to obtain a ceramic membrane with five times the variation of the coating.
4.Preparation of Photovoltaic Cells
Each ceramic membranes were assembled into photovoltaic cells. Assembling process was started by attaching a plastic sheet on the rubber by using glue pipe. After drying, two of these rubber parts were attached to the ceramic membrane, the ceramic membrane was positioned in the middle of the two rubber. At the top of both rubbers, given a hole as an entry for the carbon electrodes.
5.Preparation of KI and KI3 Electrolytes
Figure 1. Electrical circuit schematic for the characterization of pv cell [8]
10.Characterization of Membrane Ceramics with SEM-EDX Method
Scanning Electron Microscopy (SEM) - Electron Dispersion X-ray spectroscopy (EDX) analysis was performed tolearn and confirm ceramic membranes modified with titania.
RESULTS AND DISCUSSION
1.The design of Photovoltaic Cells
Figure 2. The design of photovoltaic cells
The design of photovoltaic cells used in this study was shown in Figure 2. The designed pv cells had a total thickness of 9.5 mm with 1 mm thick membrane. While the carbon electrodes had a length of 25 mm and a width of 2.7 mm with a surface area of 67.5 mm2. Ceramic membrane that has been modified with titania has functions as a filter and a barrier between ½ anode and ½ cathode cell. Anode part of the cell contained a solution of KI was the part that is facing the direction of the sun while the cathode as a container of KI3 was opposite side. The placement
of both electrolytes was based on the following reaction.
Anode : KI K++ I -I- + ɧυ I• + e -I• + I• I2
Cathode : I2 + e- 2I-
8.Analysis of Iodine in Photovoltaic Cells with UV-Vis Spectrophotometer Method
Determination of iodine compound (I2) in the photovoltaic cell after the current and voltage measurements was
carried out by taking 1 mL solution of the two sides of the cell, respectively. Two drops of 1% starch solution were added into the solution. Then, absorbance measurements were performed using UV-Vis spectrophotometer at a wavelength of 240-750 nm.
9.Performance Characterization of Photovoltaic Cell
Characterization of the current and voltage generated by photovoltaic cells was carried out using the I-V device. Parameters measured were: short circuit current (Isc), open circuit voltage (Voc), maximum current (Imax), maximum
voltage (Vmax) and fill factor (FF).
Reaction above occured continuously when the two electrodes were connected to each other using copper wire. In this study, the reaction was expected to take place in the cycle where the produced I- ion at the cathode can be
transfered to the anode to replace the I- ion which has been turned into the I• radical due to contact with sunlight in
generating electrons. Electrons will flow from the anode to the cathode through the copper wire when two electrodes were connected. The generated current and voltage can be measured using a multimeter. I- ion transfer from the
cathode to the anode occured with diffusion through the ceramic membrane which divided the two parts of the cell.
The number of cells used in this study was six cells. The difference between each cell was the ceramic membrane. Ceramic membranes were modified by using titania in order to minimize the ceramic pore size. The smaller pore ceramic was able to withstand I2 diffusion from the cathode to the anode. Each cell which has been used in this
study was given a code number (ie: cell 0, cell 1, cell 2, cell 3, cell 4 and cell 5), according to the amount of titania coating on the membrane used by each cell. Cell 0 served as the control cell, where the membranes used in cell 0 was not modified with titania. To study the performance of photovoltaic cells that have been designed in generating current and voltage, was used the continuous flow of electrons.
Span of time used to test the performance of photovoltaic cells in generatinh current and voltage were from 10:00 am to 13:30 pm with a 30 minutes interval measurement time. This time span was used due to the sun produced light with the highest intensity at that time. With the best light conditions, the cell was also assumed able to produce a good performance in generating current and voltage.
2.Effect of Membrane Modification with Titania to Performance of Photovoltaic Cells
Effect of measurement time and modification of titania membranes with the performance of photovoltaic cells to generate current and voltage were tested by using a continuous flow of electrons for two days. This continuous flow is a state in which the electrons flow continuously from the anode to the cathode during the measurement time, from at 10:00 am to 13:30 pm. The Effect of measurement time and membrane modification on the performance of the six photovoltaic cells in generating on the first day can be observed in Figure 3. it can be seen that there was a decrease substantially in the second measurement time (10:30 am) for all cells. This was caused by the use of a continuous electron flow where in this flow condition, the electrons flowed continuously from the anode to the cathode from the initial measurement (10:00 am) until the second measurement time (10:30 pm).
Figure 3. Effect of membrane modification on the performance of the photovoltaic cells to generate current on the first day 0.000
0.020 0.040 0.060 0.080 0.100 0.120 0.140
10:00 11:00 12:00 13:00
C
u
rr
en
t
(m
A
)
Measurement Time
Sel 0
Sel 1
Sel 2
Sel 3
Sel 4
Sel 5
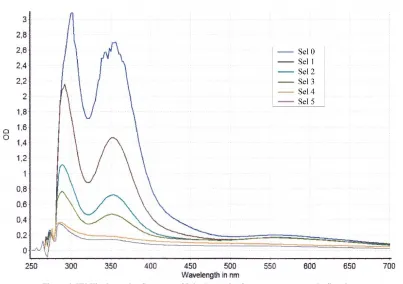
Figure 4. UV-Vis absorption Spectrum of I2 in the anode after measurement on the first day
Figure5. Effect of membrane modification on the performance of the photovoltaic cells to generate voltage on the first day
The continuous flow of electrons caused the formation of I2 in the anode proceeded rapidly, resulting the electrodes
was also experiencing rapid saturation due covered by I. This caused the performance of the cell to generate voltage
0 20 40 60 80 100 120 140
10:00 11:00 12:00 13:00
V
o
lt
ag
e
(m
V
)
Measurement Time
Sel 0
Sel 1
Sel 2
Sel 3
Sel 4
Sel 5
Effect of membrane modification with titania to withstand I2 diffusion from the cathode to the anode was confirmed
by using UV-Vis spectrophotometry analysis, as shown in Figure 4. Of the six spectral absorption peak of I2 in the
anode, at λ 350 nm, it can be said that cell 0 has the highest maximum absorption peak followed by cell 1, cell 2, cell 3, cell 4 and cell 5, respectively. Cell 5 is the cell that has the lowest maximum absorption peak. This proves that the cell 5’s membrane was able to withstand I2 diffusion longer than the others due to the cell 5’s membrane had smaller pore size than the other five cell membranes.
drop drastically during the second measurement (10:30 am). Based on Figure 5, cell 5 were the cell that had the best performance in generating voltage on the first day.
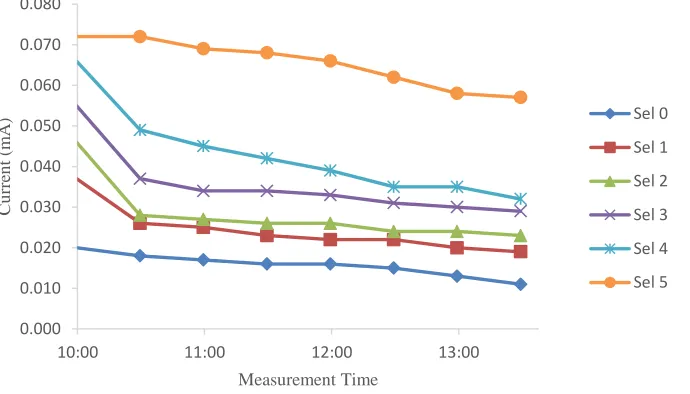
Figure 6. Effect of membrane modification on the performance of the photovoltaic cells to generate current on the second day
Effect of measurement time on the performance of six photovoltaic cells on the second can be seen in Figure 6. It appeared that the cell performance in generating current decreased alongside time measurement. The decrease in performance was caused by the increasingly saturated electrodes in the anode due covered by I2. The more saturated
electrodes caused the flow of electrons from the anode to the cathode restrained so that the resulting current would be smaller. Compared to the current measurement on the first day, currents obtained by the whole cells on the second day had decreased.
[image:6.595.142.487.104.301.2]Effect of membrane modification by using titania on the cell performance in generating current on the second day can also be observed in Figure 6. From the graph of the six cells, it can be observed that cell 5 had the best performance compared to the other cells. The maximum current generated by the cell 0 to 5 on the second day were: 0,020 ; 0,037; 0,046; 0.055; 0.066 and 0.072 mA, respectively.
Figure 7.UV-Vis absorption Spectrum of I2 in the anode after measurement on the second day
0.000 0.010 0.020 0.030 0.040 0.050 0.060 0.070 0.080
10:00 11:00 12:00 13:00
C
u
rr
en
t
(m
A
)
Measurement Time
Sel 0
Sel 1
Sel 2
Sel 3
Sel 4
Figure 8. Effect of membrane modification on the performance of the photovoltaic cells to generate voltage on the second day
[image:7.595.141.484.171.375.2]The performance of the entire cell in generating voltage decreased on the second day compared to the first day. It could also be caused by electrolytes reduction in both the anode and the cathode. The reduction of electrolytes volume resulted the performance of the entire cells in generating voltage on the second day reduced, as the number of electrons was much less that colud be generated on the second day. Voltage measurement data from all six photovoltaic cells on the second day was not shown in this paper.
Figure 9. I-V Characteristics Curve of Cell 5
3.Current – Voltage Characteristics of Cell 5
Cell 5 has been proven as the cell with the best performance in generating both current and voltage during two days of measurement. Characterization of current – voltage (I-V curve) was carried out on cell 5 to study and analyze the
0 5 10 15 20 25 30 35 40 45
10:00 11:00 12:00 13:00
V o lt ag e (m V ) Measurement Time Sel 0 Sel 1 Sel 2 Sel 3 Sel 4 Sel 5 0.000 0.020 0.040 0.060 0.080 0.100
0 20 40 60 80 100
C u rr e n t (m A ) Voltage (mV)
To confirm the formation of I2 in the anode during the measurement time, UV-Vis spectrophotometer analysis was
performed as can be seen in Figure 7. It was seen that absorption peak of I2 (in the anode) at λ 350 nm for the cells 5
had the lowest absorbance compared to absorption peak of I2 of the other cells. This proves that the cell 5’s
membrane could withstand I2 diffusion from the cathode to the anode better than the other cell’s membranes.
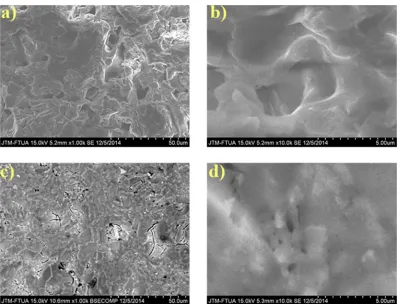
Figure 10. Results of SEM surface morphology of the ceramic membranes: a) Cell 0 (1.000x mag), b) Cell 0 (10.000x mag), c) Cell 5 (1.000x mag), d) Cell 5 (10.000x mag)
between current and voltage was inversely. This relationship was obtained by setting resistance during measurement time. The greater the resistance, the current would be lower. Based on the I-V curve, the parameters of cell 5 could be determined. They were: short circuit current (Isc), open circuit voltage (Voc), maximum current (Imax), maximum
voltage (Vmax), maximum power (Pmax), fill factor (FF) and energy conversion efficiency (η). The values of these
parameters were as follows: Isc (0.085 mA), Voc (80.9 mV), Imax (0.025 mA), Vmax (41.8 mV), Pmax (1.045 x 10⁻⁶
Watts), FF (0.152) and η (0.553%).
The values of the energy conversion efficiency (η) and fill factor (FF) obtained from cell 5 by using the IV curve were 0.553% and 0.152, respectively. The values were small for a photovoltaic cell when used as a reference to characterize the performance of a cell. This was caused by the usage of single cell. To obtain more precise measurements of both current and voltage, some units of cell 5 arranged in series or parallel circuit were required.
4.Characterization of Membrane Surface Morphology
The morphology of the surface of the ceramic membrane used in the cell 0 and cell 5 were analyzed by using Scanning Electron Microscopy (SEM), as shown in Figure 10. As previously described, cell 0 is the cell that uses a membrane that was not modified with titania, while cell 5 is the cell with a membrane that had been coated five times with titania.
From the SEM images in Figure 10, it can be observed the difference between the surface morphology of ceramic membranes that has not been modified using titania (Figure 10. a and b) with a ceramic membrane that has been modified using titania (Figure 10. c and d). Membrane which has been modified with titania has smaller pore size (5-10 µ m). While unmodified membrane has a surface pore size of 20-40 µ m. This proved that the modification of titania on ceramic membranes used in pv cells, can reduce the pore size of the membrane.
ceramic membranes to modify the surface and simultaneously modify the pore size with titania, has been performed successfully in this study.
Figure 11. Results of EDX analysis on the surface of the ceramic membrane: a) Cell 0 b) Cell 5
CONCLUSION
REFERENCES
[1]. S Thiyagu; Z Pei; MS Jhong.Nanoscale Res Lett,2012, 7(1), 172.
[2]. R Pietruszka; BS Witkowski1; G Luka1; L Wachnicki1; S Gieraltowska1; K Kopalko1; E Zielony; P Bieganski; E Placzek-Popko; M Godlewski.Beilstein J Nanotechnol, 2014, 5, 173-9.
[3].C Liu; Y Li; L Wei; C Wu; Y Chen; L Mei; J Jiao. Nanoscale Res Lett, 2014, 9(1), 107. [4].HA Alturaif; Z. ALOthman; JG Shapter; SM Wabaidur.Molecules,2014, 19(11), 17329-17344. [5]. AY Dewi; Antonov. J Teknik Elektro, 2013, 2(3), 20-28.
[7]. P Xiang; X Li; H Wang; G Liu; T Shu; Z Zhou; Z Ku; Y Rong;M Xu; L Liu; M Hu; Y Yang; W Chen; T Liu; M Zhang; H Han. Nanoscale Res Lett, 2011, 6, 606.