Chemistry Dissertations Department of Chemistry
Spring 5-5-2011
Protein-Nucleic Acid Interactions in Nuclease and Polymerases
Protein-Nucleic Acid Interactions in Nuclease and Polymerases
abdur rob Abdur Rob
Follow this and additional works at: https://scholarworks.gsu.edu/chemistry_diss
Part of the Chemistry Commons
Recommended Citation Recommended Citation
rob, abdur, "Protein-Nucleic Acid Interactions in Nuclease and Polymerases." Dissertation, Georgia State University, 2011.
https://scholarworks.gsu.edu/chemistry_diss/54
This Dissertation is brought to you for free and open access by the Department of Chemistry at ScholarWorks @ Georgia State University. It has been accepted for inclusion in Chemistry Dissertations by an authorized
administrator of ScholarWorks @ Georgia State University. For more information, please contact
AND POLYMERASES
by
ABDUR ROB
Under the Direction of Professor Zhen Huang
ABSTRACT
DNA polymerase binds to the double stranded DNA and extends the primer strand by adding
deoxyribonucletide to the 3’-end. Several reactions in the polymerase active site have been
reported by Kornberg in addition to the polymerization. We observed DNA polymerase I can act
as a pyrophosphatase and hydrolyze deoxyribonucletide. In performing the pyrophosphatase
activity, DNA polymerase I requires to interact with RNA. RNA in general, was found to
activate the DNA polymerase I as pyrophosphatase. This hydrolysis causes depletion of dNTP
and inhibits DNA polymeration synthesis in vitro. In this RNA-dependent catalysis, DNA
polymerase I catalyzes only dNTP but not rNTP. We have also observed that many other DNA
polymerases have this type of the RNA-dependent pyrophosphatase activity. Our experimental
data suggest that the exonuclease active sites most likely play the critical role in this
DNA, and RNA, we have introduced the selenium modification at the 6-position of guanine (G)
by replacing the oxygen (SeG). The SeG has been incorporated into DNA (6 nt. - 6 nucleotides) by
solid phase synthesis. The crystal structure and biochemical studies with the modified SeG-DNA
indicate that the SeDNA can base-pair with the RNA substrate and serve as a template for the
RNA hydrolysis. In the crystal structure, it has been observed that the selenium introduction
causes shifting (or unwinding) of the G-C base pair by 0.3 Å. Furthermore, the Se-modification
can significately enhance the phosphate backbone cleavage (over 1000 fold) of the RNA
substrate, although the modifications are remotely located on the DNA bases. This enhancement
in the catalytic step is probably attributed to the unwinding of the local duplex, which shifts
scissile phosphate bond towards the enzyme active site. Our structural, kinetic and
thermodynamic investigations suggest a novel mechanism of RNase H catalysis, which was
revealed by the atom-specific selenium modification.
INDEX WORDS: DNA polymerase, Klenow fragment, Selenium-modified DNA, RNA, Phasing
and crystallization, Template, Substrate, Scissile bond, Km, Kcat, Kapp, Electrophoresis, Mass
spectrometry, Pyrophosphorylosis, X-ray diffraction, MIR, MAD, SAD, Anomalous scattering,
by
A Dissertation Submitted in Partial Fulfillment of the Requirements for the Degree of
Doctor of Philosophy
in the College of Arts and Science
Georgia State University
2011
ABDUR ROB
Copyright by
Abdur Rob
by
ABDUR ROB
Electronic Version Approved:
Office of Graduate Studies
College of Arts and Sciences
Georgia State University
May 2011
Committee Chair: Dr. Zhen Huang
Committee: Dr. Stuart Anthony Allison
Dr. Yujun George Zheng
While most are dream about success,
winners wake up and work hard
to achieve it
To my son,
ACKNOWLEDGEMENTS
A dissertation only lists one author’s name, but no one could receive a Ph.D., nor should want to
receive it, without the help of many others. Acknowledging them here is not nearly enough, but
it is a start. Earning a Ph.D. degree is a long journey, mixed with excitement and pain; nobody
can overcome without sincere assistance from others.
Prof. Zhen Huang has been my advisor over the past five years and it would not be enough to say
that he always appears to me as friend, philosopher, and guide. I am very much proud of and
appreciate him, especially because he allowed me to work in two exciting projects. At the
beginning, when I had very little idea about how to study a problem scientifically, he gave me
ideas for projects that could build on the previous work and be tailored to my interests. As I
gained experience, he gave me more and more freedom to explore the questions myself. He is
always interested in my research and progresses and has suggestions for improvements. In
particular, he has taught me the importance of verifying the significance of a result, no matter
how exciting the first observation seems. I will always be thankful for the environment he has
created for me to learn and to become a scientist.
I have also learned enormously from the other members of our group. Drs. Jia Sheng and Josef
Salon helped me in synthesizing DNA and RNA oligonucleotides whenever I need them, which
helped me to keep my research forward. Drs. Julianne Caton-Williams, Lina Lin and Sarah
Spenser provided me much scientific information and encouragement in many ways. I am
offering special thanks to Dr. Jianhua Gan for introducing X-ray crystallography, a new research
Ph.D. graduate students, including Bo Zhang, Manindar Kaur, Sibo Jiang, Wen Zhang, Lilian
Kamau, Huiyan Sun, and Xifang Liu. My time here has allowed me to meet many more people,
more than I have space to mention, without whom the time I spent would not have been nearly as
TABLE OF CONTENTS
ACKNOWLEDGEMENTS ……….. v
LIST OF TABLES Chapter 2………. xi
Chapter 3………. xi
LIST OF FIGURES Chapter 2………. xii
Chapter 3………. xiv
LISTS OF SCHEMES Chapter 2……… xvi
Chapter 3……… xvi
Chapter 1: Introduction to Protein-Nucleic Acid Interactions in Nulceases and Polymerases………...………. 1
Chapter 2: RNA-dependent Pyrophosphatase Activity of DNA polymerase I…..………….... 7
2.1 Abstract ………... 7
2.2 Introduction………... 9
2.3 Materials and Methods……… 13
2.3.1 Synthesis and purification of oligonucleotides……….. 13
2.3.2 Extraction of total RNA………... 14
2.3.3 Synthesis of γ-³²P-dATP………... 14
2.3.6 Pyrophosphatase reaction………... 15
2.3.7 Polynucleotide kinase reaction………... 16
2.3.8 DNA polymerization reaction in the presence of RNA……… 16
2.3.9 TLC analysis………... 17
2.3.10 FPLC analysis………. 17
2.3.11 Gel shift assay……….. 18
2.3.12 Bacterial growth study……… 19
2.3.13 Mass spectrometry analysis………. 19
2.3.14 Kinetic analysis………... 19
2.4 Results and discussions……… 21
2.4.1 Klenow fragment hydrolyzes of dCTP into dCMP and PPi………. 22
2.4.2 Klenow fragment hydrolyzes of dATP into dAMP and PPi in presence of RNA……… 25
2.4.3 Anion exchange chromatography analysis shows dAMP as product in RNA-dependent dATP hydrolysis by DNA polymerase I……… 27
2.4.4 Mass spectrometry showed dAMP as a product in RNA dependent dATP hydrolysis by Klenow fragment……….. 34
2.4.5 The second product of dATP hydrolysis was pyrophosphate (PPi) in RNA dependent catalysis by Klenow fragment………. 36
2.4.6 The substrate of Klenow fragment in RNA dependent hydrolysis was only deoxyribonucleotides (dNTP’s)………... 39
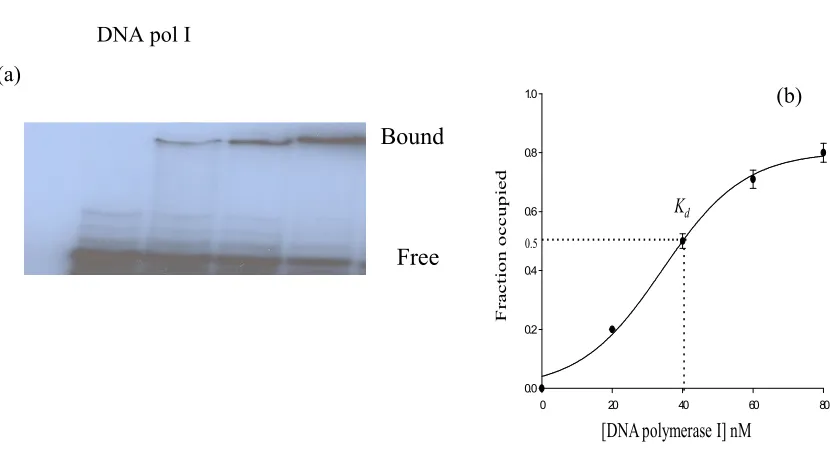
2.4.7 Binding of RNA with DNA polymerase I is fairly strong……… 48
2.4.10 Pyrophosphate inhibits dNTP hydrolysis by DNA
polymerase I in the presence of RNA……… 58
2.4.11 All DNA polymerases interact with RNA and hydrolyze dNT ………. 67
2.4.12 Three active sites of DNA polymerases involved in dNTP catalysis in the presence of RNA………... 70
2.4.13 DNA polymerases with three functional domains have higher catalytic activity in RNA dependent dNTP hydrolysis……….. 71
2.4.14 RNA dependent dNTP hydrolysis by DNA polymerase caused bacterial growth inhibition ……… 89
2.5 Summary………... 92
2.6 Conclusions……….. 96
Chapter 3: Kinetic Analysis of RNase H (BH) Enzyme with Native and Modified DNA Templates………....………. 97
3.1 Abstract ………... 97
3.2 Introduction………... 98
3.3 Methods and materials………... 107
3.3.1 Sequences used for enzymatic study………. 107
3.3.2 Gel shift assay……… 108
3.3.3 RNA substrate 5’-labeling…...………. 109
3.3.4 Reaction conditions (RNase H catalysis)………... 109
3.3.5 Urea-polyacrylamide gel analysis……….. 110
3.3.8 Melting temperature study ……… 111
3.3.9 Expession and purification of RNase H protein ………... 112
3.4 Results and Discussions……… 114
3.4.1 Crystal structure of double selenium modified DNA base pair with RNA and tr- mut- RNase H (BH) ternary……….. 114
3.4.2 Free energy of duplex formation is higher for selenium modified DNA base pair with complementary RNA………... 134
3.4.3 RNase H (BH) enzyme binds to the selenium modified DNA and RNA duplex with lower affinity……….. 144
3.4.4 Catalytic activities of truncated RNase H (BH) was higher on RNA substratebase pair with modified DNtemplate……… 152
3.4.5 Apparent reaction rate (Kapp) and apparent catalytic rate (Kcat) for tr-RNase H (BH) was higher with selenium modified DNA template……… 156
3.5 Summary………... 165
3.6 Conclusions………... 167
Chapter 2:
1. Steady state kinetic parameters of RNA dependent dATP hydrolysis by different
DNA polymerases……….. 85
Chapter 3
1. Thermodynamic Parameters for Duplex Formation by Native and Modified
DNA with RNA (vant Hoff’s Method)………. 142
2. Dissociation constants and free energies of modified DNA/RNA
duplexes binding to RNase H (BH)………... 152
3. Apparent rate constant (Kapp) of tr-RNase H (BH) enzyme on different DNA
Chapter 2:
1. Degradation of dCTP by the Klenow fragment in the presence of RNA from
different sources……… 23
2. Degradation of dATP by Klenow DNA polymerase in the presence of RNA from
various sources………... 26
3. FPLC analysis showing the generation of dAMP as a product of dATP hydrolysis
by DNA polymerase I in the presence of E.coli total RNA……… 29
4. FPLC analysis showing the retention time of dAMP and dATP eluted from anion
exchange column………... 31
5. Mass spectrometry analysis showing dAMP as a product in RNA dependent dATP
hydrolysis by DNA polymerase I………... 35
6. Generation of pyrophosphates during the degradation of γ-³²P-dATP by the Klenow
fragment in the presence of RNA………. 37
7. In RNA-dependent catalysis Klenow fragment uses dNTP as a substrate but not
rNTP……… 41
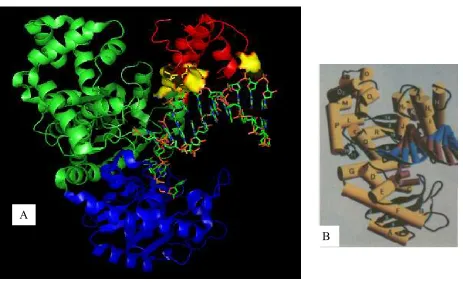
8. Cartoon diagrams of Klenow DNA polymerase complexed with dsDNA……… 43
9. Crystal structure (pdb: 1KLN) of Klenow DNA polymerase (aa 324-927) complex
with DNA duplex (13nts/10 nts)………... 45
10. Differences in protein (KF) conformation upon binding of
DNA duplex……… 46
13. Degradation of α-³²P-dCTP in presence of Klenow fragment and different
amount of RNA………. 54
14. Inhibition of DNA polymerization via dNTP hydrolysis by
DNA polymerase itself………... 56
15. Inhibition of dCTP hydrolysis by pyrophosphates………... 59
16. A comparison of primer-template DNA bound to four DNA polymerases………. 63
17. Hydrolysis of DNTP by different DNA polymerases in the presence of RNA (1) ……… 65
18. Hydrolysis of DNTP by different DNA polymerases in the presence of RNA (2) ……… 66
19. Different functional domains of DNA polymerase I………... 69
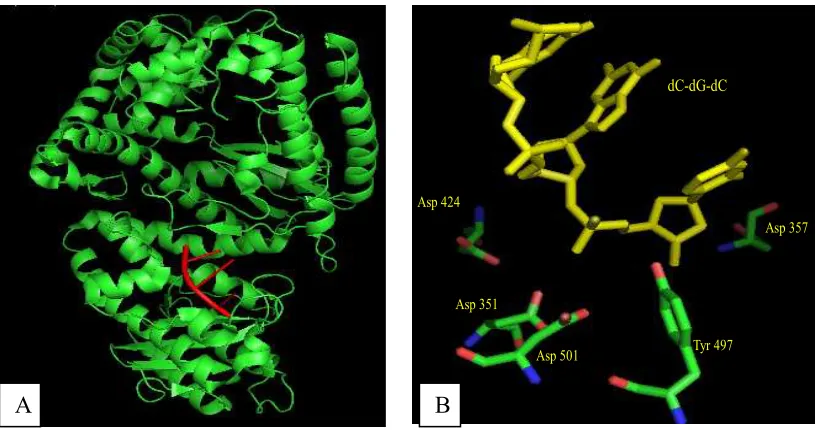
20. Crystal structure of Sulfolobus solfataricus Dpo4 enzyme complexed with primer,
template and dGTP………... 77
21. Steady state kinetic analysis of different DNA polymerases in RNA dependent
dNTP hydrolysis (1) ………. 79
22. Steady state kinetic analysis of different DNA polymerases in RNA dependent
dNTP hydrolysis (2)………... 81
23. Steady state kinetic analysis of different DNA polymerases in RNA dependent
dNTP hydrolysis (3) ………... 83
24. Effect of RNA dependent dNTP hydrolysis by DNA polymerase I on
1. Crystal structure of the ternary complex, selenium modified DNA, RNA and
tr-mut- RNase H (BH)………... 116
2. Tertiary structure of tr-RNase H (BH) C-terminal catalytic domain residues
from 61 to 193………... 118
3. DNA/RNA duplex binding to the tr-RNase H (BH) enzyme showing interacting
residues on different strand and helices and schematic diagram ofDNA/RNAduplex………. 120
4. Stereoview of the RNase HC-substrate complex………... 122
5. Superimposition of global and local structures of the 6-SeG-modified and native
DNA/RNA duplexes of the nucleic acid–protein complex……….. 125
6. The active site of D132N in complex with the RNA/DNA hybrid……….. 129
7. Diagram showing the reaction steps proposed for RNase H (BH)………... 130
8. Tm of the duplex DTmN/ RTm (5'-TGTCGTGTCG-3’/5’-ACGACACGAC-3’)
at four different concentrations……… 132
9. Tm of the duplex DTmS / RTm (5'-TGTCGTSGTCG-3’/5’-ACGACACGAC-3’)
at four different concentrations………... 136
10. Tm of the duplex DTmSe / RTm (5'-TGTCGTSeGTCG-3’/5’-ACGACACGAC-3’)
at four different concentrations………... 137
11. van’t Hoff graphical representation of reciprocal melting temperature (1/Tm)
and natural log of total strand concentrations (ln CT)……… 138
12. van’t Hoff plot for native and modified DNA/RNA duplex (1/Tm vs ln CT) ... 140
13. Analysis of RNase H (BH) binding to different modified and native
14. Catalytic activities of truncated RNase H (BH) on RNA substrate base paired
with native modified DNA templates……… 148
15. Kinetic analysis of RNase H (wild type and truncated) enzyme on RNA
substrate base paired with native DNAP and modified DNA templates……….. 153
16. Graph showing RNase H catalytic activities of different DNA templates
monitored at different reaction time………. 157
17. Catalytic activity of tr-RNase H (BH) on S-modified RNA substrate (RS, 5’-UC
Chapter 2
1. Hypothetical catalytic pathway of RNA dependent dNTP
Hydrolysis by DNA polymerase………. 90
Chapter 3
1. Synthesis of the 6-(2-cyanoethyl) seleno guanosine phosphoramidite (3) and
oligonucleotides containing the 6-SeG... 162
Protein-Nucleic Acid Interactions in Nulceases and Polymerases
Introduction
Interaction of protein and nucleic acid is the central of life, and this central dogma dictates life.
The life is based on the intricate interplays among DNA, RNA, and protein. DNA is transcribed
to RNA, which is translated to protein. Protein is never reverse-translated to RNA or DNA.
Except for retroviruses, DNA is never created from RNA either. Furthermore, DNA is never
directly translated to protein.
The replication and transcription of the genetic material found in DNA is catalyzed by protein
enzymes, and the expression of genes by translating RNA into proteins is regulated by protein
transcriptional factors. In addition, DNA can be modified by modifying enzymes through
protein-DNA interactions. Protein-DNA, protein-RNA, DNA-RNA, or protein-protein
interactions are responsible for gene expression. Gene expression is the process where
information from a gene is used in synthesizing a functional genetic product. These products are
often proteins, but in non-protein coding genes, such as rRNA or tRNA genes, the products
functional RNAs. The process and reglulation of gene expression is used by all known lifies -
eukaryotes (including multicellular organisms), prokaryotes (bacteria and archaea) and viruses -
to generate the macromolecular machinery for life. There can be dire consequences for the cell if
the interactions are lost. One example of the consequences of protein-DNA mis-interactions is
forms of cancer, there has been a mutation to the DNA binding region of p53 (2, 3). The result of
many of these mutations is that p53 is no longer able to bind DNA strongly (4), which suppreses
the cancer formation. Many other transcriptional factors can also play roles in cancer
development. For example, the basic leucine zipper AP-1 is known to be involved in the spread
of tumor cells to other organs (5, 6).
Recently identified microRNAs (miRNAs) have emerged as key post-transcriptional regulators
of gene expression and involved in diverse physiological and pathological processes (7-9).
MicroRNAs (miRNAs) are large and ubiquitous classes of non-coding RNAs that regulate
post-transcriptional silencing of target mRNA. Over 700 miRNAs have been identified in the human
genome. MicroRNA has binding recognition sequences in 57.8% of human mRNAs, with 72%
containing of those mRNAs having multiple miRNA recognition sites (10, 11). The miRNA are
70-100 nt. transcripts (pre-miRNA) and contain a 6-8 nt. seed region at its 5'-end for mRNA
binding. The pre-miRNA is first cleaved by DROSHA, a nuclear endoribonuclease III, and then
binds to the double-stranded RNA-binding proteins, followed by a active exportion to the
cytoplasm via a mechanism dependent on Exportin 5 and Ran GTPase. The pre-miRNA is
further processed in a ribonucleoprotein (RNP) complex consisting of Argonaute proteins and
Dicer (endoribonuclease III), which cleave the pre-miRNA into the mature 19-22 nucleotide
miRNA. The miRNA-Argonaute complex then binds to target mRNAs and recruits additional
unidentified proteins for regulating target mRNAs (7, 12-14). It has been reported that the central
damage (15, 16).
Protein interactions occur through similar physical forces with DNA and RNA which include
electrostatic interactions (salt bridges) (17, 18) dipolar interactions (hydrogen bonding, H-bonds)
(19, 20)entropic effects (hydrophobic interactions) (21, 22) and dispersion forces (base stacking)
(23-25). These forces contribute in varying degrees to proteins binding in a sequence-specific
(tight) or non-sequence specific (loose) manner (26).
The secondary and tertiary structure formed by nucleic acid sequences (especially in RNA)
provides an important additional mechanism by which proteins recognize and bind particular
nucleic acid sequences. The DNA- or RNA-binding function of a protein is localized in discrete
conserved domains within its tertiary structure. An individual protein can have multiple repeats
of the same nucleic acid binding domain or can have several different domains found within its
structure. The identity of the individual domains and their relative arrangement are functionally
important within the protein. Several common DNA binding domains include zinc fingers (27)
helix-turn-helix (28), helix-loop-helix (29), winged helix(30) (31) Ketan S Gajiwala and Stephen
K Burley) and leucine zipper (32). RNA-binding specificity and function are constituted by zinc
finger, KH (K homology) (33), S1 (serine rich domain) (34-36), PAZ (37, 38), PUF
(Pumilio/FBF) (39, 40) and RRM (RNA recognition motif (41, 42) domains. Multiple nucleic
acid binding domains with a single protein can increase specificity and affinity of the protein for
enzymatic domains within the binding protein (43).
Protein-RNA interactions are required in every step of gene expression. Proteins interact with
RNA in order to splice, protect, translate or degrade the message. The first interaction occurs just
after transcriptional initiation, when the complement to the promoter sequence is cleaved out of
the mRNA and the capping machinery incorporates a "GpppN" cap at the 5' end of the mRNA
(44, 45). This results in recruitment of elongation factors that regulate the reset of mRNA
transcription. Elongation is followed by 3'-end processing and splicing, resulting in a mature
RNA transcript that is exported to the cytoplasm for translation. All of these processes require
significant protein-RNA interactions and are highly regulated and complex. Many of the
regulatory elements for this process reside in non-coding regions 3' and 5' untranslated regions
(UTRs) of the mRNA (46). However, regulatory microRNAs (miRNAs) also occur in coding
regions of introns, as well as exons, non-coding genes and repetitive elements. In recent years,
increased emphasis has been placed on the importance of these non-coding RNA sequences and
their roles in cellular regulation and disease states (15, 47). However, tools for the study of
critical protein RNA interactions have been limited. If we can better understand how these
proteins interact with nucleic acids, we may be better able to treat the cancers that result from
incorrect protein-DNA and protein-RNA interactions.
Although there are plentiful methods have been developed in detecting DNA or
protein-RNA interactions, and numerous studies have been made in elucidating their functions, still there
chapters. These proteins are RNase (H) and DNA polymerase I; both are extensively studied in
three dimensional and mechanistic details. RNase H protein is an endonuclease that binds to
RNA-DNA duplex and cleaved RNA non-specifically. DNA polymerase I is a E.coli DNA
polymerase which add deoxyribonleotides at the 3’-primer end that consider as DNA repair
enzyme. This enzyme was discovered and characterized by Arthur Kornberg in 1967 (48, 49).
We have studied DNA polymerase I and we found that this DNA-dependent DNA polymerase
can also interact with RNA; this interaction causes hydrolysis of DNA precursor, the dNTP, in a
fairly higher rate. Our biochemical and kinetic analysis showed the DNA polymerases as a whole
preserve this RNA interacting property that causes dNTP hydrolysis.
Selenium now emerges as a major area of research. It is found as an essential trace element for
all living organisms. Selenium containing amino acid selenocysteine recognized as the 21st
amino acid. It is incorporated into protein by ribosome mediated protein synthesis. There are at
least 25 specific, genetically determined human selenoproteins have been identified, many of
which have only recently been discovered. Besides physiological role of selenium, its anomalous
scattering property is made possible to circumvent the phase problem in X-ray crystallography.
Now selenium is routinely being introduced into protein via selenomethionine for solving crystal
structure. Selenium is also using in nucleic acid for structure determination. Selenium has been
introduced in a variety of position in nucleobases and in ribose moiety of DNA and RNA. The
crystal structure of the selenium modified DNA and RNA provided new details about the
interactions and mechanism. It has also found that the selenium introduction produce better
crystallized with with selenium modified DNA/RNA duplex. In selenium modified DNA, which
serve as a template for RNase H (BH), seleno G (SeG) located at two positions of the 6-nts DNA.
It has been observed that the selenium modified DNA forms stable base pair with substrate RNA
in the enzyme active site. It has also been observed that selenium atom on the DNA template
causes shifting of base pair (dSeG….rC) 0.3 Å. This shifting pushed the scissile phosphorous atom of the RNA substrate towards active site although it located remotely on the template DNA.
We performed kinetic analysis for the RNase H (BH) with selenium modified DNA and RNA to
observe the shifting effect. We found that this base pair shifting resulted in enhanced catalytic
performance of RNase H (BH) over thousand folds compare to the native. The RNase H is a
ubiquitous protein found in many organisms, from bacteria to human. The role of RNase H1 has
been implicated in mitochondrial DNA replication in eukaryotes (50) , primer removal from
Okazaki fragment in lagging strand DNA synthesis (51, 52) , and DNA repair (53-55).
Our observations suggest that RNase H activity can be enhanced by introducing selenium atom
in DNA. This novel function can be addressed in unraveling mechanism of protein-DNA or
protein RNA interactions; also this strategy could be helpful to design DNA or RNA that could
Chapter 2
RNA-dependent Pyrophosphatase Activity of DNA polymerase I
2.1 Abstract
Constitutively expressed Escherichia coli DNA polymerase I is a DNA-dependent DNA
polymerase and belongs to group I of DNA polymerase. Removal of N-terminal 5´-3´
exonuclease domain of this tri-functional enzyme produces bi-functional Klenow fragment.
Polymerase, located on the C-terminal, function includes incorporation of deoxyribonucleotide
monophosphates (dNMPs) at 3´ primer end while 3´-5´ exonuclease activity excises
misincorporated dNMP form the same site, if any. The function of 5’--->3’ exonuclease domain
is implicated in removing primer during Okazaki fragment synthesis. In order to carryout
canonical functions, the DNA polymerase I requires minor groove specific binding to
primer-template complex. Here, we report that, in vitro, in the presence of RNA, the DNA polymerase I
functions as pyrophosphatase that degrade deoxyribonucleotide triphosphates (dNTPs) into their
corresponding dNMPs and pyrophosphates. However, this catalysis is primer-template
independent and requires RNA activation. The binding of RNA with DNA polymerase I is fairly
strong, very close to binding with double stranded DNA duplex. In RNA dependent catalysis
substrates are highly specific, dNTPs were being degraded while ribonucleotides (rNTPs) were
not. All four dNTPs were found to be degraded by the DNA polymerase I unlike to most other
dNTP pyrophosphatases and triphosphatases, such as MutT and dGTPase, respectively. It also
polymerases with 3’---->5’ exonuclease active site were more efficient in RNA dependent dNTP
hydrolysis. This suggested the involvement of 3’--->5’ exonuclease active site in RNA
dependent dNTP hydrolysis. The molecular mechanism of the RNA-dependent dNTP
pyrophosphatase activity of the DNA polymerase I, however, remains to be elucidated. In
summary, we found that the DNA polymerase I has a novel dNTP pyrophosphatase activity in
the presence of RNA. Importantly, this phenomenon may be generally present in vivo and may
Escherichia coli DNA polymerase I (pol I) belongs to ‘family A’ repair enzymes involved in
proofreading (56, 57), nucleotide excision repair (58), primer removal (59), and Okazaki
fragment synthesis (60). Pol I is a single chain tri-functional enzyme includes the N-terminal
5΄-3΄ exonuclease, 5΄-3΄-5΄ exonuclease (proofreading), and C-terminal polymerase functions. 5΄-5΄-3΄
exonuclease activity removes RNA primers from Okazaki fragments generated during the
replicative DNA synthesis. The proteolytic removal of N-terminal 5΄-3΄ exonuclease domain
produces bi-functional Klenow fragment that retains 3΄-5΄ exonuclease (proofreading) and
polymerase active site of the parent molecule (61). The function of the 3΄-5΄ exonuclease active
site is to remove misincorporated dNMPs from 3΄ primer ends (proofreading function), and
several dNMPs from the point of lesion in 3΄-5΄ direction during repair. The C-terminal
polymerase activity is used to fill gaps resulted from the removal of Okazaki fragment and from
removal of bases at DNA lesions (62).
DNA polymerase I is a DNA-dependent DNA polymerase as it requires binding to DNA for
their activity. The binding of DNA polymerase I to dsDNA is very strong and it also could bind
to ssDNA but weakly in this case (63). When it binds to ssDNA, the Pol I hydrolyzes
phosphodiester bond and removes dNMP from 3΄-5΄ direction by its 3΄-5΄ exonucleolytic active
site (64-67). Here, we report that, DNA polymerase I interacts with RNA and that interaction
enables DNA polymerase I to hydrolyze dNTP into dNMP and inorganic pyrophosphate. This
catalysis is RNA dependent and only dNTPs, not rNTPs, are recognized and hydrolyzed. The
molecular mechanism of this RNA dependent dNTP pyrophosphatase activity of the Pol I,
system it could be significant for several reasons. Organism needs to maintain dNTP pools in a
narrow range. The dNTPs do not have any known function other than serve as a DNA precursors
require for genome replication and repair. The imbalanced dNTP pool size may initiate
mutagenesis, stimulation of genetic recombination, chromosomal abnormalities, DNA break
down, and cell death (56, 68-71). To prevent these genomic abnormalities, organisms have
evolved multiple layers of control in dNTP biosynthesis. There are also several degradation
mechanisms exists in living system in keeping the four dNTPs concentrations in a narrow range,
just enough needed for genome replication and maintenance. The biosynthetic regulations occur
at transcription (72-75), translation (76, 77), and post-translational (78, 79) levels. Beside these
differential biosynthetic regulations, which are cell-cycle dependent (76) and compartmentalized
(80) also, another level of control is extended by degradation of DNA precursor molecules.
Pyrophsophohydrolase enzymes such as E.coli MutT, which prefers substrate in order of
8-OH-dGTP>8-OH-ATP but active on all canonical nucleoside triphosphates (81, 82), or its human
counterpart hMTH1 that also has substrate preference in order of 2-OH-dATP >8-OH-dGTP or
8-OH-dATP (83) hydrolyze the oxidized purine nucleoside triphosphates into nucleoside
monophosphates and thereby ‘sanitize’ them from dNTP precursor pools. E.coli has a unique
enzyme, deoxyguanosine triphosphate triphosphohydrolase (dGTPase) which was first
discovered by Kornberg et al. (1958) as a contaminant in partially purified E.coli DNA
polymerase I preparations. This enzyme specifically degrades dGTP into deoxyguanosine and
triphosphate or in some extent rGTP, with the Km 2-5 µM for dGTP and 150 µM for rGTP (
84-86). It has also been reported that the dGTPase could binds and stimulated by RNA as well as
hypothesized that the interactions of dGTPase with nucleic acids may prevent bacteriophage
gene T7 1.2 protein binding that would otherwise required for successful phage infection. There
is another class of enzyme called (deoxy) nucleotidases present in prokaryote and mammal in
different subcellular localization that cleaves (deoxy) mononucleotides into (deoxy) nucleosides
and phosphates (91-93). In effect, the intricate regulations of dNTP biosynthesis and
degradation rates determine the cell cycle dependent, balanced and asymmetric ((94)
concentration of dNTP in the intracellular milieu.
The DNA polymerase I is the most extensively studied DNA polymerase in perspective of
molecular, mechanistic, and structural details. In this article, this is the first time reporting of
another novel pyrophosphatase function of the Pol I which is activated by RNA. Apparently, the
RNA binding to the Pol I is different from the usual binding property of the Pol I because it is
established that it binds to ssDNA, dsDNA, and primer-template complex. In primer-template
complex binding occurs through the Arg668 residue of the Klenow fragment that makes critical
hydrogen bond to the N3 of purines and O² of pyramidines of the minor groove of the 3΄- primer
terminus (95) as well as to the ring oxygen of the deoxyribose group of the incoming dNTP (88)
which eventually insure the fidelity of dNTP incorporation (96, 97). Another unusual property
we observed here is that, comparing to other nucleotide hydrolytic enzymes (discussed above),
the Pol I degrades all the four dNTPs, but not when the substrates are rNTPs. Furthermore, we
found that the RNA –dependent dNTP hydrolytic property is not limited only to Pol I, rather a
number of DNA polymerases from different polymerase family interact in the same manner and
Michaelis-has been noticed that the DNA polymerases with the three functional domains, 5΄--->3΄
exonuclease, 3΄--->5΄ exonuclease (proofreading), and polymerase, have the highst RNA-
dependent dNTP hydrolytic activities. This analysis indicated that the exonuclease active site of
the DNA polymerase may involve in RNA-dependent dNTP hydrolysis.
Based on our limited studies the physiological implications of the RNA-dependent dNTP
hydrolysis property of the DNA polymerases is not immediately apparent. Nevertheless, among
many dNTP pools control mechanisms, our observed phenomenon may exists in the living
system which suggests an additional mechanism that may “fine-tune” the dNTP pools.
In this study, we have made a series of biochemical and kinetic studies in vitro and the
experimental results allow us to propose that the DNA polymerase I can acts as RNA-dependent
dNTP pyrophosphatase which hydrolyzes dNTP into corresponding dNMP and inorganic
pyrophosphate. This RNA interacting functions of DNA polymerase I is novel and it is rationale
2.3.1 Synthesis and purification of oligonucleotides:
Oligonucleotides:
RNA24.1 5´-AUGUGGAUUGGCGAUAAAAAACAA-3΄,
Template: DNA55.1: 5΄-d(TGTACGTTTCGGCCTTTCGGCCTCATCA-
GGTTGCCTATAGTGAGTCGTATTA CGC)-3΄,
DNA Primer 21.1: 5΄-d (GCGTAATACGACTCACTATAG)-3΄
The RNA 24.1 was purchased or synthesized chemically. Chemical synthesis was performed on
a 1.0 or 10 µmol scale using an ABI392 DNA/RNA Synthesizer and the deprotection of RNA
was done as described (98). Products were separated by 19 % polyacrylamide, 7 M urea in 1X
TBE buffer (89 mM Tris, 89 mM boric acid and 2 mM EDTA) gel (40 X 35 cm X 0.8 mm). The
gel was pre-run for 1 hr at 50 watts without cooling and electrophoresis was performed at
40-50 watts for 2 hours. After electrophoresis, the gel over a TLC plate was visualized under UV
light and desired bands were cut, crushed in 1.5 ml eppendorf tube. Gel was placed in a rotator
after addition of 3 volumes of RNase free water. The soaking was done overnight at room
temperature. RNA 24.1 was recovered by ethanol precipitation and its concentration was
measured by UV spectrophotometer. RNA 24.1 was also purchased from Dharmacon Research
Inc. and 2΄-protection groups were deprotected according to the manufacturer instructions. After
synthesis, the DNA oligonucleotides were cleaved from solid support and fully deprotected by
aqueous ammonia (concentrated) treatment for 14 h at 55 °C (99). Separation and purification
2.3.2 Extraction of total RNA
Total RNA from E.coli and Yeast were extracted using RNA purification kit (purchased from
Epicentre Biotechnologies). Briefly, 0.1 -0.5 µL of an overnight culture of E.coli (0.5-3 X 10^6
cells) were lysed with 300 uL ‘Tissue and Cell lysis solution’ containing Proteinase K incubating
at 65ºC for 10 min. 150 µL of MPC protein precipitation reagent was added, centrifuged (10
minutes ≥10,000 X g) and supernatant was collected. Precipitation of RNA was performed by
centrifugation with 70 % isopropanol at 4ºC for 10 minutes (≥10,000 X g). Contaminated DNA
was removed by incubating RNA with 200 µL DNase I solution ( 5 µL of RNase-Free DNase I
up to 200 l with 1X DNase Buffer) for 10 minutes at 37ºC. 200 µl of 2X ‘T and C Lysis
Solution’ was added, vortex for 5 seconds, and 200 µl of MPC Protein Precipitation Reagent was
added. Debris was removed by centrifugation for 10 minutes at ≥10,000 X g. Supernatant was
collected and RNA was precipitated by centrifugation with 70 % isopropanol and RNA was
washed ( twice ) with 70 % ethanol dissolved in water after air drying. Total RNA from Human
Prostate Cancer cells and RNA ladder were purchased from Ambion Technologies (USA).
2.3.3 Synthesis of γ-³²P-dATP
γ-³²P-dATP was prepared by transphosphorylation of dADP from γ-³²P-ATP catalyzed by
baker’s yeast nucleoside diphosphate kinase (EC. 2.7.4.6; Ndk, Sigma Chemical Co, St, Louis,
MO). A 20 µL reaction mixture containing 50 mM Tris-HCl buffer (pH 7.5), 5 mM MgCl2, 2.5
mM dADP, 1.25 µM γ-³²P-ATP (4 x 10^6 Ci /mol), 3.4 unit of Ndk was incubated at 37 ºC for
15 min. The reaction mixture was spotted on PEI-cellulose TLC plates (Aldrich) and developed
dATP was eluted from the cellulose with 1 ml of 0.6 M triethylammonium bicarbonate buffer
(pH 8.0), and the mixture was centrifuged. The supernatants from three washes were combined
and lyophilized, and 500 µl of 15 mM dATP was added to the lyophilized sample, yielding 15
mM γ-³²P-dATP.
2.3.4 Degradation reaction
Reactions (5 µl) contained 0.2 µl of DNA polymerase (144 nM), 0.5 µl buffer (10 mM Tris-HCl,
10 mM MgCl2, 50 mM NaCl, 1 mM dithiothreitol pH 7.9), 0.1 µl α -³²P-dCTP or α -³²P-dATP or
α -³²P-rCTP or α -³²P-rATP, 2 µl RNA (200 ng/ µl) and 2.2 µl water were incubated in water bath
for 1 hr at 37ºC. For control experiment equal volume of water was supplemented for RNA or
DNA polymerases. Different DNA polymerases were purchased from New England Biolab.
2.3.5 Alkali hydrolysis
A total of 14 µl reaction was prepared for NaOH hydrolysis. 2 µl γ-³²P-ATP, 1.4 µl 100 mM
NaOH (final 10 mM), and 10.6 µL water were mixed and heated at 90 °C and aliquots were
collected at 0,1, 5, 10, 30, and 60 min.
2.3.6 Pyrophosphatase reaction
In a total 5 µl reaction that contains 2 µl of the reaction materials , 0,5 ml buffer (10 mM
Tris-HCl, 10 mM MgCl2, 50 mM NaCl, 1 mM dithiothreitol, pH 7.9), 2.25 µl H2O, and 0.05 unit of
2.3.7 Polynucleotide kinase reaction
A total 10 µl reaction containing 1 µl of 1 µM (1 pmol) primer 21.1 mixed with 1 µl 10X PNK
buffer, 4 µl γ-³²P-ATP, 1 µl polynucleotide kinase (1 unit) and 3 µl water were mixed and
incubated in water bath at 37 °C for 1 h. Then the reaction was heated at 68 °C for 10 min to
inactivate the enzyme. 1.11 µl 3 M NaCl was added (final 30 mM) and mixed, 33.33 µl 100 %
ethyl alcohol was added (final 70 %) and chilled at -20 °C for 15 min. the reaction mixture was
centrifuged (14,000 rpm) for 15 min. at 4 °C. Supernatant was discarded, pellet was washed 3
times with 70 % ethanol, air dried and 10 µl H2O was added.
2.3.8 DNA polymerization reaction in the presence of RNA
A total of 5 µl reaction that contains 1 µl of 100 nM 5΄-labeled DNA primer 21.1(final 20 nM)
and 0.5µ l of 2 µM DNA template 55.1 (final 200 nM) were mixed with 0.5 µl buffer (10 mM
Tris-HCl, 10 mM MgCl2, 50 mM NaCl, 1 mM dithiothreitol, pH 7.9), 0.2 µl of each dNTP. The
final concentration of each dNTP was as follows: dATP - 240 nM (0.2 µl from 6 µM stock),
dTTP 60 nM (0.2 µl from 1.5 µM stock), dCTP 200 nM (0.2 µl from 5 µM stock), and dGTP
-180 nM (0.2 µl from 4,5 µM stock). Total 5 µl reactions also contain various amount of E.coli
total RNA. Reaction 1 contained no RNA (2 µl water added), reaction 2, 3, 4, 5, and 6 contained
10 ng (1 µl from 50 ng/µl stock and 1 µl water), 20 ng (2 µl from 50 ng/µl stock), 50 ng (0.5 µl
from 1 µg/ul stock and 1.5 µl water), 100 ng (1 µl from 1 g/µl stock and 1 µl water), and 200 ng
(2 µl from 1 µg/µl stock) total E.coli RNA, respectively. 0.2 µl DNA polymerase I was added to
and RNA ladder from Ambion biotechnology (USA).
2.3.9 TLC analysis
TLC plates of 10 µM layer thickness purchased from micron technology, USA. The recation
materials of amount 0.2 - 0.5 µl were placed at the bottom of the TLC plate with corresponding
controls. The bottom of the plate was submerged in the buffer keeping the loading place one inch
above the buffer layer. The chromatographic plates were allowed to soak for 30 - 45 minutes at
room temperature keeping the chamber air tight. The buffers were mixed solution of isopropyl
alcohol, ammonium hydroxide and water with ratio 5:4:2 or 6:3:1, respectively.
2.3.10 FPLC analysis
A total 150 µl reaction consists of 200 ng/µl E. coli, 100 µM dATP, were mixed with buffer
reaction buffer (10 mM Tris-HCl, 10 mM MgCl2, 50 mM NaCl, 1 mM dithiothreitol, pH 7.9). A
50 µl aliquot was removed which was regarded as “zero minute” (without enzyme). KF pol was
added to the rest to 150 nM (100 µl) concentration (final) and incubated at 37 ºC for 30 min and
50 µl aliquot was removed and placed in -20 °C. This aliquot was referred to as “30 min”. The
remaining 50 µl reaction was incubated for another 30 min which was called “1 hr” reaction. All
three reactions were analyzed by separating the reaction products by loading onto HiTrap Q HP
5 ml (Amersham bioscience) anion exchange column. The column was washed with 10 column
volumes (CV) of buffer A (10 mM sodium phosphate, pH 7.8) and impurities were eliminated
with washing 10 CV of buffer B (10 mM sodium phosphate, pH 7.8, 1M NaCI) with a flow rate
100 ml buffer B with gradient (0 – 100%) was applied to the column at the flow rate 1 ml/min.
Different fractions of the reaction products were eluted by the gradient of buffer B. The retention
time of dATP, dADP or dAMP were determined by the run of each component separately and by
co-injection of each component with the reaction mixture. The amount of substrate (dATP) and
product (dAMP) in each run were appreciated by the UV absorption spectra set at 259 nM and
from retention time in continuous increasing gradient of buffer B. Peaks of the RNA or Pol I
were also determined from the separate run.
2.3.11 Gel shift assay
Gel shift assay was performed to determine the binding constants of DNA polymerase I with
RNA. The 5’-end of 55-mer the RNA labeled with 32P by using standard method described
elsewhere. A of total of 20 µL reaction, for each enzyme concentration, contained 100 nM RNA
(final) mixed with 10 -100 pM 32P- labeled of the same RNA (5’-end) mixed with 20 nM, 40 nM,
60 nM, or 80 nM DNA polymerase I and and binding buffer (10 mM KCI, 1 mM DTT, 5 %
glycerol, pH 7.0, final) and incubated at room temperature for 30 minutes. The mixtures were
then placed at 4 °C for overnight. The reaction materials were mixed with gel loading dye (10
mM KCI, 1 mM DTT, 5 % glycerol, 0.001 % xylene blue (W/V), final) and loaded on 10 % non
denaturing polyacrylamide gel. The composition of running buffer was 5 mM tris chloride, 10
mM EDTA and pH 7.5 adjusted with acetic acid. Before loading samples the gels were pre-run
for 1hr to remove ammonium per sulfate (APS). The gels were run with a constant voltage (250
film.
2.3.12 Bacterial growth study
Chemically competent E.coli cells (Top10) was purchased from imvitrogen. A vial of competent
cell was mixed with 10 pmol pUC19 plasmid (purchased from invitrogen). In each tube H2O,
RNA (50 ng/µl), DNA polymerase I (80 ng/µl), dNTP (10 µM), RNA and DNA polymerase I ,
mixture of RNA, DNA polymerase I and dNTP, mixture of RNA, DNA polymerase I , and
rNTP, or mixture of RNA, DNA polymerase I , dNTP, and rNTP ( 10 nM) was added. The tubes
were kept on ice for 30 minutes and the cells were heat shocked for 45 sec. at 42 °C and
spreaded on Lb-ampicillin plate. The plates were incubated at 37 °C over night and in the
following day the growth of the cells were observed visually.
2.3.13 Mass spectrometry analysis
The dAMP peak at 4 minutes retention time from FPLC run (section 3.10) was collected. The
sample was desalted by desalting column and dAMP was further purified by HPLC using
Carbon-13 column (C-13, hydrophobic column). A gradient 40 % acetonitrile was used to elute
dAMP from C-13 column. Elute from C-13 column was lyophilized and dissolved in water to
concentration 10 µM. A 20 µl of the sample was sent to Core facility, Department of Chemistry,
Georgia State University for high resolution mass spectrometry analysis. The dAMP peak was
2.3.14 Kinetic analysis: There were total nine different DNA polymerases have been used for
kinetic study.The reaction conditions were as the same as degradation reaction described in
section 3.4. A total of 20 µl reaction material was prepared in determining reaction rate for each
dATP concentration. At 0, 0.5, 1, 3, 5, 7, and 10 minute’s interval 2 µl of the reaction material
was removed and reaction were terminated by immediately mixed with loading buffer (contained
7 M urea) and placing in ice. The ‘0’ minute refers to control which was separated before adding
DNA polymerase and the same amount of water added instead. There were 100 nM to 100 µM
substrate were used for determining reaction rate for each DNA polymerase. All DNA
2.4 Results and discussions
Investigations on Escherichia coli DNA polymerase I have been carried out over many decades.
A wealth of information of this DNA primer-template directed DNA polymerase remain in our
repertoire that arises from extensive structural, mutagenesis, and kinetic studies. In our present
study we have found a novel function of DNA polymerase I. We found that in the presence of
RNA, the DNA polymerase I degrades dNTP into dNMP and PPi in vitro. The reaction can be
described as follows:
dNTP
dNMP
DNA polymerase I
PPi
RNA
2.4.1 Klenow fragment hydrolyzes of dCTP into dCMP and PPi in presence of RNA
In order to determine the role of DNA polymerase I and RNA in the deoxyribonucleotide
degradation pathway in vitro, α-³²P-dCTP was incubated with or without Klenow fragment and
RNA. After incubation at 37 ºC for 1 hr, the reaction mixtures were placed on TLC plates and
the results were analyzed from co-spots of dCTP, dCDP, dCMP, and α-³²P-dCTP for the
presence of product α-³²P-dCMP and substrate α-³²P-dCTP. It has been found that degradations
of α-³²P-dCTP into α-³²P-dCTP and PPi have been taken place when the reactions contained both
Klenow fragment and RNA. In addition to total RNA from E.coli, RNA from other sources, such
as, yeast (Figure 1, lane-9), human (Figure 1, lane-10), RNA marker (Figure 1, lane-11), and 24
base-long short synthetic RNA (Figure 1, lane-12) were examined. RNA of different sources
and of different length has found to activate Klenow fragment. The hydrolysis did not caused by
RNA or KLenow DNA polymerase alone as there were no hydrolysis observed in the absence of
any of them (Figure 1, lane- 7, 8). These observations suggest that RNA could interact with
Klenow fragment and this activation enable Klenow fragment to hydrolyze dCTP into dCMP and
Hydrolysis of dCTP by Klenow DNA polymerase in the presence of RNA from various sources
Figure 1. Degradation of dCTP by the Klenow fragment in the presence of RNA from different
sources.
α-³²PdCTP - + + + + - + + + + + + + +
-dCTP + + - - -
-dCDP - - - + +
dCMP - - - - + + - - -
-RNA(E.coli) - - - + + - - + - - - - + +
-RNA(Human) - - - + - - - -
-RNA(Yeast) - - - + - - -
-RNA24.1 - - - + - -
-RNA marker - - - + - - -
-Klenow(exo+) - - - + + - + - + + + + - +
-Klenow(exoˉ) - - - + -
-EDTA - - - +
-dCDP
dCMP
dCTP
Figure 1. Degradation of dCTP by the Klenow fragment in the presence of RNA from different
sources.
A 5 µL reaction containing 0.2 µL α-³²P-dCTP (final 184 nM) incubated with or without 0.2 µL
DNA polymerase I Klenow fragment (final 144 nM). Each reaction supplemented with 2 µL
RNA (200 ng) or with 2 uL water and 0.5 ul 10X buffer 2[10 mM Tris-HCl, 10 mM MgCl2, 50
mM NaCl, 1 mM dithiothreitol (pH 7.9)]. Finally, 2.1µl water was added in each reaction to
reach the volume 5 µl. Reactions were incubated in water bath at 37 °C for 1 h. 1 µl of reactants
loaded on the TLC plate and ran in saturated ammonium solution (isopropyl alcohol: ammonium
hydroxide: water, 5:3:2) for 1 h. After air drying plates were wrapping with thin saran wrap and
location of dCDP, and dCTP were visualised under UV light. Plates were then exposed to film
and autoradiographed. Location of the radioactive substrate or product was determined by
comparing with the cold dCTP or dCMP on the TLC plate. Degradation α-³²P-dCTP,s observed
in the presence of both RNA and Klenow fragment (lane- 5) but not observed in the absence of
either RNA (lane- 7) or Klenow fragment (lane- 8). Degradation also observed when α-³²P-dCTP
incubated with Klenow fragment and RNA isolated from yeast (lane- 9) or human (lane- 10) or
RNA from commercial RNA marker (lane-11). But very little degradation was observed when
shorter-length RNA (24-mer) was present at this time (lane- 12). When mutant Klenow fragment
(exoˉ) substituted for wild-type Klenow fragments very little degradation was observed
(lane-13). This enzymatic reaction was Mg+² dependent as no degradation was observed when EDTA
2.4.2 Klenow fragment hydrolyzes of dATP into dAMP and PPi in presence of RNA
We observed in Figure 1 that the Klenow fragment hydrolyzes pyramidine nucleotide (dCTP) in
the presence of different kinds of RNA. Enzymes are very specific for substrate selection due to
specific configuration in their active site. As dCTP is one of the precursors of DNA from
pyramidine nucleotides, we examined purine nucleotide to observe whether Klenow fragment
could also hydrolyze dATP activated by RNA. We incubated dATP with Klenow fragment and
RNA and we observed that dATP was hydrolyzed into dAMP and PPi (Figure 2a, lane- 4, 7, 11,
14, and 17, Figure 2b, lane- 4, 7, and 14). It also observed that hydrolysis did not occur in the
absence of RNA (Figure 2b, lane- 17, 18) or in the absence of Klenow fragment (Figure 2a, lane-
6, 9, 13, 16, 19, Figure 2b, lane- 6, 9, 13, and 16), the same results we observed in Figure 1. We
used wild type and mutant Klenow fragment (exo-) where in the later the 3’---> 5’ exonuclease
function has been abolished by D424A point mutation. It also has been observed the Klenow
fragment (exo-) was less efficient in dydrolyzing dATP in the presence of RNA (Figure 2a, lane-
5, 8, 12, 15, 18, Figure 2b, lane- 5, 8, 12, and 15). These observations indicated that the Klenow
Figure 2: Degradation of dATP by Klenow DNA polymerase in the presence of RNA from
various sources.
Human Yeast E. coli HH WT HH Mu
RNA + + + + + + - + + + + + + + + +
Klenow (exo+) + - - + - - - + - - + - - + -
-Klenow (exo-) - + - - + - - - + - - + - - +
-dATP dAMP
1 2 3 4 5 6 7 8 9 10 11 12 13 14 15 16 17 18 19 20
Marker 23s r 55 b 24 b
dAMP
dATP
1 2 3 4 5 6 7 8 9 10 11 12 13 14 15 16 17 18
RNA + + + + + + + + + + + + -
-Klenow(exo+) + - - + - - + - - + - - +
-Klenow (exo-) - + - - + - - + - - + - - +
Hydrolysis of dATP by Klenow DNA polymerase in the presence of RNA from various sources
(a)
Figure 2: Degradation of dATP by Klenow DNA polymerase in the presence of RNA from
various sources.
32
P - α labeled dATP incubated with KF pol (exo + or exo -) or RNA or both. (a). RNA from
human, yeast, E. coli, hammerhead ribozyme (HH) (WT -wild type) and HH – mu (mutant). (b).
RNA marker (100b – 1 kb), 23S ribosomal RNA, 55-nts RNA, 24-nts RNA. Hydrolysis of dATP
occurred only when both RNA and Klenow fragment were present (Figure a, lane- 4, 7, 11, 14,
and 17) and Figure b, lane- 4, 7, 11, and 14. But hydrolysis was not observed when only RNA
(Figure a, lane- 6, 9, 13, 16 and 19) and Figure- b, lane 6, 9, 13, and 16) or only polymerase
(Figure b, lane- 17 and 18) was present. Klenow fragment (exo-) which have point mutation at
D424A hydrolyzed none or very little dATP in the presence of RNA (Figure a, lane- 5, 8, 12, 15,
and 18, Figure b, lane- 5, 8, and 12, and 15).
2.4.3 Anion exchange chromatographic analysis showed dAMP as a product of RNA dependent
dATP hydrolysis by DNA polymerase I
In Figure 1 and 2, we observed that RNA activated Klenow fragment hydrolyzed dNTP into two
products, dNMP and PPi. The presence of the 32P-α-dNMP (product) and 32P-α-dNTP (substrate)
on the TLC plates were determined by comparing the Rf (retention factor) of non-radioactive
dNMP or dNTP as reference. In this procedure, non-radioactive dNMP or dNTP was placed on
the same level as radio labeled on the TLC plate and after run the plates were illuminated under
UV light and the position of the references were marked. After radiographing the TLC plate, the
X-ray film was compared to the marks and the positions of 32P-α-dNMP or 32P-α-dNTP was
sephadex) was used to separate the product dAMP from the mixture of dAMP and dATP based
on the net charge differences between them. In anion exchange chromatography compounds are
separated on the basis of net negative charge. At pH 7.8, dAMP and dATP have, two and four
negative charges, respectively. Therefore, in DEAE – sephadex column dATP would retain
longer time, as it has more negative charges than dAMP, which could be eluted at different time
by NaCI gradient. In our experiment we incubated the substrate dATP with DNA polymerase I in
the presence of E.coli total RNA for different time periods and analyzed by FPLC using anion
exchange column. We analyzed three sets of reactions, “0 min”, “30 min”, and “1 hour”. The “0
min” reaction contained only dATP (substrate) and E.coli total RNA but without DNA
polymerase I. The “30 min” and “1 hour” reactions contained dATP (substrate), E.coli total RNA
and DNA polymerase I and incubated for 30 min and 1 hr, respectively. The profiles were
presented in Figure 3. When the “0 min” reaction was subjected to chromatography by anion
exchange column, only dATP peak was observed with retention time 11.34 min with the UV
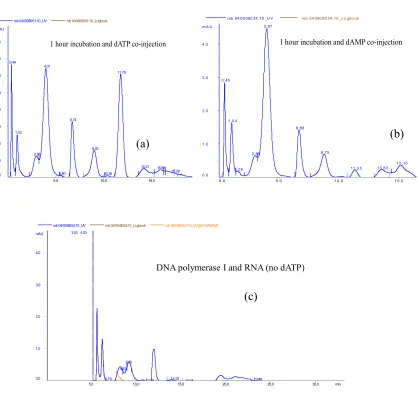
Figure 3: FPLC analysis showing the generation of dAMP as a product of dATP hydrolysis by
DNA polymerase I in the presence of E.coli total RNA.
“0 min” incubation
(dATP and RNA, no enzyme) “30 min” incubation
(dATP , RNA, and enzyme) “1 hr.” incubation
(dATP , RNA and enzyme)
dATP dAMP
dATP dAMP + PPi
RNA
DNA polymerase I
Column: Anion Exchange (DEAE) Buffer A: 10 mM Sodium phosphate, pH 7.8; Buffer B: 10 mM Sodium phosphate, pH 7.8, 1 M NaCI
FPLC analysis
rob 040908028:10_UV rob 040908032:10_UV rob 040908037:10_UV1
0.0 0.5 1.0 1.5 2.0 2.5 3.0 mAU
0 0.0 20 5.0 40 10.0 60 15.0 80 20.0100 12025.0 ml min
4 min
11.34 min
“ “
“ “
“ “
Figure 3: FPLC analysis showing the generation of dAMP as a product of dATP hydrolysis by
DNA polymerase I in the presence of E.coli total RNA.
The substrate dATP was incubated with DNA polymerase I in the presence of E.coli total RNA
for different time periods and analyzed by anion exchange column. Blue -“0 min”, E.coli total
RNA and dATP (without DNA polymerase I), only dATP peak at retention time 11.34 min with
UV intensity 3.5 mAU was observed and no peak showed up at 4.0 min retention time. Green -
E.coli total RNA, dATP, and DNA polymerase I incubated for 30 min. The dATP peak was
reduced to 2.75 mAU and simultaneously dAMP peak appeared at 4.0 min retention time with
UV intensity 2.0 mAU. Red - E.coli total RNA, dATP, and DNA polymerase I incubated for 1
hr. The 11.34 min dATP peak totally disappeared and the dAMP peak at 4.0 min retention time
Figure 4. FPLC analysis showing the retention time of dAMP and dATP eluted from anion
exchange column.
rob 040908051:10_UV rob 040908051:10_Logbook
0.0 0.5 1.0 1.5 2.0 2.5 3.0 3.5 4.0 mAU
5.0 10.0 15.0 20.0
0.44 1.03 2.98 4.01 5.60 6.74 9.03 10.36 11.78
14.21 15.88 17.38
1 hour incubation and dATP co-injection
rob 04 09 080 34: 10 _U V rob 04 090 80 34: 10 _Lo gbo ok
0 .0 1 .0 2 .0 3 .0 4 .0 m A U
0. 0 5 .0 1 0. 0 1 5. 0
0. 45
1 .0 4
1. 55 2. 99
3. 97
6. 68
8. 75
11 .3 5 13 .5 5 1 5. 16
1 hour incubation and dAMP co-injection
(a) (b)
(c)
Retention time profiles of dAMP and dATP in chromatographic analysis
rob 040908053:10_UV rob 040908053:10_Logbook rob 040908053:10_UV@01,BASEM1
0.0 1.0 2.0 3.0 4.0 mAU
5.0 10.0 15.0 20.0 25.0 30.0 min
3.03 4.03
6.79 8.52
9.10
11.46 14.23 15.81 23.48
DNA polymerase I and RNA (no dATP)
Figure 4. FPLC analysis showing the retention time of dAMP and dATP eluted from anion
exchange column.
(a) dATP was mixed with the reaction (dATP, RNA, and Klenow DNA polymerase) that has
incubated for 4 hours. The resulted mixture was injected into anion exchange column. The UV
intensity of dATP peak at retention time 11.34 has increased (comparing with “red” in figure 3).
(b) dAMP was mixed as the same as in (a) following same procedure. The peak at retention time
4.0 min was raised from UV intensity 3.0 mAU to 4.3 mAU. (c) RNA and Klenow DNA
polymerase were incubated for 1 hour (without substrate dATP) and was injected into anion
exchange column following the same procedure. There was no peaks were observed at 4 min
When the same reaction mixture was incubated for 30 min by the addition of DNA polymerase I,
the same dATP peak was observed but with decreased UV intensity (2.75 mAU). This “30 min”
incubation reaction has generated the products dAMP that can be visualized at retention time 4
min (green) with UV intensity 2.0 mAU. After incubating the same reaction for one hour, all the
products (dATP) were hydrolyzed, as a result there was no dATP peak was visualized at
retention time 11.35 min (red). This disappearance of the substrate was due to the hydrolysis of
dATP that can be observed as conversion to dAMP that appeared at the retention time 4.0 min
with higher UV intensity. It was also noticeable that in “0 min” (blue) there was no peak for
dAMP but at “30 min” (green) the dAMP peak appeared with UV intensity 2.0 mAU which was
increased to 2.75 mAU by “1 hr” incubation (red). So the anion exchange chromatographic
results has proven the presence of the product dAMP in the reaction mixture that contained the
substrate dATP, DNA polymerase I, and RNA. The retention time of dAMP and dATP, 4.0 min
and 11.34 min, respectively, was confirmed by mixing dAMP or dATP with 1 hr incubation
mixtures and were analyzed using the same procedure described in Figure 3. It could be observed
that in “1 hr” reaction where all the dATP was hydrolyzed (red, Figure 3), by the addition of the
dATP in the same reaction, the UV intensity was re-appeared at the same retention time 11.34
min (Figure 4b). So it was very much clear that the peak at retention time 11.34 min in Figure 3
was for the substrate dATP. In the same manner the peak at 4 min in Figure -3 (red) which was
increased from the UV intensity 2.75 mAU to 4.5 mAU by the addition of dAMP was for the
2.4.4 Mass spectrometry showed dAMP as a product in RNA dependent dATP hydrolysis by
DNA polymerase I
In order to confirm further the dAMP as a product of dATP hydrolysis by RNA dependent DNA
polymerase I, we analyzed the reaction product by mass spectrometry. The dAMP peak (Figure
3, retention time 4 min) from anion exchange column which has been incubated for one hour
(red, Figure 3) was collected. The sample was desalted by desalting column and dAMP was
separated by HPLC using C-13 column (hydrophobic column). A gradient 40 % acetonitrile was
used to elute dAMP from C-13 column. Elute from C-13 column was lyophilized and analyzed
by mass spectrometer. Results is shown in Figure 5 and dAMP peak was observed with a
molecular mass 330 ([M − H]−). This mass spectrometry analysis provided the evidence that
Figure 5. Mass spectrometry analysis showing dAMP as a product in RNA-dependent dATP
hydrolysis by DNA polymerase I.
The MS was analyzed by electrospray ionization method [M − H]−. The molecular mass of
dAMP is 331and removing one proton the mass appeared as 330 for major species.
15:37:52 inMeOH+0.5%NH3
100 120 140 160 180 200 220 240 260 280 300 320 340 360 380 400 420 440 460 480 500 520 540 560 580 600
%
0 100
ROB_II_ESI_NEG_HUANG_042508 15 (0.279) TOF MS ES-
2.11e3 330.0
331.0
Mass spec. ESI
Mol. Mass dAMP = 331
N N N N NH2 O H OH H H H H O P -O O -O
330
331
dATP
RNAdAMP + PPi
Klenow DNA polymerase
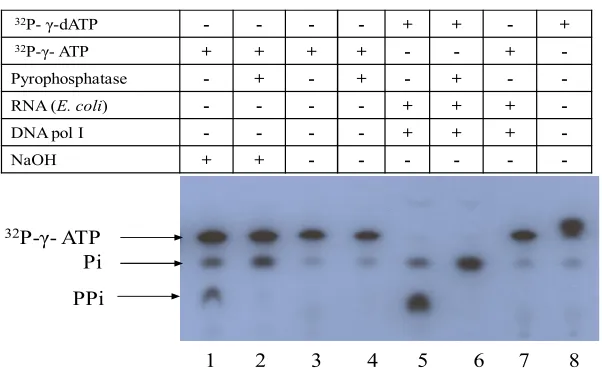
[image:54.612.104.512.246.551.2]2.4.5 The second product of dATP hydrolysis was pyrophosphate (PPI) in RNA-dependent
catalysis by DNA polymerase I
Deoxyribonucleoside triphosphates (dNTP) were found to hydrolyze into two products,
deoxyribonucleoside monophosphates and inorganic pyrophosphate, by DNA polymerase I in
the presence of RNA (Figure 1, 2). The product dAMP was confirmed by placing cold dAMP as
reference and co-spot with reaction that produced dAMP. The presence of dAMP was further
established by FPLC (Figure 3) and mass spectrometry analysis (Figure 5). In order to proof the
PPi as another reaction product of RNA dependent dATP hydrolysis, ³²P-γ--dATP was incubated
with DNA polymerase I and RNA. In ³²P-γ-dATP, the terminal gamma phosphate was
radio-labeled and upon hydrolysis into dAMP and PPi, only the PPi, but not dAMP, would be
visualized on radiogram when run on the TLC plate. First, a marker was developed by partially
hydrolyzing γ-³²P-ATP with 10 mM NaOH (90 ºC, 1 hr incubation), to generate pyrophosphate,
monophosphate, and non-hydrolyzed γ-³²P-ATP. The marker was used to detect the relative
positions of the products generated from ³²P-γ--dATP hydrolysis by DNA polymerase I in the
presence of RNA. The alkali hydrolysis of γ-³²P-ATP produced three bands, 32PPi (bottom), 32Pi
(middle), and nonhydrolyzed ATP (Figure 6, lane-1). The position of nonhydrolyzed
³²P-γ-ATP was confirmed by placing intact ³²P-γ--³²P-γ-ATP (Figure 6, lane-3) and 32PPi by hydrolyzing it
with inorganic pyrophosphatase enzyme. The partially alkali hydrolyzed reaction was neutralized
by10 mM HCL and the reaction was treated with inorganic pyrophosphatase. By this
enzyme,32PPi was hydrolyzed to 32Pi and as a result the 32PPi was disappeared and accumulated
as 32Pi in lane- 2 (Figure 6). The intensity of 32Pi band in lane- 2 (Figure 6) became stronger than