Least Square based Curve Fitting in Internet Access
Traffic Sharing in Two Operator Environment
Diwakar Shukla
Department of Mathematics andStatistics
Dr. H.S. Gour Central University, Sagar, M. P., India
Kapil Verma
Department of Computer Science, M.P. Bhoj (Open) University,
Bhopal, M. P., India. ,and B.T. Institute of Research & Technology, Seronja, Sagar, M.P.
Sharad Gangele
Department of Computer Science,M.P. Bhoj (Open) University, Bhopal, M. P., India.,
ABSTRACT
In Internet service market, at many places the competition occurs among internet service providers. The network suffers from congestion and users have priority to prefer that network having lowest congestion. During the repeated connecting attempt process the user has to maintain call-by-call effort. In this paper Markov chain model is used to establish a relationship between internet access traffic sharing and blocking probability of the network. The model based relationship has been simplified into the linear relationship. The accuracy of the fitting is examined through coefficient of determination. This process has eased up the multiple parameter based complicated relationship into a much simplified form. An average linear relationship is predicted for handy applications.
Keywords
User behavior, Transition Probability Matrix (TPM), Markov Chain Model (MCM), Coefficient of Determination (COD), Confidence Interval.
1.
INTRODUCTION
The broadband infrastructure of computer network is growing fast but even then in rural and remote areas the dominant methodology of accessing internet is through public switch telecommunication network (PSTN) in many countries. The modem is used and dial-up-setup is the key of technology model of user’s behavior with the following assumptions:
1. The user initially chooses one of the two operators (indicated as O1 and O2) with probability p and 1-p (initial share) respectively.
2. The probability (p) can take into account all the factors that may lead the user to choose one of the two operators as his first choice, including the range of services it offers and past experience.
3. After each failed attempt the user has two choices, he can either abandon (with probability PA) or switch to the other operator for a new attempt.
4. Switching between the two operators is performed on a call-by-call basis and depends just on the latest attempt. 5. During the repeated call attempt process the blocking
probabilities L1 and L2 (i.e. the probabilities that the call attempt through the operator O1 or O2 fails), and the probability of abandonment PA stay constant.
2. A REVIEW
The stochastic process has been used by many scientists and researchers for the purpose of statistical modelling whose detailed description is in Medhi [1], [2]. Chen and Mark [3] discussed the fast packet switch shared concentration and output queueing for a busy channel. Hambali and Ramani [4]
evaluated multicast switch with a variety of traffic patterns. Newby and Dagg [6] have a useful contribution on the optical inspection and maintenance for stochastically deteriorating system. Dorea et al. [8] used Markov chain for the modelling of a system and derived some useful approximations. Yeian and Lygeres [10] presented a work on stabilization of class of stochastic different equations with Markovian switching. Shukla et al. [11] advocated for model based study for space division switches in computer network. Francini and Chiussi [7] discussed some interesting features for QoS guarantees to the unicast and multicast flow in multistage packet switch. On the reliability analysis of network a useful contribution is by Shukla et al. [13] whereas Paxson [9] introduced some of their critical experiences while measuring the internet traffic. Shukla et al. [14], [15], [16], [17], [18], [19] and [20] presented different dimensions of Internet traffic sharing in the light of share loss analysis. Shukla et al. [21], [22], [23], [24], [25] and [26] have given some Markov Chain model applications in view to disconnectivity factor, multi marketing and crime based analysis. Shukla and Thakur [27] presented Index based internet traffic analysis of users by a Markov chain model . Shukla et al. [28], [29], [30], [31] and [32] discussed cyber crime analysis for multidimensional effect in computer network and internet traffic sharing. Shukla et al. [33], [34], [35], [36], [37], [38], [39] and [40] discussed the elasticity property and its impact on parameters of internet traffic sharing in presence blocking probability of computer network specially when two operators are in business competitions with each other in a market. Shukla et al. [41] presented analysis of user web browsing using Markov chain model for iso-browser share probability. Shukla et al. [42] studied least square curve fitting for Iso-failure in web browsing using Markov chain model.
3. DEFINING A SYSTEM
Naldi [5] has suggested state discrete time Markov chain model containing
O1: The first operator O2: The Second operator Z: Success
A: Abandon state
Z
A
O1 O2
1
L1PA L2PA
1-L1 1-L2
L1
L2
Fig.1 Markov chain model of the user’s behavior [Naldi [5]]
Let{X(n), n=0} be a Markov chain over four state O1, O2, Z, A. the X(n) is the position of user at the nth call attempt. The starting conditions are as describe by [Naldi [5]]
(0) 1 (0) 2 (0) (0) [ ]
[ ] 1
...(3.1)
[ ] 0
[ ] 0
P X O p
P X O p
P X Z
P X A
Assume that L1 and L2 are blocking probabilities of operator O1 and O2, pA is the probability of abandoning attempt process, Naldi [5] has obtained the following transition probability matrix and some interesting results. Since the user switches from O1 and O2 only if his call fails and if he does not abandon, the transition probability from O1 to O2 is L1 (1-pA). Consequently, the probability of a call places through O1 being completed is a single attempt is 1-L1.
The one–step transition probabilities matrix as stands by [Naldi [5]] is:
1 2
1 1 1 1
2 2 2 2
0
(1
)
1
(1
)
0
1
...(3.2)
0
0
1
0
1
0
0
A A
A A
O
O
Z
A
O
L
p
L
L p
O
L
p
L
L p
Z
A
q
q
Following results are derived by [Naldi [5]]:
( ) ( 1)
1 2 2
( ) ( 1)
2 1 1
[ ] [ ] (1 ) ...(3.3)
[ ] [ ] (1 ) ...(3.4)
n n
A
n n
A
P X O P X O L p
P X O P X O L p
After unwrapping the recursions we get the general relationships for O1
( )
1 1 2
( ) 1
1 2 1 2
[ ] ( ) .(1 ) ,
...(3.5)
[ ] (1 ) ( ) .(1 ),
n n n
A
n n n
A
P X O p L L p n even
P X O p L L L p n odd
2 1 2
( ) 1
2 1 1 2
...(3.6)
[ ] ( ) .(1 ) ,
A
n n n
A
P X O pL L L p n odd
4. TRAFFIC SHARING
Traffic sharing [Naldi [5]] presents how the users traffic is shared between the two operators. This computation is based on general assumption that
(i) if user fail to connect O1 he switches to operator O2 (ii) if he fail to O2 then comes backs to O1 for connection
attempts
(iii) if the call is well connected the attempts process terminates immediately.
For infinitely large number of attempts Naldi [5] derived following expressions related to traffic sharing between two operators
( )
2
1 0 1 1 2
1 2
(1 )(1 )
lim (1 ) ..(4.1)
1 (1 )
n
A n
A
p p p L
P P L
L L p
( ) 1
2 0 2 2 2
1 2
(1 ) (1 )
lim (1 ) ...(4.2)
1 (1 )
n A
n
A
p pL p
P P L
L L p
The expressions 1
P and P2 are functions of p, L1, L2 and pA
. So we express (4.1) and (4.2) as
1 1( 1, 2, , A) ...(4.3)
P f L L p p
2 2( 1, 2, , A) ...(4.4)
P f L L p p
These variables 1
P and 2
P highly depend on blocking probability L1 and L2 as suggested by Naldi [5]. Therefore it is as interesting thought to established a direct relationship between
P
1 and L1, P2 and L2. We assume1
P
=g1 (L1) when L2, p, pA are constant …..(4.5)2
P = g1 (L2) when L2, p, pA are constant …. (4.6)
5.
LEAST SQUARE CURVE FITTING
BETWEEN TRAFFIC SHARING AND
BLOCKING PROBABILITY
In particular, let ussuggest a linear relationship with constants a & b
1 . 1 ....(5.1)
P a b L
Let (
(
P L
1 ,i 1i)
i
1, 2, 3....
n
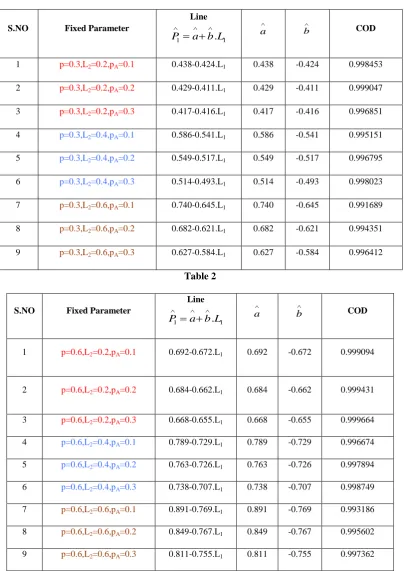
be n observations generatedfrom equation (4.1) keeping values fixed for p, pA and L2. Suppose n=9 and blocking probabilities for L1 are (0.1, 0.2, 0.3, 0.4, 0.5, 0.6, 0.7, 0.8, 0.9) then using (4.1), the generated data of
1
P is in table (4, 5, 6) varying over p, L2 and pA. The
1
P is obtained using line equation (5.1) along with least
square estimates a b,
[image:2.595.75.259.71.248.2]Table 1
S.NO Fixed Parameter
Line
1
.
1P
a b L
a
b
COD
1 p=0.3,L2=0.2,pA=0.1 0.438-0.424.L1 0.438 -0.424 0.998453
2 p=0.3,L2=0.2,pA=0.2 0.429-0.411.L1 0.429 -0.411 0.999047
3 p=0.3,L2=0.2,pA=0.3 0.417-0.416.L1 0.417 -0.416 0.996851
4 p=0.3,L2=0.4,pA=0.1 0.586-0.541.L1 0.586 -0.541 0.995151
5 p=0.3,L2=0.4,pA=0.2 0.549-0.517.L1 0.549 -0.517 0.996795
6 p=0.3,L2=0.4,pA=0.3 0.514-0.493.L1 0.514 -0.493 0.998023
7 p=0.3,L2=0.6,pA=0.1 0.740-0.645.L1 0.740 -0.645 0.991689
8 p=0.3,L2=0.6,pA=0.2 0.682-0.621.L1 0.682 -0.621 0.994351
[image:3.595.97.502.86.658.2]9 p=0.3,L2=0.6,pA=0.3 0.627-0.584.L1 0.627 -0.584 0.996412
Table 2
S.NO Fixed Parameter
Line
1
.
1P
a b L
a
b
COD
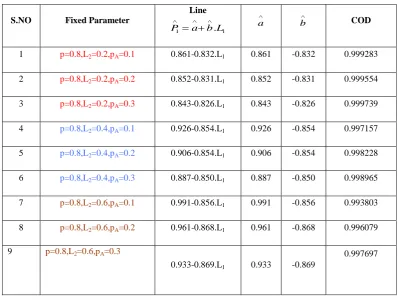
1 p=0.6,L2=0.2,pA=0.1 0.692-0.672.L1 0.692 -0.672 0.999094
2 p=0.6,L2=0.2,pA=0.2 0.684-0.662.L1 0.684 -0.662 0.999431
3 p=0.6,L2=0.2,pA=0.3 0.668-0.655.L1 0.668 -0.655 0.999664
4 p=0.6,L2=0.4,pA=0.1 0.789-0.729.L1 0.789 -0.729 0.996674
5 p=0.6,L2=0.4,pA=0.2 0.763-0.726.L1 0.763 -0.726 0.997894
6 p=0.6,L2=0.4,pA=0.3 0.738-0.707.L1 0.738 -0.707 0.998749
7 p=0.6,L2=0.6,pA=0.1 0.891-0.769.L1 0.891 -0.769 0.993186 8 p=0.6,L2=0.6,pA=0.2 0.849-0.767.L1 0.849 -0.767 0.995602
S.NO Fixed Parameter
Line
1 . 1
P a b L
a
b
COD
1 p=0.8,L2=0.2,pA=0.1 0.861-0.832.L1 0.861 -0.832 0.999283
2 p=0.8,L2=0.2,pA=0.2 0.852-0.831.L1 0.852 -0.831 0.999554
3 p=0.8,L2=0.2,pA=0.3 0.843-0.826.L1 0.843 -0.826 0.999739
4 p=0.8,L2=0.4,pA=0.1 0.926-0.854.L1 0.926 -0.854 0.997157
5 p=0.8,L2=0.4,pA=0.2 0.906-0.854.L1 0.906 -0.854 0.998228
6 p=0.8,L2=0.4,pA=0.3 0.887-0.850.L1 0.887 -0.850 0.998965
7 p=0.8,L2=0.6,pA=0.1 0.991-0.856.L1 0.991 -0.856 0.993803
8 p=0.8,L2=0.6,pA=0.2 0.961-0.868.L1 0.961 -0.868 0.996079
9 p=0.8,L2=0.6,pA=0.3
0.933-0.869.L1 0.933 -0.869
0.997697
6.
FITTING STRAIGHT LINE
Since, we have suggested an approximate the relationship between parameter P1 and L1 like a straight lineP1 a b L. 1
normal equations are
1 1
1 1
2
1 1 1 1
1 1
.
...(6.1) .
n n
i
i i
n n
i i
i i
P n a b L
P L a L b L
By solving (6.1) the least square estimates of are a and b are (denoted as a, b
:
1 1
1 1
1
...(6.2)
n n
i
i i
a
P
b
L
n
1 1 1 1
1 1
2 2
1 1
1 1
( )( )
....(6.3)
( )
n n
i
i i
n n
i i
n P L P L
b
n L L
Where n is the number of observations in sample (n) and the resultant straight line is
1 1
....(6.4)
P
a
b L
The coefficient of determination (COD) is defined as
2 1 1
2 1 1
( )
COD= ...(6.5)
( )
i i
P P
P P
where
1
1 i
P P
n
is mean of original data of P1 obtainedthrough Markov chain model. The term
1 . 1
P a b L
is the
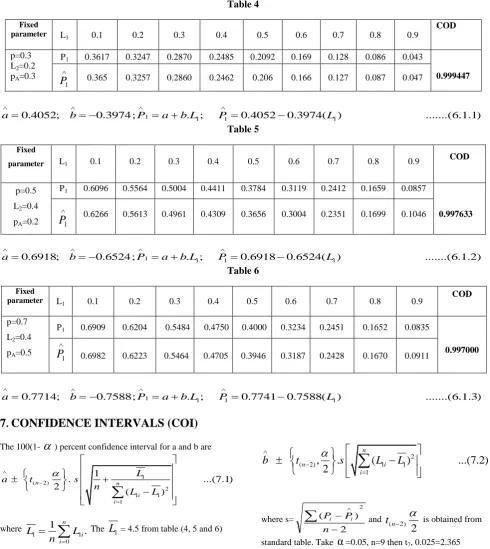
[image:4.595.98.497.91.398.2]Table 4
Fixed
parameter L1 0.1 0.2 0.3 0.4 0.5 0.6 0.7 0.8 0.9
COD
p=0.3 L2=0.2 pA=0.3
P1 0.3617 0.3247 0.2870 0.2485 0.2092 0.169 0.128 0.086 0.043
0.999447
1
P
0.365 0.3257 0.2860 0.2462 0.206 0.166 0.127 0.087 0.0471 1 1 1
0.4052; 0.3974; . ; 0.4052 0.3974( ) ...(6.1.1)
a b P a b L P L
Table 5
Fixed
parameter L1 0.1 0.2 0.3 0.4 0.5 0.6 0.7 0.8 0.9 COD
p=0.5 L2=0.4 pA=0.2
P1 0.6096 0.5564 0.5004 0.4411 0.3784 0.3119 0.2412 0.1659 0.0857
0.997633
1
P
0.6266 0.5613 0.4961 0.4309 0.3656 0.3004 0.2351 0.1699 0.10461 1 1 1
0.6918; 0.6524; . ; 0.6918 0.6524( ) ...(6.1.2)
a b P a b L P L
Table 6
Fixed
parameter L1 0.1 0.2 0.3 0.4 0.5 0.6 0.7 0.8 0.9 COD
p=0.7 L2=0.4 pA=0.5
P1 0.6909 0.6204 0.5484 0.4750 0.4000 0.3234 0.2451 0.1652 0.0835
0.997000
1
P
0.6982 0.6223 0.5464 0.4705 0.3946 0.3187 0.2428 0.1670 0.09111 1 1 1
0.7714; 0.7588; . ; 0.7741 0.7588( ) ...(6.1.3)
a b P a b L P L
7
.CONFIDENCE INTERVALS (COI)
The 100(1-
) percent confidence interval for a and b are1 ( 2)
2 1 1 1
1
. ...(7.1)
2
( )
n n
i i
L
a t s
n
L L
where
1 1
0 1
. n
i i
L L
n
TheL
1= 4.5 from table (4, 5 and 6)2
( 2) 1 1
1
,
.
(
)
...(7.2)
2
n
n i
i
b
t
s
L
L
where s=
2 ) (
2
n P
Pi i and
( 2)
2
n
t
is obtained from [image:5.595.54.545.74.624.2]standard table. Take
α
=0.05, n=9 then t7, 0.025=2.365Table: 7 Confidence interval for constant a and b
Fixed parameter
Constant (a) Constant (b) Confidence Interval
p=0.3,L2=0.2,pA=0.3
a
=0.4052
b
=-0.3974for a: ( a=0.3989, a=0.4114) for b: ( b=-0.4024, b=-0.3924)
p=0.5,L2=0.4,pA=0.2
a
=0.6918
b
=-0.6524p=0.7,L2=0.4,pA=0.5
a
=0.7741b
=-0.7588for a: (a=0.6796, a=0.7833 ) for b: (b=-0.7686, b=-0.7491)
Average Estimates a0.6237 b0.6029 1 1
1 1
(
)
0.6237
0.6029(
)
P
a
b L
P
L
9. CONCLUSION
The expression showing the simple relationships between variables
P and L
1 1, as derived by Naldi [5] are complicated and having many input parameters like p, pA, L2 etc. If we keep all these three fixed, the expression of relationship is even not simple. By using of method least square the linear approximate relationship is displayed in table 1, 2 and 3. The similar are also in table 4, 5 and 6. The coefficients of determination (COD) have values near to 1 showing the best fitting of straight line between1 1
P and L. The confidence interval for estimated value a and b
are indication for
good fitting of line.We define P1 a b L( 1)
in table 7
where a, b are average estimate obtain through all tables. We found that average linear relationship which is best fitted for prediction is
1 0.6237 0.6029( 1)
P L
10.REFERENCES
[1]. Medhi, J. (1991): Stochastic models in queuing theory, Academic Press Professional, Inc., San Diego, CA. [2]. Medhi, J. (1992): Stochastic Processes, Ed.4, Wiley
Eastern Limited (Fourth reprint), New Delhi.
[3]. Chen, D.X. and Mark, J.W. (1993): A fast packet switch shared concentration and output queuing, IEEE Transactions on Networking, vol. 1, no. 1, pp. 142-151. [4]. Hambali, H. and Ramani, A. K., (2002): A performance
study of at multicast switch with different traffics, Malaysian Journal of Computer Science. Vol. 15, Issue No. 02, Pp. 34-42.
[5]. Naldi, M. (2002): Internet access traffic sharing in a multi-user environment, Computer Networks. Vol. 38, pp. 809-824.
[6]. Newby, M. and Dagg, R. (2002): Optical inspection and maintenance for stochastically deteriorating systems: average cost criteria, Jour. Ind. Statistical Associations. Vol. 40, Issue No. 02, pp. 169-198.
[7]. Francini, A. and Chiussi, F.M. (2002): Providing QoS guarantees to unicast and multicast flows in multistage packet switches, IEEE Selected Areas in Communications, vol. 20, no. 8, pp. 1589-1601.
[8]. Dorea, C.C.Y., Cruz and Rojas, J. A. (2004): Approximation results for non-homogeneous Markov chains and some applications, Sankhya. Vol. 66, Issue No. 02, pp. 243-252.
[9]. Paxson, Vern, (2004): Experiences with internet traffic measurement and analysis, ICSI Center for Internet Research International Computer Science Institute and
[10]. Yeian, C. and Lygeres, J. (2005): Stabilization of class of stochastic differential equations with Markovian switching, System and Control Letters. Issue 09, pp. 819-833.
[11]. Shukla, D., Gadewar, S. and Pathak, R.K. (2007 a): A stochastic model for space division switches in computer networks, International Journal of Applied Mathematics and Computation, Elsevier Journals, Vol. 184, Issue No. 02, pp235-269.
[12]. Shukla, D. and Thakur, Sanjay, (2007 b) Crime based user analysis in internet traffic sharing under cyber crime, Proceedings of National Conference on Network Security and Management (NCSM-07), pp. 155-165, 2007.
[12]. Shukla, D., Virendra Tiwari, M. Tiwari and Sanjay Thakur [2007 c]: Rest State analysis of Internet traffic distribution in multi-operator environment published in the Journal of management Information Technology (JMIT-09), Vol. 1, pp. 72-82
[13]. Agarwal, Rinkle and Kaur, Lakhwinder (2008): On reliability analysis of fault-tolerant multistage interconnection networks, International Journal of Computer Science and Security (IJCSS) Vol. 02, Issue No. 04, pp. 1-8.
[14].Shukla, D., Tiwari, Virendra, Thakur, S. and Deshmukh, A. (2009 a):Share loss analysis of internet traffic distribution in computer networks, International Journal of Computer Science and Security (IJCSS), Malaysia, Vol. 03, issue No. 05, pp. 414-426.
[15]. Shukla, D., Tiwari, Virendra, Thakur, S. and Tiwari, M. (2009 b) :A comparison of methods for internet traffic sharing in computer network, International Journal of Advanced Networking and Applications (IJANA).Vol. 01, Issue No.03, pp.164-169.
[16]. Shukla, D., Tiwari, V. and Kareem, Abdul, (2009 c) All comparison analysis in internet traffic sharing using markov chain model in computer networks, Georgian Electronic Scientific Journal: Computer Science and Telecommunications. Vol. 06, Issue No. 23, pp. 108-115. [17]. Shukla, D, Tiwari, M., Thakur, Sanjay and Tiwari, Virendra [2009 d]: Rest State Analysis in Internet Traffic Distribution in Multi-operator Environment, (GNIM's) Research Journal of Management and Information Technology, Vol. 1, No. 1, pp. 72-82.
[19]. Shukla, D., Jain Saurabh, Singhai Rahul and Agarwal R.K. [2009 f]: A Markov chain model for the analysis of round robin scheduling scheme, International Journal of Advanced Networking and Applications (IJANA), vol. 01, no. 01, pp. 01-07.
[20]. Shukla, D., Thakur S. and Deshmukh Arvind [2009 g]: State probability analysis of Internet traffic sharing in computer network, International Journal of Advanced Networking and Applications (IJANA), vol. 1, issue 1, pp. 90-95.
[21]. Shukla, D., Tiwari, Virendra, and Thakur, S. (2010 a): Effects of disconnectivity analysis for congestion control in internet traffic sharing, National Conference on Research and Development Trends in ICT (RDTICT-2010), Lucknow University, Lucknow.
[22].Shukla, D., Gangele, Sharad and Verma, Kapil, (2010 b): Internet traffic sharing under multi-market situations, Published in Proceedings of 2nd National conference on Software Engineering and Information Security, Acropolis Institute of Technology and Research, Indore, MP, (Dec. 23-24,2010), pp 49-55.
[23].Shukla, D., and Thakur, S. (2010 c): Stochastic Analysis of Marketing Strategies in internet Traffic, INTERSTAT (June 2010).
[24].Shukla, D., Tiwari, V., and Thakur, S., (2010 d): Cyber Crime Analysis for Multi-dimensional Effect in Computer Network, Journal of Global Research in Computer Science(JGRCS), Vol. 01, Issue 04, pp.31-36. [25].Shukla, D., Tiwari V. and Thakur S. [2010 e]: User
behavior Based Probability Analysis of Internet Traffic Distribution in Two market in Computer Networks, Kalpagam Journal of Cambridge Studies (KJCS) [26].Shukla, D., Tiwari V. and Thakur S. [2010 f]:
Performance Analysis for Two Call Attempt of rest State Based Traffic Network, International Journal of Advanced Networking and Application (IJANA) [27].Shukla, D. and Thakur, Sanjay [2010]: Index based
Internet traffic sharing analysis of users by a Markov chain probability model. , Karpagam Journal of Computer Science, vol. 4, no. 3, pp. 1539-1545.
[28]. Shukla, D., Tiwari, V., Thakur, S. and Deshmukh, A.K. [2010 a]: Two call based analysis of internet traffic sharing, International Journal of Computer and Engineering (IJCE), Vol. 1, No. 1, pp. 14-24.
[29].Shukla, D. and Singhai, Rahul [2010 b]: Traffic analysis of message flow in three cross-bar architecture in space division switches, Karpagam Journal of Computer Science, vol. 4, no. 3, pp. 1560-1569.
[30]. Shukla, D., Thakur, Sanjay and Tiwari, Virendra [2010 c]: Stochastic modeling of Internet traffic management, International Journal of the Computer the Internet and Management, Vol. 18, no. 2 pp. 48-54.
[31]. Shukla, D., Tiwari, Virendra and Thakur, Sanjay [2010 d]: Cyber crime analysis for multi-dimensional effect in computer network, Journal of Global Research in Computer Science, Vol.1, no. 4. pp. 14-21.
[32]. Shukla, D. and Thakur, Sanjay [2010 e ]: Iso-share Analysis of Internet Traffic Sharing in Presence of Favoured Disconnectivity, GESJ: Computer Science and Telecommunications, 4(27), pp. 16-22.
[33]. Shukla, D., Gangele, Sharad, Verma, Kapil and Singh, Pankaja (2011 a): Elasticity of Internet Traffic Distribution Computer Network in two Market Environment, Journal of Global research in Computer Science (JGRCS) Vol.2, No. 6, pp.6-12.
[34]. Shukla, D., Gangele, Sharad, Verma, Kapil and Singh, Pankaja (2011 b): Elasticities and Index Analysis of Usual Internet Browser share Problem, International Journal of Advanced Research in Computer Science (IJARCS),Vol. 02, No. 04, pp.473-478.
[35].Shukla, D., Gangele, Sharad, Verma, Kapil and Thakur, Sanjay, (2011 c): A Study on Index Based Analysis of Users of Internet Traffic Sharing in Computer Networking, World Applied Programming (WAP), Vol. 01, No. 04, pp. 278-287.
[36]. Shukla, D., Tiwari, Virendra and Thakur, Sanjay [2011] Analysis of Internet Traffic Distribution for User Behavior Based Probability in Two Market Environment, International Journal of Computer Application (IJCA), Vol. 30, Issue No. 08. pp. 44-51.
[37]. Shukla, D., Gangele, Sharad, Singhai, Rahul and Verma, Kapil, (2011 d): Elasticity Analysis of Web Browsing Behavior of Users, International Journal of Advanced Networking and Applications (IJANA), Vol. 03, No. 03, pp.1162-1168.
[38]. Shukla, D., Verma, Kapil and Gangele, Sharad, (2011 e): Re-Attempt Connectivity to Internet Analysis of User by Markov Chain Model, International Journal of Research in Computer Application and Management (IJRCM) Vol. 01, Issue No. 09, pp. 94-99.
[39]. Shukla, D., Gangele, Sharad, Verma, Kapil and Trivedi, Manish, (2011 f): Elasticity variation under Rest State Environment In case of Internet Traffic Sharing in Computer Network, International Journal of Computer Technology and Application (IJCTA) Vol. 02, Issue No. 06, pp. 2052-2060.
[40]. Shukla, D., Gangele, Sharad, Verma, Kapil and Trivedi, Manish, [2011]: Two-Call Based Cyber Crime Elasticity Analysis of Internet Traffic Sharing In Computer Network, International Journal of Computer Application (IJCA) Vol.02, Issue 01, pp.27-38.
[41]. Shukla, D., Singhai, Rahul [2011]: Analysis of User Web Browsing Using Markov chain Model, International Journal of Advanced Networking and Application (IJANA), Vol. 02, Issue No. 05, pp. 824-830.
[42]. Shukla, D., Verma, Kapil and Gangele, Sharad, [2012]: Iso-Failure in Web Browsing using Markov chain model and Curve Fitting Analysis, International Journal of Modern Engineering Research (IJMER), Vol. 02, Issue
![Fig. 1 Markov chain model of the user’s behavior [Naldi [5]]](https://thumb-us.123doks.com/thumbv2/123dok_us/8119265.793658/2.595.75.259.71.248/fig-markov-chain-model-the-user-behavior-naldi.webp)