LFC of an Interconnected Power System with Thyristor
Controlled Phase Shifter in the Tie Line
K. P. Singh Parmar
CAMPS, National Power Training Institute, Faridabad, India
S. Majhi
Indian Institute of Technology, Guwahati, India
D. P. Kothari
Formerly with I.I.T. Delhi currently with RAISONI Group of
Institutions, Nagpur, India
ABSTRACT
This paper presents the analysis of the load frequency control (LFC) of a realistic two area interconnected power system having diverse sources of power generation. A Thyristor Controlled Phase Shifter (TCPS) is used in series with AC tie line for improving the dynamic performance of the LFC system. The power system simulation is done using MATLAB Simulink and control problem is solved using MATLAB programming. An optimal output feedback control strategy using TCPS with pragmatic viewpoint is presented. Optimal gain settings of the output feedback controller with and without TCPS are obtained following a step load perturbation in either of the areas by minimizing the quadratic performance index. Simulation results show that due to the presence of TCPS, the dynamic performance in terms of settling time and overshoot is greatly improved. The system with TCPS is capable of suppressing the area frequency and tie line power deviations more effectively under the occurrence of area load perturbations.
Keywords
Load Frequency Control, MATLAB Simulink, Output Feedback, Thyristor Controlled Phase Shifter.
1.
INTRODUCTION
Frequency deviation is a direct result of the imbalance between the electrical load and the power supplied by the connected generators, so it provides useful index to indicate the generation and load imbalance [1]-[2]. LFC provides an effective mechanism for adjusting the generation to minimize the area frequency deviation and regulate tie line power flows. The LFC system realizes generation changes by sending signals to the under-control generating units [2]. The LFC performance is highly dependent on how generating units respond to the commands. The generating unit response characteristics are dependent on many factors, such as type of unit, fuel, control strategy, and operating point [2]-[7]. LFC is one of the important control problems in interconnected power system design and operation, and is becoming more significant today due to the increasing size, changing structure, emerging multi-energy sources and new uncertainties, environmental constraints, and complexity of power systems [4]-[8].
Mostly researchers considered hydro or thermal generating units in control areas [8]-[16], whereas in real situation, control area may have variety of sources of generations such as Hydro, Thermal, Gas, Nuclear, Solar, wind etc and such control areas represented by an equivalent of thermal or hydro unit dynamics only may not result in a realistic design of LFC
control [3]. The concept of power system with multi-source power generation in each area as presented by Hassan Bevrani [3] is taken for the simulation of this interconnected power system. In this paper, a two area interconnected power system model comprising Hydro, Thermal with Reheat turbine and Gas units in each area as shown in Figure 1 is presented. TCPS is connected in series with the AC tie line for stabilizing the area frequency and tie line power deviations [12]-[16]. The linearized models of governors, reheat turbines, Hydro turbines and Gas turbines are used for simulation of the proposed power system [1] [5] [17]-[20].
The Flexible AC Transmission Systems (FACTS) devices provide more flexibility in power system operation and control. TCPS is an effective FACTS device for the tie line power flow control of an interconnected power system. The TCPS device is modeled and used in series with tie lines to improve the dynamic performance of LFC of the interconnected power systems [12]-[16].
In this paper, the dynamical response of the LFC problem is improved with a practical point of view by considering the output feedback control strategy using TCPS. Practically, access to all of the state variables of a system is limited and measurement of all of them is not feasible and also costly. An output feedback control strategy is presented in this paper to overcome this problem. Literature survey shows that most of the researchers applied optimal control theory on thermal -thermal power systems only [8] [10] [11]. Some researchers have studied the LFC of thermal-thermal or hydro-thermal power systems considering TCPS but surprisingly there is hardly any literature that applies optimal output feedback control strategy for the LFC of realistic interconnected power system considering TCPS [4][12]-[16].The main contributions of the present work are:
(a). Simulation of a realistic power system with TCPS using MATLAB Simulink tool and MATLAB coding for solving the controller design problem.
(b). Improvement of the dynamic response of LFC system in a realistic two area interconnected power system considering TCPS in series with tie line.
(c). Comparison of the dynamic responses of the LFC of the power system with and without TCPS.
2.
INCREMENTAL TIE LINE POWER
FLOW CONSIDERING TCPS
system considering a TCPS in series with the tie line is shown in Figure 2. In a conventional interconnected power system, the incremental tie line power flowPtie12from area-1 to area-2
can be expressed as [1]
12
12 1 2
2 ( )
tie
T
P s F s F s
s
(1)
When a TCPS is connected in series with the tie line as shown in Figure 2, the current flowing from control area 1 to control area 2 can be expressed [14] as
1 1 2 2
12
12
( )
a a a a
tie
V V
i
jX
(2)
Now, the tie line power becomes
12 12 1 ( 1 ) 12
tie tie a a
P jQ V i
(3) Using equations (2) and (3) and separating the real and imaginary parts , Ptie12 becomes
1 2
12 1 2
12
Sin( )
a a
tie a a
tie
V V
P
X
(4)
Perturbinga1,a2 and from their nominal values 0
1
a
, 0
2
a
and 0
, respectively,
1 2 0 0 0
12 1 2 1 2
12
cos( )sin( )
a a
tie a a a a
tie
V V P
X
(5)
Since
(
a1
a2
)
is very small, therefore1 2 1 2
sin(
a
a
) (
a
a
)1 2 0 0 0
12 1 2 1 2
12
cos( )( )
a a
tie a a a a
tie
V V
P
X
(6) Let
1 2 0 0 0
12 1 2
12
cos( )
a a
a a
tie
V V
T
X
(7)
12
tie
P
can be given as
12 12( 1 2) 12
tie a a
P T T
(8) Where;
1 2 1
t
a f dt
and
2 2 2
a f dt
Taking the Laplace transform of equation (8)
12
12 1 2 12
2
( ) ( ) ( ) ( )
tie
T
P s F s F s T s
s
(9)
As given in equation (9), tie line power flow can be controlled by controlling the phase shifter angle. The phase shifter angle can be given [13] [15] as
( ) Error( ) (1 )
K
s s
sT
(10)
Where; Kand Tare gain constant and time constant of TCPS.
3.
TCPS CONTROL STRATEGY
Error signal to TCPS can be any signal such as the area frequency deviation or area control error to control the TCPS phase shifter angle. If the frequency deviation of area-1 is sensed as error signal, it can be used as the control signal to the TCPS unit to control the TCPS phase shifter angle which results in controlling the tie line power flow [13] [15]. Thus,
1
( ) ( )
(1 )
K
s F s
sT
(11)
and
12
12 1 2 12 1
2
( ) ( ) ( ) ( )
(1 )
tie
T K
P s F s F s T F s
s sT
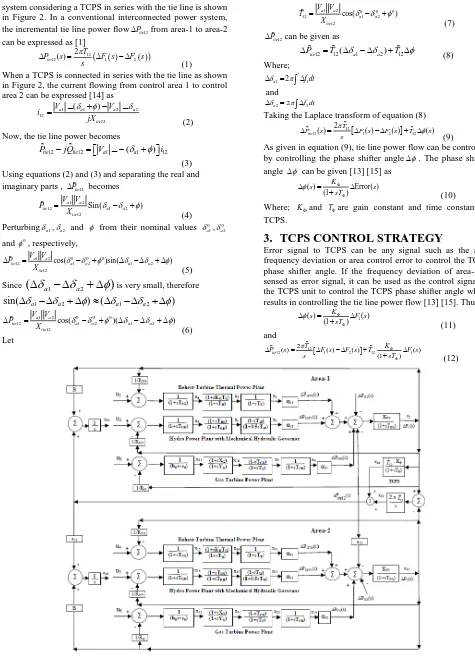
[image:2.595.52.527.70.728.2](12)
Figure 2: Schematic of interconnected power system considering TCPS in series with tie line
4.
CONTROLLER DESIGN
The key equations and design steps of optimal output feedback controller [21] are presented in this section. The interconnected power system considered for study can be described in state space form [1] [8] [22]- [24] as
xAx Bu (13) and
yCx (14)
Where; x=[x1 x2...x26 ]T is a state vector u= [u1 u2...u6 ]T is a control vector y= [y1 y2 y3 y4 ]
T
is an output vector
A,B and C are constant matrices with the dimensions of
26×26, 26×6 and 4×26, respectively.
Let the output feedback control law [21] be given as
u Ky (15)
Where Kis an output feedback gain matrix of dimension 6×4. The cost function (J) is
0
1 2
T T
J x Qx u Ru dt
(16)
In equation (16), Q is a 26×26 positive semi-definite symmetric state cost weighting matrix and R is a 6×6 positive semi-definite symmetric control cost weighting matrix. For stability, all the Eigen values of the matrix
A BKC
shouldhave negative real parts [21]. The optimal output feedback controller of designer’s choice is obtained by minimizing the cost function [21]-[24] and the controller design is carried out through an efficient MATLAB code [25]-[26].
Table 1. Power generation scheduling to match the nominal load of the individual area
Total area load (MW)
Thermal contribution
(MW)
Gas contribution
(MW)
Hydro contribution
(MW)
1740 1000 240 500
Participation factor
0.5747 0.1380 0.2873
5.
SIMULATION OF THE REALISTIC
POWER SYSTEM MODEL WITH TCPS
The two area interconnected power system model with TCPS is shown in Figure 1. The realistic two area interconnected power system with TCPS which comprises more practical combination of generating units in each area is simulated using MATLAB Simulink [25][26]. As shown in Figure 1, each area comprises Reheat thermal, Hydro and Gas generating units and the two equal areas are interconnected. The simulation of this interconnected power system in a new power system environment is based on the concepts of considering variety of generators with their corresponding participation rates in each area [3] and TCPS [13]-[14]. The
governor turbine dynamic models of Reheat thermal, Hydro and Gas generating units taken for simulation are described in [5] [17]-[20].
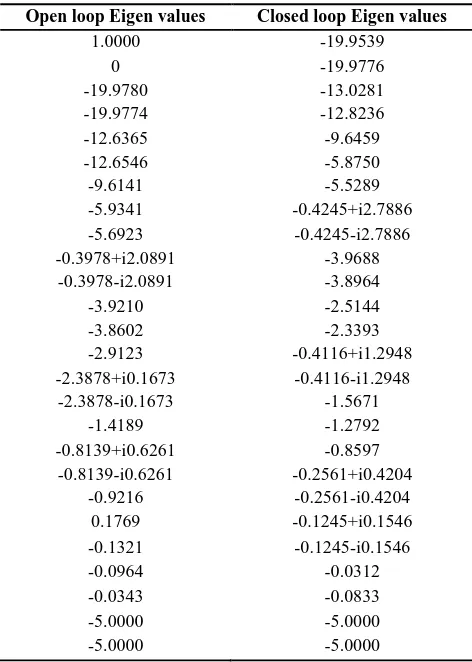
Table 2. Eigen values with open and closed secondary loop of the system
Open loop Eigen values Closed loop Eigen values
1.0000 -19.9539
0 -19.9776
-19.9780 -13.0281
-19.9774 -12.8236
-12.6365 -9.6459
-12.6546 -5.8750
-9.6141 -5.5289
-5.9341 -0.4245+i2.7886
-5.6923 -0.4245-i2.7886
-0.3978+i2.0891 -3.9688
-0.3978-i2.0891 -3.8964
-3.9210 -2.5144
-3.8602 -2.3393
-2.9123 -0.4116+i1.2948
-2.3878+i0.1673 -0.4116-i1.2948
-2.3878-i0.1673 -1.5671
-1.4189 -1.2792
-0.8139+i0.6261 -0.8597
-0.8139-i0.6261 -0.2561+i0.4204
-0.9216 -0.2561-i0.4204
0.1769 -0.1245+i0.1546
-0.1321 -0.1245-i0.1546
-0.0964 -0.0312
-0.0343 -0.0833
-5.0000 -5.0000
-5.0000 -5.0000
Furthermore, in the new environment, generators may or may not participate in the LFC task and participation rates are not the same for all participant generators. Let the participation factor of kth generator unit and ith area beki. In a given control area, the sum of participation factors [2] [3] is equal to 1. The system parameter values are given in Appendix. The nominal loading of each area is taken 1740MW with the power generation scheduling and generator participation factors as given in Table 1.
[image:3.595.310.546.257.588.2]to obtain dynamic responses of the system for 1% step load perturbations (SLPs) in the area-1.
Table 3. Dynamic response comparison in terms of overshoot (OS)
OS of ∆f1 OS of ∆f2 OS of
12
tie
P
Without TCPS -0.0327 -0.0236 -0.0070
With TCPS -0.0212 -0.0115 -0.0042
% Reduction in OS
35.16 51.27 40
6.
SIMULATION
RESULTS
AND
DISCUSSION
The optimum values of the K of the output feedback controller for the simulated power system are obtained using MATLAB code. The optimal value of K for the power system with TCPS in series with AC tie line is
1.4403 -0.3501 5.9512 -0.5304 0.3917 0.0360 -1.2367 0.1723 0.4581 -0.2227 2.0621 -0.2545 0.0507 0.4669 0.5904 0.5599 -0.3390 -0.5334 -1.6054 -0.3123 -0.0326 0.0117 0.1349 0.0827
K
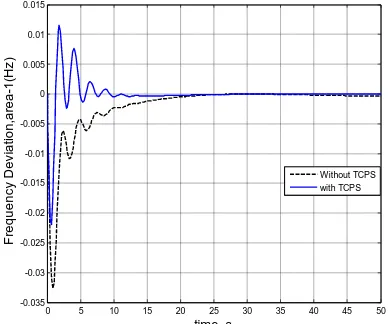
Dynamic responses of the system are obtained for 1% SLP in the area-1. The Eigen values of the system with open and closed secondary loop are given in Table 2. The closed loop Eigen values have negative real parts and satisfy the system stability conditions. The frequency deviation responses of area-1 and area-2 are shown in Figures 3 and 4. The tie line power deviation response is shown in Figure 5. It is observed that the output feedback controller considering TCPS in power system gives better dynamic responses having relatively smaller peak overshoot and lesser settling time with zero steady state error as compared to the power system without TCPS. The quantitative comparison is made in Tables 3 and 4 where percentage reduction in the overshoot (OS) of ∆f1, ∆f2and Ptie12becoming 35.16, 51.27 and 40, respectively
and the settling time of ∆f1, ∆f2and Ptie12becoming 34.11,
[image:4.595.310.539.94.325.2]53.29 and 74.29, respectively. The phase angle deviation of TCPS in response to 1% SLP in area-1 is shown in Figure 6 where maximum phase angle deviation on positive side is 1.270 and on negative side is 1.760.
Figure 3: Frequency deviation response of area-1 for 1% SLP in the area-1
Table 4. Dynamic response comparison in terms of settling time (ST) ST of ∆f1 ST of ∆f2 ST of 12 tie P
Without TCPS 20.08 19.59 29.96
With TCPS 13.23 9.15 7.70
[image:4.595.337.515.363.522.2]% Reduction in ST 34.11 53.29 74.29
[image:4.595.64.258.559.721.2]Figure 4: Frequency deviation response of area-2 for 1% SLP in the area-1
Figure 5: Tie line power deviation response for 1% SLP in the area-1
Figure 6: TCPS phase shift deviation response for 1% SLP in the area-1
0 5 10 15 20 25 30 35 40 45 50
-0.035 -0.03 -0.025 -0.02 -0.015 -0.01 -0.005 0 0.005 0.01 0.015 time, s F re q u e n c y D e v ia ti o n ,a re a -1 (H z ) Without TCPS with TCPS
0 5 10 15 20 25 30 35 40 45 50
-0.025 -0.02 -0.015 -0.01 -0.005 0 0.005 0.01 0.015 time, s F re q u e n c y D e v ia ti o n ,a re a -2 (H z ) Without TCPS with TCPS
0 10 20 30 40 50 60 70 80
-7 -6 -5 -4 -3 -2 -1 0 1 2 3x 10
-3 time, s T ie l in e P o w e r D e v ia ti o n ( P U M W ) Without TCPS with TCPS
0 2 4 6 8 10 12 14 16 18 20
[image:4.595.336.512.569.723.2]7.
CONCLUSION
An attempt is made in this paper to improve the dynamic performance of LFC of the power system by considering TCPS. A simple but practical controller is proposed to control the TCPS phase angle which in turn controls the tie line power flow. The output feedback controller for the power system with TCPS gives better dynamic response having relatively smaller peak overshoot and lesser settling time with zero steady state error as compared to the power system without TCPS. The dynamic response of the system with TCPS is improved significantly with the percentage reduction in the overshoot (OS) of ∆f1, ∆f2and Ptie12becoming 35.16,
51.27 and 40, respectively and the settling time of ∆f1, ∆f2and
12
tie
P
becoming 34.11, 53.29 and 74.29, respectively. The
simulation results show that proposed control strategy considering TCPS is very effective and guarantees good performance.
8.
APPENDIX
0
12
2000 (Rated capacity of each area)
1740 MW (Nominal load of each area) 60 Hz, 5 MWsec/MVA
0.0145 pu MW/Hz,
68.9655 Hz/pu MW, 11.49 sec,
0.06 sec, 0.3 sec, 0.0433 rt
L
PS PS
SG T
TH
P MW
P
f H
D
K T
T T T
R R
12
2.4 / ,
0.4312, 1, 0.3 , 10.2sec, 1.1sec, 4.9sec, 28.749sec,
0.2 sec, 0.6 sec, 1.1sec 1, 0.049sec, 0.239sec,
0.01sec, 0.2sec TCPS parameters
1.5 rad/Hz,
HY G
R R
W RS RH
GH G G
g g F
CR CD
R Hz puMW
B a K T
T T T
T X Y
c b T
T T
K
0 0
max max
0.1sec
( ) 10 , ( ) 10
T
positive negative
9.
REFERENCES
[1]D.P. Kothari and I.J. Nagrath. Modern Power System Analysis. 4th ed. New Delhi: McGraw Hill; 2011.
[2]Hassan Bevrani, Takashi Hiyama. Intelligent Automatic Generation Control. New York: CRC Press Taylor and Francis; 2011.
[3]Hassan Bevrani. Robust Power System Frequency Control. New York: Springer; 2009, pp.15-31.
[4]Ibraheem, P. Kumar and D.P. Kothari, Recent philosophies of automatic generation control strategies in power systems, IEEE Trans Power Syst. 20 (1), 2005, pp.346-357.
[5]P. Kundur. Power System Stability and Control. Fifth reprint. New Delhi: Tata McGraw Hill; 2008.
[6]D.P. Kothari and J.S.Dhillon. Power System Optimization. 2nd ed. New Delhi: Prentice Hall; 2010
[7]O.I. Elgerd. Electric Energy System Theory: an introduction. 2nd ed. New York: McGraw-Hill; 1983.
[8]C.E. Fosha and O.I. Elgerd. The megawatt frequency control problem: a new approach via optimal control theory. IEEE Trans Power Appl Syst. 89(4), 1970, pp. 563-577.
[9]H. Golpira, H. Bevrani and H. Golpira. Application of GA optimization for automatic generation control design in an interconnected power system. Energy Conversion and Management. 52, 2011, pp. 2247-2255.
[10]M. Aldeen and H. Trinh. Load frequency control of interconnected power systems via constrained feedback control schemes. Int J Comput Elect Eng. 20 (1), 1994, pp. 71-88.
[11]O.I. Elgerd and C. Fosha. Optimum megawatt frequency control of multi-area electric energy systems. IEEE Trans Power Appl. Syst. 89 (4), 1970, pp. 556-563.
[12]H. Shayeghi , H.A. Shayanfar and A. Jalili. LFC Design of a Deregulated Power System with TCPS Using PSO. International Journal of Electrical and Electronics Engg. 3, 10, 2009, pp. 632-640.
[13]Rajesh Joseph Abraham, D Das and A. Patra. Damping oscillations in tie power and area frequencies in a thermal power system with SMES-TCPS combination. Journal of Electrical Systems. 7-1, 2011, pp. 71-80.
[14]Rajesh Joseph Abraham, D. Das and Amit Patra. AGC of a Hydrothermal System with Thyristor Controlled Phase Shifter in the Tie-Line. IEEE conf. proceedings. 2006
[15]C.Srinivasa Rao. Improvement of Dynamic Performance of AGC of Hydrothermal System Employing Capacitive Energy Storage and TCPS. Innovative Systems Design and Engineering. Vol. 2, No. 6, 2011, pp. 63-71.
[16]K.Subbaramaiah, V.C.Jagan Mohan and V.C.Veera Reddy. Comparison of Performance of SSSC and TCPS in Automatic Generation Control of Hydrothermal System under Deregulated Scenario. International Journal of Electrical and Computer Engineering. Vol.1, No.1, 2011, pp. 21-30.
[17]IEEE power engineering systems committee report. Dynamic models for steam and hydro turbines for power systems studies. IEEE Trans. Power App. Syst. vol. PAS-92, 1973.
[18]IEEE power engineering systems committee report. Hydraulic turbine and turbine control models for system dynamics. IEEE Trans. Power. Syst. vol. PWRS-7, 1992.
[19]Hajagos, L. M. and Berube, G. R. Utility experience with gas turbine testing and modeling. Proceedings of IEEE Power Engineering Society Winter Meeting, Columbus. OH, USA, vol. 2, issue 2, 2001, pp. 671-677.
[21]F.Llewis and V.L.Syrmos. Optimal Control. New Jersy: Prentice hall, Englewood cliffs; 1995.
[22]K. P. Singh Parmar, S. Majhi and D. P. Kothari. Automatic Generation Control of an Interconnected Hydrothermal Power System. IEEE Conf. proceedings. INDICON 2010, Kolkata,India.
[23]K. P. Singh Parmar, S. Majhi and D. P. Kothari. Multi-Area Load Frequency Control in a Power System Using Optimal Output Feedback Method. IEEE Conf. proceedings. PEDES 2010, New Delhi, India.
[24]K. P. Singh Parmar, S. Majhi and D. P. Kothari. Improvement of Dynamic Performance of LFC of the Two Area Power System: an Analysis using MATLAB. International Journal of Computer Applications. Vol 40, No. 10, pp 28-32, February 2012
[25]MathWoks. Inc. MATLAB. Control Toolbox. Version 7.13 (R2011b), MATLAB Software.