© 2018, IRJET | Impact Factor value: 7.211 | ISO 9001:2008 Certified Journal | Page 2572
Comparative Study of Equivalent Static Analysis and Response
spectrum analysis on conventional slab & Flat Slab with or without
shear wall Using STADD. PRO
Yogita Tripathi
1, Asst. Prof Ravi Dwivedi
21
PG Student in structural engineering, Malwa Institute of Science& Technology M.P. India
2
Asst.Professor & Head, Department of Civil engineering, Malwa Institute of Science& Technology M.P. India
---***---Abstract – As we know flat slab building structures aresignificantly more flexible than traditional concrete frame/wall or frame structures, thus becoming more vulnerable to seismic loading. To improve the performance of building having flat slabs under seismic loading, provision of flat slab with shear wall is proposed in the present work. In this paper a commercial building with G+5, G+10 and G+15 floors is considered for the seismic analysis using response spectrum method. The results are compared with equivalent static method. The software used for the analysis is STAAD. Pro V8I SS6. In this work the seismic zone is considered to be Zone III, soil type hard. The results generated from both the method were compared considering the parameters such as base shear, maximum displacement, maximum shear force and bending moment and storey drifts.
Key Words: Response spectrum, equivalent static
analysis, STADD.Pro, Base shear, Flat slab, Shear wall, seismic loading.
1. INTRODUCTION
Earthquake or seismic analysis is a subset of structural analysis which involves the calculation of the response of a structure subjected to earthquake excitation. Various seismic data are necessary to carry out the seismic analysis of the structures .The object of the present work is to compare the behavior of multi-storey buildings having flat slabs and flat slab with shear wall on the performance of these three types of buildings under seismic forces.
1.1 LITERATURE REVIEW
Anuja Walvekar, H.S.Jadhav (2015) Investigated the effect of flat slab building with and without shear wall and the seismic behavior of high rise building with different positions of shear wall. For that, 15 story models were selected and the effect of different locations of shear wall on high rise structure, linear dynamic analysis (response spectrum analysis) using software ETABs was carried out. Seismic parameters like time period, base shear, storey displacement and storey drift are checked out. [6]
Raghavendra Rao, Dr.M Rame Gowda (2015) Carried out the study of characteristic seismic behavior of flat slab buildings. a residential building with G+10 floors is considered for the seismic analysis using response spectrum method. The results are compared with equivalent static
method. The software used for the analysis is ETABS 2015.0.0. Drift and displacement results obtained by ESA are greater than the results obtained by RSA. [10]
R.S.More, V. S. Sawant (2015) gave the guidelines for analysis of flat slab taking into account space crunch, height limitations and other factors, deviations from a regular geometry and regular layout and also behavior and response of flat slabs during earthquake. [9]
1.2 Method of seismic analysis
In the equivalent static method, the lateral force equivalent to the design basis earthquake is applied statically. The equivalent lateral forces at each storey level are applied at the floor level. The base shear (V = VB) is calculated as per Clause 7.5.3 of IS 1893: 2002.
The response spectrum is a plot of the maximum response (maximum displacement, velocity, acceleration or any other quantity of interest) to a specified load function for all possible single degree-of-freedom systems. The abscissa of the spectrum is the natural period (or frequency) of the system and the ordinate is the maximum response. It is also a function of damping. Fig. 3.1 shows the design response spectrum given in IS 1893: 2002 for a 5% damped system. According to IS 1893: 2002, high rise and irregular buildings must be analyzed by the response spectrum method.
1.3 Objectives of the Present Work
i. To perform static and dynamic analysis of multi-storeyed RCC buildings in conventional slab, flat slab with shear wall& without shear wall (G+5, G+10, G+15 Storey) using Response Spectrum Analysis and Equivalent Static Analysis, considering earthquake Zones(III) as per the Indian Standard code of practice IS 1893-2002 part-I: Criteria for Earthquake resistant structure (Zone III).
© 2018, IRJET | Impact Factor value: 7.211 | ISO 9001:2008 Certified Journal | Page 2573
1.4 Model Description
A building plan was taken in seismic zone III for seismic analysis of the building with conventional slab, flat slab and shear wall. Building details are given below.
Table-1: Building details
Particulars Details
Plan Size 43.840 m x 19.500m Number of Floors G+5, G+10, G+15 Building Type COMMERCIAL
Storey Height 19.50m,37m,54.5m Soil Type Hard Soil (Type III) Steel Grade Fe 415 Concrete Grade M 25 Seismic Zone III Response Reduction Factor 3
Importance Factor 1
Exterior Column Size 400mm x6500 mm Interior Column Size 400mm x 500mm Beam Size 300mm x 450 mm Slab Thickness 150 mm
Slab Thickness 150 mm Shear Wall thickness 230 mm Live Load on floor 2 KN/m2
Live Load on terrace 1.5 KN/m2
Terrace finish 1KN/m2
Floor Finish 1KN/m2
Fig. 1 Plan for building
Table -2: Details of Models
Model Number Slab
Model 1 G+5 CS
Model 2 G+10 CS Model 3 G+15 CS
Model 4 G+5 FS
Model 5 G+10 FS Model 6 G+15 FS
Model 7 G+5 FS WITH SW Model 8 G+10 FSWITH SW Model 9 G+15 FS WITH SW
2. RESULTS AND DESCUSSION
The results obtained from the STAAD Pro. analysis of G+5, G+10 & G+15 model for ESA and RSA methods are tabulated and discussed for the parameters such as base shear, maximum storey drift, displacement, shear force and bending moment. The comparison between ESA and RSA methods are shown and reported.
2.1 Base shear
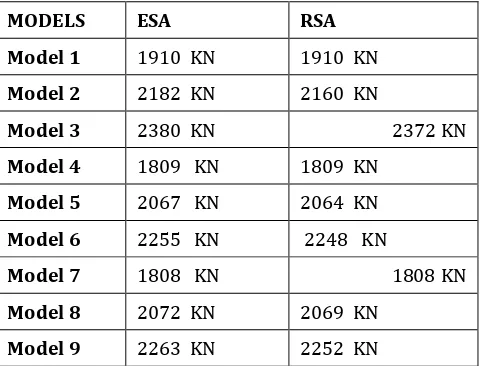
[image:2.595.315.555.509.692.2]Base shear is the maximum expected lateral force that will occur due to seismic ground acceleration at the base of the structure. The base shear, or earthquake force, is given by the symbol “VB”.
Table -3: Base shear for ESA and RSA method
MODELS ESA RSA
Model 1 1910 KN 1910 KN
Model 2 2182 KN 2160 KN
Model 3 2380 KN 2372 KN
Model 4 1809 KN 1809 KN
Model 5 2067 KN 2064 KN
Model 6 2255 KN 2248 KN
Model 7 1808 KN 1808 KN
Model 8 2072 KN 2069 KN
© 2018, IRJET | Impact Factor value: 7.211 | ISO 9001:2008 Certified Journal | Page 2574
0
500
1000
1500
2000
2500
M
o
d
e
l
1
M
o
d
e
l
2
M
o
d
e
l
3
M
o
d
e
l
4
M
o
d
e
l
5
M
o
d
e
l
6
M
o
d
e
l
7
M
o
d
e
l
8
M
o
d
e
l
9
ESA
RSA
Chart -1: Base shear for ESA and RSA method Base shear value for different slab condition (CS, FS, FSSW) in G+5, G+10 and G+15 are 0% to 1% less respectively, in RSA than ESA.
2.2 Story drift
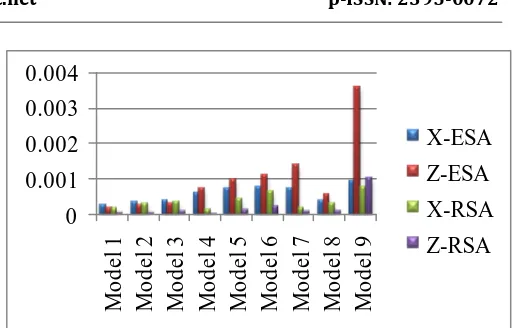
[image:3.595.309.567.60.224.2]Storey drift is the drift of one level of a multistory building relative to the level below. Inter-storey drift is the difference between the roof and floor displacements of any given story as the building sways during the earthquake, normalized by the story height. The factor is defined as the ratio of the story shear force when story collapse occurs to the story shear force when total collapse occurs. Through a series of dynamic analyses, simple equations are provisionally proposed to calculate the necessary story shear safety factor that can be used to prevent story collapse.
Table -4: Story drift for ESA and RSA method
MODELS ESA RSA
X(m) Z(m) X(m) Z(m)
Models -
1 0.00028 0.00020 0.00019 0.00005 Models -
2 0.00034 0.00026 0.00030 0.00005
Models -
3 0.00039 0.00032 0.00036 0.00010 Models -
4 0.00062 0.00072 0.00015 0.00004 Models -
5 0.00072 0.00098 0.00044 0.00013
Models-6 0.00076 0.00110 0.00064 0.00024
Models-7 0.00075 0.00140 0.00021 0.00009
Models-8 0.00040 0.00058 0.00032 0.00011
Models-9 0.00095 0.00357 0.00077 0.00101
0
0.001
0.002
0.003
0.004
M
o
d
e
l
1
M
o
d
e
l
2
M
o
d
e
l
3
M
o
d
e
l
4
M
o
d
e
l
5
M
o
d
e
l
6
M
o
d
e
l
7
M
o
d
e
l
8
M
o
d
e
l
9
X-ESA
Z-ESA
X-RSA
Z-RSA
Chart -2: Story drift for ESA and RSA method Storey drift value along x axis for G+5 with different slab condition (CS, FS, FSSW) are 32%, 76%& 72% less respectively, in RSA than ESA.
Storey drift value along z axis for G+5 with different slab condition (CS, FS, FSSW) are 75%, 81%& 69% less respectively, in RSA than ESA.
Storey drift value along x axis for G+10 with different slab condition (CS, FS, FSSW) are 76%, 39%& 16% less respectively, in RSA than ESA.
Storey drift value along z axis for G+10 with different slab condition (CS, FS, FSSW) are 94%, 87%& 78% less respectively, in RSA than ESA.
Storey drift value along x axis for G+15 with different slab condition (CS, FS, FSSW) are 72%, 20%& 19% less respectively, in RSA than ESA..
Storey drift value along z axis for G+15 with different slab condition (CS, FS, FSSW) are 94%, 81%& 72% less respectively, in RSA than ESA.
2.3 Shear force
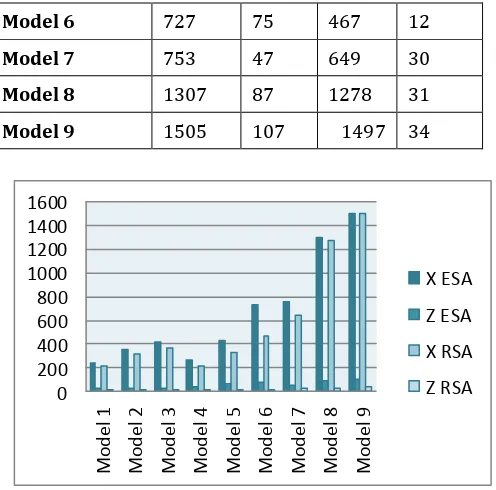
[image:3.595.36.554.451.803.2]Shearing forces are unaligned forces pushing one part of a body in one specific direction, and another part of the body in the opposite direction. When the forces are aligned into each other, they are called compression forces.
Table -5: Shear force for ESA and RSA method
MODELS ESA RSA
X(KN) Z(KN) X(KN) Z(KN)
Model 1 240 22 210 9
Model 2 349 26 318 10
Model 3 416 30 370 11
Model 4 265 36 214 16
© 2018, IRJET | Impact Factor value: 7.211 | ISO 9001:2008 Certified Journal | Page 2575
Model 6 727 75 467 12
Model 7 753 47 649 30
Model 8 1307 87 1278 31
Model 9 1505 107 1497 34
0 200 400 600 800 1000 1200 1400 1600
M
o
d
e
l 1
M
o
d
e
l 2
M
o
d
e
l 3
M
o
d
e
l 4
M
o
d
e
l 5
M
o
d
e
l 6
M
o
d
e
l 7
M
o
d
e
l 8
M
o
d
e
l 9
X ESA
Z ESA
X RSA
Z RSA
Chart -3: max. shear force for ESA and RSA method Shear force value along x axis for G+5 with different slab condition (CS, FS, FSSW) are 13%, 19%& 14% less respectively, in RSA than ESA.
Shear force value along z axis for G+5 with different slab condition (CS, FS, FSSW) are 59%, 56%& 36% less respectively, in RSA than ESA.
Shear force value along x axis for G+10 with different slab condition (CS, FS, FSSW) are 9%, 25%& 2% less respectively, in RSA than ESA.
Shear force value along z axis for G+10 with different slab condition (CS, FS, FSSW) are 62%, 76%& 64% less respectively, in RSA than ESA.
Shear force value along x axis for G+15 with different slab condition (CS, FS, FSSW) are 11%, 36%& 1% less respectively, in RSA than ESA.
Shear force value along z axis for G+15 with different slab condition (CS, FS, FSSW) are 63%, 84%& 68% less respectively, in RSA than ESA.
2.4 Bending moment
[image:4.595.35.283.80.325.2]Bending Moment is the torque that keeps a beam together. It is found by cutting the beam, then calculating the MOMENT needed to hold the left (or right) half of the beam stationary. If this is done for the other (left) side you should get the same answer - but opposite direction.
Table -6: Bending moment for ESA and RSA method
MODELS
ESA RSA
X
(KN-m) Z (KN-m) X (KN-m) Z( KN-m)
Model 1 4 54 3 52
Model 2 5 65 4 62
Model 3 5 71 4 69
Model 4 14 70 12 66
Model 5 10 113 9 94
Model 6 7 152 6 107
Model 7 14 40 9 28
Model 8 12 79 11 65
Model 9 11 129 10 100
0 50 100 150 200
X ESA
Z ESA
X RSA
Z RSA
Chart -4: max. Bending moment for ESA and RSA method Bending moment value along x axis for G+5 with different slab condition (CS, FS, FSSW) are 25%, 14%&36% less respectively, in RSA than ESA.
Bending moment Shear force value along z axis for G+5 with different slab condition (CS, FS, FSSW) are 4%, 6%& 30% less respectively, in RSA than ESA.
Bending moment value along x axis for G+10 with different slab condition (CS, FS, FSSW) are 20%, 10%& 8% less respectively, in RSA than ESA.
Bending moment value along z axis for G+10 with different slab condition (CS, FS, FSSW) are 5%, 17%& 18% less respectively, in RSA than ESA.
Bending moment value along x axis for G+15 with different slab condition (CS, FS, FSSW) are 20%, 36%& 1% less respectively, in RSA than ESA.
© 2018, IRJET | Impact Factor value: 7.211 | ISO 9001:2008 Certified Journal | Page 2576
2.5 Storey Displacement
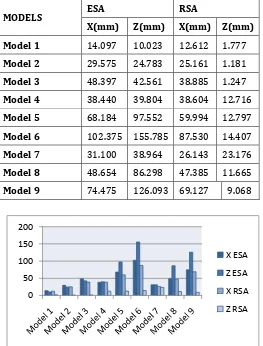
[image:5.595.33.296.159.505.2]Storey displacement is displacement with respect to base of the structure.
Table -7: Story displacement for ESA and RSA method
MODELS ESA RSA
X(mm) Z(mm) X(mm) Z(mm) Model 1 14.097 10.023 12.612 1.777
Model 2 29.575 24.783 25.161 1.181
Model 3 48.397 42.561 38.885 1.247
Model 4 38.440 39.804 38.604 12.716
Model 5 68.184 97.552 59.994 12.797
Model 6 102.375 155.785 87.530 14.407
Model 7 31.100 38.964 26.143 23.176
Model 8 48.654 86.298 47.385 11.665
Model 9 74.475 126.093 69.127 9.068
0 50 100 150 200
X ESA
Z ESA
X RSA
Z RSA
Chart -5: max. Displacement for ESA and RSA method Storey displacement value along x axis for G+5 with different slab condition (CS, FS, FSSW) are 11%, 1%& 16% less respectively, in RSA than ESA.
Storey displacement value along z axis for G+5 with different slab condition (CS, FS, FSSW) are 82%, 68%&41% less respectively, in RSA than ESA.
Storey displacement value along x axis for G+10 with different slab condition (CS, FS, FSSW) are 15%,12%&3% less respectively, in RSA than ESA. Storey displacement value along z axis for G+10 with different slab condition (CS, FS, FSSW) are 95%, 87%& 86% less respectively, in RSA than ESA.
Storey displacement value along x axis for G+15 with different slab condition (CS, FS, FSSW) are 20%, 15%& 7% less respectively, in RSA than ESA.
Storey displacement value along z axis for G+15 with different slab condition (CS, FS, FSSW) are 97%, 91%& 90% less respectively, in RSA than ESA.
(NOTE):
ESA = Equivalent Static Analysis RSA = Response Spectrum Analysis CS = Conventional slab
FS = Flat slab
FSSW=Flat slab with shear wall 3. CONCLUSIONS
From the results obtained as above, the following conclusions are drawn:
1. The seismic analysis of reinforced concrete frame structure is done by both static and dynamic analysis to determine and compare the base shear, it has been found that the difference between varies from 0-1%.
2. In buildings with flat slab, storey drift is significantly more as compared to CS slab buildings and approximately same as FS with shear wall which leads to the development of additional moment caused by drift which is also considered this while designing the columns. 3. The values of storey drift for all the stories are
found to be within the permissible limit i.e. not more than 0.004 times to storey height according to IS 1893 : 2002 (Part I) .
4. Building saving flat slab with shear wall experience maximum force and bending moment as compared to respective buildings with only flat slab and conventional slab. 5. Compared to the building with flat slab,
maximum displacement of CS and FS are less than that in the shear wall slab building. 6. Dynamic analysis gives lesser values for all
parameters than static analysis. Hence, dynamic analysis is economical.
7. Drift and displacement results obtained by ESA are greater than the results obtained by RSA 8. From the analysis results for both ESA and RSA
the storey displacement and storey drift is more along the shorter span i.e., in X-direction. 9. Base shear of conventional R.C.C building is
© 2018, IRJET | Impact Factor value: 7.211 | ISO 9001:2008 Certified Journal | Page 2577
ACKNOWLEDGEMENT
I would like to thank Mr. Ravi Dwivedi, Head of Civil Engineering Department for providing me direct and indirect help in completion of my research work.
My special thanks go to my husband Mr. Ashish Dwivedi for constantly boosting me for the completion of the research work.
REFERENCES
1. Vishesh P. Thakkar Anuj K. Chandiwala Unnati D. Bhagat “Comparative Study of Seismic Behavior of Flat Slab and Conventional RC Framed Structure” International Journal of Engineering Research & Technology (IJERT) http://www.ijert.org. ISSN: 2278-0181 IJERTV 6IS040739, Vol. 6 Issue 04, April-2017 PP. 923-929.
2. Athira M. V 1, Sruthi K Chandran “Significance of shear wall in flat slab multi storied building” International Research Journal of Engineering and Technology (IRJET) e-ISSN: 2395 -0056 Volume: 04 Issue: 02 | Feb -2017 www.irjet.net p-ISSN: 2395-0072 © 2017, IRJET | Impact Factor value: 5.181 | ISO 9001:2008 Certified Journal | Page 1159
3. Mohammed Fatir, M.H.Kolhar, Anjum Algur
“Relative study of seismic analysis between flat slaband grid slab of rcstructures with different masonry infills in two different zones”IJRET: International Journal of Research in Engineering and Technology eISSN: 2319-1163 , pISSN:2321-7308,Volume:05 Issue: 07Jul-2016, Available @ http://ijret.esatjournals.org, PP.324-332
4. SHAIK TAHASEEN “shear wall design for g+8 floors residential building” International Journal of Engineering Research-Online A Peer Reviewed International Journal Articles available online http://www.ijoer.in, Vol.3., Issue.6., 2015 (Nov.-Dec.,)ISSN: 2321-7758 ,PP. 37-43
5. Salman I. Khan and Ashok R. Mundhada “Comparative study of Seismic Performance of multistoried R.C.C buildings with Flat slab & Grid slab” International Journal of Current Engineering and Technology E-ISSN 2277 – 4106, P-ISSN 2347 – 5161 Vol.5, No.3 (June 2015) , PP. 1666-1672. 6. Anuja Walvekar1, H.S.Jadhav “parametric study of
flat slab building with and without shear wall to seismic performance” IJRET: International Journal of Research in Engineering and Technology eISSN: 2319-1163 | pISSN: 2321-7308 Volume: 04 Issue: 04|Apr-2015, Available @ http://www.ijret.org,PP. 601-607
7. Pradip S. Lande, Aniket B. Raut “Seismic Behavior of Flat Slab Systems” Journal of Civil Engineering and Environmental Technology .Print ISSN: 2349-8404; Online ISSN: 2349-879X; Volume 2, Number 10; April-June, 2015 pp. 7-10