Automatic Brain Tumor Detection and Isolation
of Tumor Cells from MRI Images
Dipak Kumar Kole
Dept. of Computer Science & Engineering St. Thomas’ College of Engg. & Technology
Amiya Halder
Dept. of Computer Science & Engineering St. Thomas’ College of Engg. & Technology
ABSTRACT
Automatic Brain Tumor Detection refers to the problem of delineating tumorous tissues from MRI images for the purpose of medical diagnosis and surgical planning. The process uses tumor characteristics in images, such as sizes, shapes, locations and intensities for the isolation of the tumor which depends on manual tracing by experts. This paper proposes automatic brain tumor detection and isolation of tumor cells from MRI images using a genetic algorithm (GA) based clustering method, intensity based asymmetric map and region growing technique.
Keywords
Clustering, Image Segmentation, Genetic Algorithm, Asymmetric Map.
1.
INTRODUCTION
Segmentation of medical images is challenging due to poor image contrast and artifacts that result in missing or diffused organ/tissue boundaries [1]. Consequently, this task involves incorporating as much prior information as possible (e.g., texture, shape, and spatial location of organs). Magnetic Resonance Imaging (MRI) has become a widely-used method of high quality medical imaging, especially in brain imaging where MRI's soft tissue contrast and non-invasiveness are clear advantages. An important use of MRI data is tracking the size of brain tumor as it responds for treatment. Therefore, an automatic and reliable method for segmenting tumor would be a useful tool. Currently, there is no method widely accepted in clinical practice for quantization of tumor volumes from MRI images.
Computer-based brain tumor segmentation has remained largely experimental work. Many efforts have exploited MRI's multi-dimensional data capability through multi-spectral analysis. In this domain, artificial neural networks and knowledge-based techniques have been explored to make more intelligent classification and segmentation decisions. Clustering is used to classify the pixels, where fuzzy rules are applied to make initial classification decisions. More explicit knowledge has been used in the form of frames or tissue models.
Identifying specific organs or other features in medical images requires a considerable amount of expertise concerning the shape and location of anatomical features. Such segmentation is typically performed manually by expert physicians as part of treatment planning and diagnosis. Due to the increasing amount of available data and the complexity of features of interest, it is becoming essential to develop automated segmentation methods to assist and speed-up image-understanding tasks.
Medical imaging is performed in various modalities, such as magnetic resonance imaging (MRI), computed tomography (CT), ultrasound, etc. Several automated methods have been developed to process the acquired images and identify features of interest, including intensity-based methods, region-growing methods and deformable contour models [2]. Intensity-based methods identify local features such as edges and texture in order to extract regions of interest.
Region-growing methods start from a seed-point (usually placed manually) on the image and perform the segmentation task by clustering neighborhood pixels using a similarity criterion [2].
Such methods are typically based on only one image feature, such as texture, shape, pixel intensity, etc. However, due to the low contrast information in medical images, an effective segmentation often requires extraction of a combination of features such as shape and texture or pixel intensity and shape.
This paper proposes a simple Automatic Segmentation method which separates brain tumors from healthy tissues in an MRI image to aid in the task of tracking tumor size over time. An initial segmentation is computed using a Genetic Algorithm based segmentation technique [3,4]. Then, the integrated domain knowledge (intensity and symmetry properties of tumorous and normal tissues) and region-based image segmentation techniques are used for refining the result to obtain the final tumor segmentation. Various segmentation techniques have been developed for medical image segmentation [5-9].
The rest of this paper is organized as follows: In Section 2, the overview of the proposed method is provided. Section 3 gives the concepts of Genetic algorithm and section 4 describes GA based Dynamic Clustering approach. Section 5 describes the validity index. Section 6 describes the proposed algorithm and the experimental result is presented in section 7 and section 8 concludes the paper.
2.
OVERVIEW OF THE PROPOSED
METHOD
2.1
Automatic Brain Tumor Segmentation
In an MR image the normal intracranial tissues of interest are CSF and parenchymal tissue, white matter and the gray matter. In order to roughly delineate these tissues from the tumor, an initial segmentation is performed. A Genetic Algorithm based clustering technique is used for this approach which is discussed in section 4.
2.2
Retaining Cluster with Highest Average
Intensity Value
This phase uses intensity based properties of the tumor pixels to identify and trace out the cluster to which the tumor belongs. From a number of MR images, it can be easily verified that the presence of tumor in a cluster increases the average intensity value of the pixels in the cluster.
Thus the cluster with the highest average pixel value is assumed to contain the tumor and is retained for further examination and processing.
2.3
Locating Seed by Examining the
Asymmetry Map
A remarkable characteristic of normal brain MR images is the symmetry of the two cerebral hemispheres. The brain image with tumor will turn asymmetric because tumor usually occurs in one cerebral hemisphere and holds the normal structure’s place.
The simplest way to detect asymmetry is to subtract one hemisphere from the other pixel by pixel. However, to accommodate slight variances a small neighborhood of a pixel is examined for asymmetry.
In this proposed technique, the cluster obtained from the previous phase is examined for asymmetry, pixel by pixel. The first pixel to show a variance beyond the permissible limit (threshold) is chosen as the seed for the subsequent region growing phase.
2.4
Extracting Tumor Pixels by Region
Growing Method
The seed point is automatically generated by examining the asymmetric map. That seed point is used in region growing algorithm to identify the tumor pixels. The rest of pixels are labeled as being non-tumor.
Application of the Region Growing approach eliminates the chances of symmetric tumor pixels being discarded, as would have been the case if the technique depended solely on symmetry based feature to delineate tumor pixels.
It is a procedure that groups pixels or sub regions into larger regions based on predefined criteria. It starts with a set of seed points and from these, grows regions by appending to each seed those neighboring pixels that have properties similar to the seed.
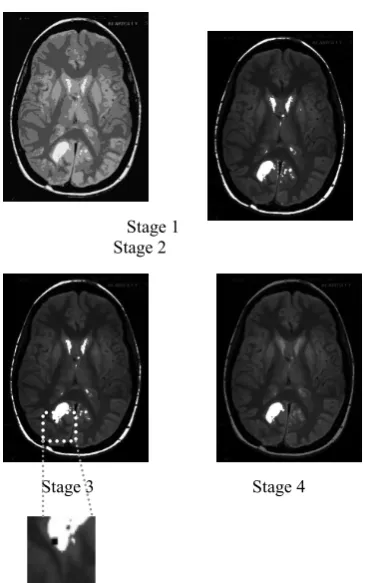
Stage 1 Stage 2
Stage 3 Stage 4 Input Image
GA based dynamic clustering algorithm
Segmentation
Locating seed by examining the Asymmetry Map
Extracting tumor pixels by Region Growing method
Retaining cluster with highest average intensity value
[image:2.595.366.501.68.395.2]Output image
Figure 1: Overview of the Automatic Brain Tumor Segmentation Technique
[image:2.595.331.514.445.737.2]3.
GENETIC ALGORITHM
Genetic Algorithm (GA) is a population-based stochastic search procedure to find exact or approximate solutions to optimization and search problems. Modeled on the mechanisms of evolution and natural genetics, genetic algorithms provide an alternative to traditional optimization techniques by using directed random searches to locate optimal solutions in multimodal landscapes [10-14]. Each chromosome in the population is a potential solution to the problem. Genetic Algorithm creates a sequence of populations for each successive generation by using a selection mechanism and uses operators such as crossover and mutation as principal search mechanisms - the aim of the algorithm being to optimize a given objective or fitness function.
An encoding mechanism maps each potential solution to a chromosome. An objective function or fitness function is used to evaluate the ability of each chromosome to provide a satisfactory solution to the problem. The selection procedure, modeled on nature’s survival-of-the-fittest mechanism, ensure that the fitter chromosomes have a greater number of offspring in the subsequent generations.
For crossover, two chromosomes are randomly chosen from the population. Assuming the length of the chromosome to be l, this process randomly chooses a point between 1 and l-1 and swaps the content of the two chromosomes beyond the crossover point to obtain the offspring. A crossover between a pair of chromosomes is affected only if they satisfy the crossover probability.
Mutation is the second operator, after crossover, which is used for randomizing the search. Mutation involves altering the content of the chromosomes at a randomly selected position in the chromosome, after determining if the chromosome satisfies the mutation probability. In order to terminate the execution of GA we specify a stopping criterion. Specifying the number of iterations of the generational cycle is one common technique of achieving this end.
4.
GA BASED DYNAMIC CLUSTERING
The searching capability of GAs can be used for the purpose of appropriately clustering a set of n unlabeled points in N-dimension into K clusters [11]. In our proposed scheme, the same idea can be applied on image data. We consider a gray level image of size m×n. The basic steps of the GA-clustering algorithm for clustering image data are as follows:
4.1
Encoding
Each chromosome represents a solution which is a sequence of K cluster centers. For an N-dimensional space, each cluster center is mapped to N consecutive genes in the chromosome. For image datasets each gene is an integer representing an intensity value.
4.2
Population initialization
Each of the P chromosomes is initialized to K randomly chosen points from the dataset. Here P is the population size.
4.3
Fitness computation
The fitness computation is accomplished in two steps.
First, the pixel dataset is clustered according to the centers encoded in the chromosome under consideration, such that each intensity value xi, i = 1, 2, ..., m×n is assigned to cluster with center zj, j = 1, 2, ..., K,
,
,
,..
2
,
1
)
1
(
||,
||
||
||
j
p
and
K
p
where
z
x
z
x
if
i j i p≠
=
−
−
−
−
−
−
−
−
−
−
−
<
−
The next step involves adjusting the values of the cluster centers encoded in the chromosome, replacing them by the mean points of the respective clusters. The new center Zi* for the cluster Ci is gives by
)
2
(
,..
2
,
1
,
1
*=
=
−
−
−
−
−
−
−
−
−
−
∑
∈K
i
x
n
z
j j C x j i iSubsequently, the clustering metric M is computed as the sum of Euclidean distances of each point from their respective cluster centers given by
)
3
(
1−
−
−
−
−
−
−
−
−
−
−
−
−
−
−
−
−
=
∑
= K i iM
M
)
4
(
||
||
−
−
−
−
−
−
−
−
−
−
−
−
−
−
=
∑
∈ i C x ji
x
z
M
i j
The fitness function is defined as
f = 1/M. (5)
A low value of intra-cluster spread is a characteristic of efficient clustering. Hence our objective is to minimize the clustering metric M i.e. maximize f.
4.4
Selection
This paper employs the Roulette Wheel selection - a proportional selection mechanism in which the number of copies of a chromosome, that go into the mating pool for subsequent operations, is proportional to its fitness.
4.5
Crossover
In this paper we use single-point crossover with a fixed crossover probability of µc.
4.6
Mutation
Each chromosome undergoes mutation with a fixed probability µm. A number δ in the range [0, 1] is generated
with uniform distribution. If the value at a gene position is v, after mutation it becomes
v ± δ * v, v ≠ 0
v ± δ , v = 0. (6)
4.7
Termination criterion
We execute the processes of fitness computation, selection, crossover, and mutation for a predetermined number of iterations. In every generational cycle, the fittest chromosome till the last generation is preserved - elitism. Thus on termination, this chromosome gives us the best solution encountered during the search.
4.8
Algorithm
We propose the new segmentation algorithm that can produce a new result according to the values of the clustering. An image f of size m×n and L gray levels can be considered. The proposed algorithm is:
1. Repeat steps 2 to 8 for K=2 to K=Kmax.
3. Compute the fitness function fi for i=1,…,P, using equation (5).
4. Preserve the best (fittest) chromosome seen till that generation.
5. Apply Roulette Wheel selection on the population.
6. Apply crossover and mutation on the selected population according to sections 4.5 and 4.6 respectively.
7. Repeat steps 3 to 6 till termination condition is reached.
Compute the clustering Validity Index for the fittest chromosome for the particular value of K, using equation (7), in order to determine the validity of the clustering on the given dataset [15,16].
Cluster the dataset using the most appropriate number of clusters determined by comparing the Validity Indices of the proposed clusters for K=2 to K=Kmax.
5.
VALIDITY INDEX
The cluster validity measure used in the paper is the one proposed by Turi [16]. It aims at minimizing the validity index given by the function,
=
×
−
−
−
−
−
−
−
−
−
−
−
−
−
−
−
−
(
7
)
inter
intra
y
V
The term intra is the average of all the distances between each data point and its cluster centroid which is defined as
|| ||2 (8
)
1 1
− − − − − − − − − − ∑ ∈ ∑ =
= x zi i
C x K
i N intra
This term is used to measure the compactness of the clusters. The inter term is the minimum distances between the cluster centroids which is defined as
. ,.., 1 ,
1 ,... 2 , 1
) 9 ( ),
2 || min(||
K i j K i
where
j z i z inter
+ = − =
− − − − − − − − − −
=
This term is used to measure the separation of the clusters.
y =c×N(2,1)+1−−−−−−−−−−−−−−(10
)
Here, c is a user specified parameter and N(2,1) is a Gaussian Distribution with mean 2 and standard deviation of 1. This validity measure serves the dual purpose of
• minimizing the intra-cluster spread, and
• maximizing the inter-cluster distance.
Moreover it overcomes the tendency to select a smaller number of clusters (2 or 3) as optimal, which is an inherent limitation of other validity measures such as the Davies-Bouldin index or Dunne’s index.
6.
PROPOSED ALGORITHM
Algorithm:
1. Cluster the MRI data using the GA based Dynamic clustering technique as discussed in section 4.
2. Extract the cluster C* with the maximum average intensity value.
3. Assign a user-defined intensity value c (preferably the maximum available intensity value) to every point in the cluster C*.
4. For each pixel (i,j) in C*
a. Calculate the Asymmetry Map S based on the original MRI image I:
) 11 ( ) , ( ) , ( ) , ( ) , ( min )
,
( − −−
∈
= Ii j Ikl j
i N l k j i S
and (i’,j’) is the symmetric pixel of (i,j); N(i’,j’) is a small neighborhood of pixel (i’,j’), defined by equation (12); δ is the radius of N, which is a small value selected empirically.
{
(,) |(,),(', ')}
(12) )' , '
(i j = kl kl i j ≤δ−−−
N
b. If S(i,j) > 0 choose (i,j) as the seed for the subsequent Region-Growing process.
5. Initialize a region R to the seed value.
6. A pixel (i,j) in C* belongs to R if
a) (i,j) has an intensity value c.
b) (i,j) is 8-connected to at least one pixel in R.
7. The region R thus extracted represents the tumorous tissue in the MRI scan.
7.
EXPERIMENTAL RESULTS
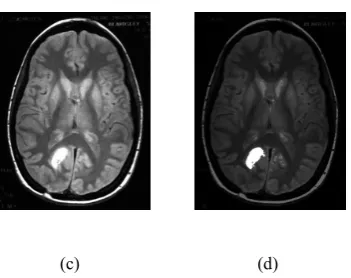
We have applied the method to many datasets, representing different tumor shapes, location, sizes, image intensity, as shown in Figure 2. The assumptions used for the implementation of the proposed algorithm are given as follows. The value of the parameter, c, for the validity index referred to from [16], is set to 25. The size of the population, P, is taken as 30, crossover rate, µc, as 0.9 and mutation rate, µm, as 0.01 [14]. The algorithm uses number of iterations as the terminating condition and it is set to 20. The value of Kmax
is empirically set for the individual images.
(c) (d)
8.
CONCLUSIONS
Automated MRI (Magnetic Resonance Imaging) brain tumor segmentation is a difficult task due to the variance and complexity of tumors. However it proves exceedingly useful for tumor diagnosis from MR images. This paper proposes a very simple technique for the isolation of tumorous cells from MRI images based on intensity-based and symmetry-based features of both tumorous and healthy tissue.
The algorithm can be extended to include means to determine the accuracy and efficiency of the process by evaluating its results against those of ground truth images (manual delineation by experts).
A prominent feature of MRI brain images is the fact that the texture patterns of the various tissues are fixed. Texture descriptors can be used to capture the salient features of the texture pattern in order to distinguish one type of tissue from another. Thus it can help refine the tumorous region already outlined by the existing process.
To further increase the efficiency of the existing algorithm, classification techniques such as AdaBoost can be used to select the most discriminative features to help classify the structural elements into normal and abnormal tissue.
9.
REFERENCES
[1] J. C. Bezdek, L. O. Hall and L. P. Clarke, Review of MR Image Segmentation Techniques Using Pattern Recognition, April 1993.
[2] Rafael C. Gonzalez, Richard E. Woods, Digital Image Processing, Pearson Education, 2002.
[3] Dipak Kumar Kole and Amiya Halder, An efficient dynamic Image Segmentation algorithm using Dynamik
GA based clustering, International Journal of Logistics and Supply Chain Management, 2(1), pp. 17-20, 2010.
[4] Amiya Halder, Soumajit Pramanik and Arindam Kar, Dynamic Image Segmentation using Fuzzy C- means based Genetic Algorithm, International Journal of Computer Application, Vol. 28, No.6,pp.15-20, August 2011.
[5] S. Murugavalli and V. Rajamani, An Improved Implementation of Brain Tumor Detection Using Segmentation Based on Neuro Fuzzy Technique, Journal of Computer Science 3(11), 2007.
[6] Payel Ghosh and Melanie Mitchell, Segmentation of Medical Images Using a Genetic Algorithm.
[7] Xiao Xuan and Quingmin Liao, Statistical Structure Analysis in MRI Brain Tumor Segmentation, Fourth International Conference on Image and Graphics.
[8] Matthew C. Clark, Lawrence O. Hall, Dmitry B. Goldgof, Robert Velthuizen, F. Reed Murtaugh and Martin S. Silbiger, Unsupervised Brain Tumor Segmentation Using Knowledge-based and Fuzzy Techniques.
[9] Lynn M. Fletcher-Heath, Lawrence O. Hall, Dmitry B. Goldgof and F. Reed Murtaugh, Automatic Segmentation of Non-Enhancing Brain Tumors in Magnetic Resonance Images.
[10]D. E. Goldberg, Genetic Algorithms in Search, Optimization and Machine Learning, Addison-Wesley, 1989.
[11]Ujjwal Maulik, Sanghamitra Bandyopadhyay, Genetic algorithm-based clustering technique, Elsevier Science Ltd., 1999.
[12]Qin Ding and Jim Gasvoda, A Genetic Algorithm for Clustering on Image Data, in International Journal of Computational Intelligence Vol-1 No-1, 2004.
[13]Hwei-Jen Lin, Fu-Wen Yang and Yang-Ta Kao, An Efficient GA-based Clustering Technique, in Tamkang Journal of Science and Engineering Vol-8 No-2, 2005.
[14]M. Srinivas, Lalit M. Patnaik, Genetic Algorithms: A Survey.
[15]M. Halkidi, Y. Batistakis and M. Vazirgiannis, On Clustering Validation Techniques, Intelligent Information Systems Journal, Kluwer Publishers, vol. 17(2-3), 107-145, 2001.
[16]R. H. Turi, Clustering-Based Color Image Segmentation, PhD Thesis, Monash University, Australia, 2001.
[image:5.595.60.236.77.216.2]