http://dx.doi.org/10.4236/abb.2014.511103
Electrocardiogram Feature Extraction
and Pattern Recognition Using a Novel
Windowing Algorithm
Muhammad Umer, Bilal Ahmed Bhatti, Muhammad Hammad Tariq, Muhammad Zia-ul-Hassan, Muhammad Yaqub Khan, Tahir Zaidi Center for Advanced Research in Engineering (CARE), Islamabad, Pakistan Email: [email protected], [email protected]
Received 23 August 2014; revised 24 September 2014; accepted 10 October 2014
Copyright © 2014 by authors and Scientific Research Publishing Inc.
This work is licensed under the Creative Commons Attribution International License (CC BY). http://creativecommons.org/licenses/by/4.0/
Abstract
This paper presents a Novel Windowing Algorithm for Electrocardiogram Feature Extraction and Pattern Recognition. The work presented here deals with a simple and efficient way of detecting ECG features that are P, Q, R, S and T waves. Windowing method is used to select these waves. Windows are based on varying R-R intervals. It has been tested on ECG simulator data and also on different records of the MIT-BIH arrhythmia database, producing satisfactory results. ECG timing intervals are also required for monitoring the cardiac condition of patients. Hence after feature detections ECG timing intervals like the PR interval, QRS duration, the QT interval, the QT cor-rected interval and Vent Rate are efficiently calculated using proposed Formulae.
Keywords
Electrocardiogram, PLI, Windowing, Arrhythmia, Intervals, Cardiac, PQRST
1. Introduction
An electrocardiogram is a graph depicting the electrical activity generated by the depolarization and
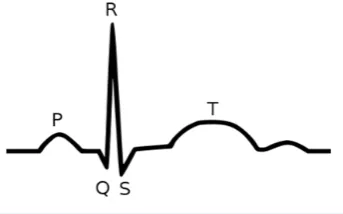
repolariza-tion of atria and ventricles. An ECG wave is a periodic wave with one cycle consisting of a P wave, the QRS
complex and a T wave as shown in Figure 1. ECG signal analysis is vital for making the data useful in the
di-agnosis of heart diseases. Thus the development of efficient ECG feature extraction algorithms is of great value and importance.
Figure 1.Electrocardiogram (ECG) wave features.
as arrhythmias including tachycardia, bradycardia, heart rate variation etc. Beat detection is used to determine the heart rate and identify arrhythmias while further processing is performed to detect abnormal beats. A number of techniques have already been proposed for detection of ECG features. A novel algorithm based on the win-dowing technique is discussed in this paper which is used for high precision ECG feature extraction and pattern recognition.
This paper is organized as follows. The next Section, Section 2, explains the preprocessing required before ECG signal analysis. It also explains the different steps involved in implementing the windowing algorithm. Section 3 deals with the mathematical formulae involved in calculating ECG wave intervals and other parame-ters. Section 4 contains figures illustrating the results of the windowing algorithm. Section 5 concludes the pa-per.
2. Windowing Algorithm
2.1. ECG Preprocessing
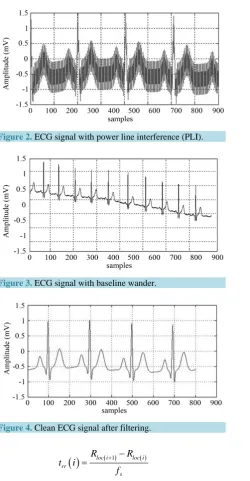
An ECG signal acquired from the body contains interference from a variety of sources. Power Line Interference (PLI) and baseline wandering are two major sources of noise in an ECG signal. Therefore preprocessing is re-quired to obtain a signal that is useful for analysis. Power line interference is 50 - 60 Hz noise superimposed on
the ECG signal as illustrated in Figure 2 and is caused by the AC mains supply. It can be removed by an
algo-rithm proposed in [1] based on adaptive notch filtering.
Baseline wandering is low frequency noise caused by the movement of the patient during signal acquisition as
shown in Figure 3. Other factors contributing to this type of noise may include the loose connection of
elec-trodes, metal contact with the patient’s body and the quality of the electrodes. It is removed by applying a high pass IIR (Infinite Impulse Response) filter of the 2nd order with a cutoff frequency of 0.05 Hz.
Once the effects of interference are removed, the clean ECG signal shown in Figure 4, is passed to the
algo-rithm proposed in this paper. LEAD II is chosen for processing.
2.2. Windowing Algorithm
The windowing algorithm is based on the following:
• The most prominent peaks in an ECG signal are the R-peaks. These peaks are detected by imposing a
thre-shold condition on the amplitude of the signal as shown in Equation (1)
( )
0.4 mτ= × (1)
where τ and m denote the threshold and peak value of the signal respectively. The values lying above τ are
the R-peaks of the ECG.
• R-peaks occur periodically in an ECG signal. The threshold condition will also give different values in each
period containing R-peaks. The particular R-peak in any period is selected by taking the mean of the R values in that period.
• Different periods are selected by finding the difference between consecutive values obtained by the threshold
condition. Values in one period are very close to each other and a sharp variation appears as one period ends. That sharp variation is useful in identifying one particular period.
Figure 2.ECG signal with power line interference (PLI).
[image:3.595.203.425.92.202.2]Figure 3.ECG signal with baseline wander.
Figure 4.Clean ECG signal after filtering.
( )
loc i( )1 loc i( ) rrs
R R
t i
f + −
= (2)
s
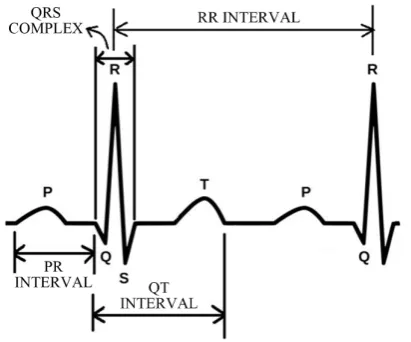
f represents sampling frequency (100 Hz) and trr is used in making windows for the P, Q, S and T waves.
• P and T waves exist in one R-R interval, T waves lie next to the 1stR-peak, and P-waves are present nearer to the 2ndR-peak in one R-R interval.
• The window for the T-wave in one R-R interval is selected by starting from 15% of the R-R interval added to the 1stR-peak location and continuing to 55% of the R-R interval added to the same location.
• The window for the P-wave in one R-R interval is selected by starting from 65% of the R-R interval added to the 1stR-peak location and continuing to 95% of the R-R interval added to the same location.
• The particular P and T peak location is selected by taking the highest value in their respective windows.
• The Q-peak is chosen by selecting minimum value in the window starting from 20 ms before the
corres-ponding R-peak and that particular R-peak.
• Similarly the S-peak is chosen by selecting the lowest value in the window starting from R-peak to 20 ms
3. Equations
ECG timing intervals are calculated as follows.
3.1. PR Interval
P-R interval, denoted by tpr, is calculated using following formula
( )
(
loc i( ) loc i( ))
prs
R P
t i
f
−
= (3)
where fs denotes sampling frequency, Rloc denotes R peak locations and Ploc denotes P peak locations. The above
formula yields an array of tpr values, which are then averaged out to get single tpr.
3.2. QRS duration
QRS duration tqrs is calculated using following formula
( )
(
loc i( ))
(
loc i( ))
qrsS
S x Q x
t i
f
+ − −
= (4)
where x denotes immediate 5 ms, these samples are added to Sloc and are subtracted from Qloc because QRS
du-ration is defined from start of Q peak till end of S peak as shown in Figure 5. Sloc and Qloc denote S and Q peak
locations respectively. This formula gives an array of tqrs, which are then averaged to get single tqrs.
3.3. QT Interval
QT interval tqt is calculated using following formula
( )
loc i( )(
rr i( ) 0.13)
(
loc i( ))
qts
T t Q x
t i
f
+ × − −
= (5)
Tloc indicates T peak locations. 0.13 Factor is multiplied with trr and added to Tloc, it has same effect as
addi-tion of 5 ms. Particular tqt value is selected by taking mean of all values of an array.
3.4. QT Corrected
[image:4.595.213.419.532.703.2]QT interval depends on heart rate. An increase in heart rate results in lower RR and QT intervals [2]. So QT in-terval is corrected to obtain QT corrected interval known as tqt corr( ) by using correction called Bazett’s formula [3]
( )
( )
( ) ( ) qt i qt corrs rr i t
t i
f t
=
× (6)
This correction also improves the detection of patients at increased risk of ventricular arrhythmia.
3.5. Vent Rate
Vent rate or BPM is calculated using Equation (7)
( )
( )
60
s
rr i f BPM i
t
= × (7)
A particular BPM value is selected by taking mean of all values of an array.
4. Results
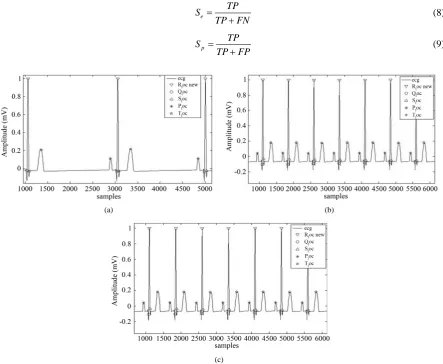
The algorithm has been tested on MATLAB using a large number of normal ECG signals taken from Fluke PS-
410 ECG simulator ranging from 30 BPM to 200 BPM shown in Figure 6. It is also tested on 42 records of
MIT-BIH arrhythmia database. Two parameters―sensitivity and specificity given by Table 1 and Table 2
re-spectively are calculated to evaluate the detection performance. Sensitivity measures the accuracy in detection
while specificity gives an indication of rejection of false detections. The formulas [4] used for calculation of
sensitivity and specificity are given as
e
TP S
TP FN
=
+ (8)
p
TP S
TP FP
=
+ (9)
(a) (b)
(c)
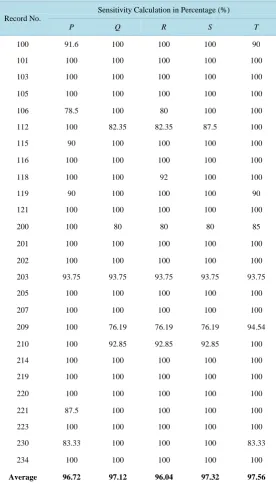
[image:5.595.93.537.337.701.2]Table 1.Sensitivity Calculation of PQRST detection on MIT-BIH arrythmia database.
Record No.
Sensitivity Calculation in Percentage (%)
P Q R S T
100 91.6 100 100 100 90
101 100 100 100 100 100
103 100 100 100 100 100
105 100 100 100 100 100
106 78.5 100 80 100 100
112 100 82.35 82.35 87.5 100
115 90 100 100 100 100
116 100 100 100 100 100
118 100 100 92 100 100
119 90 100 100 100 90
121 100 100 100 100 100
200 100 80 80 80 85
201 100 100 100 100 100
202 100 100 100 100 100
203 93.75 93.75 93.75 93.75 93.75
205 100 100 100 100 100
207 100 100 100 100 100
209 100 76.19 76.19 76.19 94.54
210 100 92.85 92.85 92.85 100
214 100 100 100 100 100
219 100 100 100 100 100
220 100 100 100 100 100
221 87.5 100 100 100 100
223 100 100 100 100 100
230 83.33 100 100 100 83.33
234 100 100 100 100 100
Average 96.72 97.12 96.04 97.32 97.56
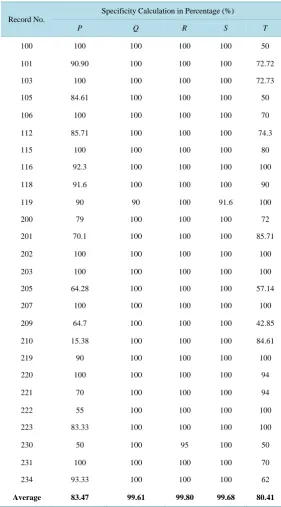
where TP denotes true positive, a condition in which certain peak is present and is detected correctly. FP is false positive, a condition in which a certain feature is present but not detected. FN is false negative, a condition in which a feature was detected but it was not actually present. For normal data 99% accurate results are obtained. For MIT-BIH arrhythmia database 10 seconds long data was used for analysis and a high sensitivity and speci-ficity values are achieved for PQRST detection.
Figure 7 shows results of algorithm on two records from MIT-BIH database 101.dat and 219.dat.
Now comparing results of proposed algorithm with existing techniques, it is observed that algorithms based on Autoregressive (AR), Wavelet Transform (WT), Eigenvector, Fast Fourier Transform (FFT), Linear
Table 2.Specificity Calculation of PQRST detection on MIT-BIH arrythmia database.
Record No.
Specificity Calculation in Percentage (%)
P Q R S T
100 100 100 100 100 50
101 90.90 100 100 100 72.72
103 100 100 100 100 72.73
105 84.61 100 100 100 50
106 100 100 100 100 70
112 85.71 100 100 100 74.3
115 100 100 100 100 80
116 92.3 100 100 100 100
118 91.6 100 100 100 90
119 90 90 100 91.6 100
200 79 100 100 100 72
201 70.1 100 100 100 85.71
202 100 100 100 100 100
203 100 100 100 100 100
205 64.28 100 100 100 57.14
207 100 100 100 100 100
209 64.7 100 100 100 42.85
210 15.38 100 100 100 84.61
219 90 100 100 100 100
220 100 100 100 100 94
221 70 100 100 100 94
222 55 100 100 100 100
223 83.33 100 100 100 100
230 50 100 95 100 50
231 100 100 100 100 70
234 93.33 100 100 100 62
Average 83.47 99.61 99.80 99.68 80.41
Table 3.Sensitivity and specificity percentages of existing algorithms.
Parameter
Existing Approaches
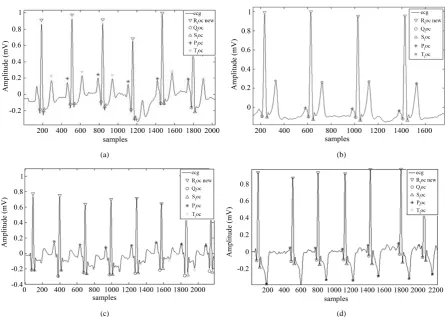
[image:7.595.155.437.110.618.2](a) (b)
(c) (d)
Figure 7. (a) Algorithm result on record 101.dat from MIT-BIH Database; (b) Algorithm result on record 201.dat from MIT-BIH Database; (c) Algorithm result on record 100.dat from MIT-BIH Database; (d) Algorithm result on record 219.dat from MIT-BIH Database.
specificity values for all these existing algorithms. Comparison of sensitivity and specificity values shows that
proposed windowing algorithm is comparable with Eigenvector method that is regarded as best method [5] and
better than wavelet transform and linear prediction methods. Windowing Algorithm is also easier to implement on application based hardware while existing methods are complex and require large computation time.
It is observed that sensitivity and specificity values for P and T detection are moderate because it is difficult to
detect them as compared to QRS complex features irrespective of the approach or algorithm used. Reliable
de-tection of P and T wave is more difficult than QRS complex detection for several reasons including low
ampli-tudes, low signal-to-noise ratio, amplitude and morphological variability and possible overlapping of the P wave
with the QRS complex [6].
5. Conclusion
A novel windowing algorithm has been proposed for electrocardiogram wave feature detection. Feature extrac-tion and pattern recogniextrac-tion have been achieved on normal ECG data ranging from 30 BPM to 200 BPM with
accuracy of 99%. Same algorithm was tested on patient data from MIT-BIH [7] database and highly accurate
results are obtained. Interval values obtained using this approach are within ±5% of the exact values. Algorithm is tested on about 100 normal ECG records and 42 records of MIT-BIH database.
Acknowledgements
[image:8.595.89.536.82.399.2]References
[1] Razzaq, N., Butt, M., Salman, M., Ali, R., Sadiq, I., Munawar, K. and Zaidi, T. (2013) An Intelligent Adaptive Filter for Fast Tracking and Elimination of Power Line Interference from ECG Signal. 2013 IEEE 26th International Sympo-sium on Computer-Based Medical Systems (CBMS), Porto, 20-22 June 2013, 251-256.
[2] Sagie, A., Larson, M.G., Goldberg, R.J., Bengston, J.R. and Levy, D. (1992) An Improved Method for Adjusting the QT Interval for Heart Rate (the Framingham Heart Study). American Journal of Cardiology, 70, 797-801.
http://dx.doi.org/10.1016/0002-9149(92)90562-D
[3] Bazett, H.C. (1920) An Analysis of the Time-Relations of Electrocardiograms. Heart, 7, 353-370.
[4] Mane, R.S., Cheeran, A.N., Awandekar, V.D. and Rani, P. (2013) Cardiac Arrhythmia Detection by ECG Feature Ex-traction. International Journal of Engineering Research and Applications, 3, 327-332.
[5] Vaneghi, F.M., Oladazimi, M., Shiman, F., Kordi, A., Safari, M.J. and Ibrahim, F. (2012) A Comparative Approach to ECG Feature Extraction Methods. Proceedings of 2012 3rd International Conference on Intelligent Systems, Modelling and Simulation (ISMS), Kota Kinabalu, 8-10 February 2012, 252-256. http://dx.doi.org/10.1109/ISMS.2012.35
[6] Mehta, S.S. and Lingayat, N.S. (2008) Detection of P and T-Waves in Electrocardiogram. Proceedings of the World Congress on Engineering and Computer Science, San Francisco, 22-24 October 2008, 22-24.
[7] Goldberger, A.L., Amaral, L.A.N., Glass, L., Hausdorff, J.M., Ivanov, P.C.H., Mark, R.G., Mietus, J.E., Moody, G.B., Peng, C.-K. and Stanley, H.E. (2000) PhysioBank, PhysioToolkit, and PhysioNet: Components of a New Research Re- source for Complex Physiologic Signals. Circulation, 101, e215-e220.