IJPSR (2018), Volume 9, Issue 7 (Research Article)
Received on 10 October, 2017; received in revised form, 23 December, 2017; accepted, 25 December, 2017; published 01 July, 20 18
DEVELOPMENT AND VALIDATION OF HPLC METHOD FOR DETERMINATION OF CERITINIB IN RABBIT PLASMA USING PDA DETECTOR
M. S. V. Sakuntala * 1, M. William Carey 2 and A. Lakshmana Rao 3
Department of Pharmacy 1, JNTUK, Kakinada - 533003, Andhra Pradesh, India.
Department of Pharmacy 2, Government Polytechnic, Visakhapatnam - 531116, Andhra Pradesh, India. V. V. Institute of Pharmaceutical Sciences 3, Gudlavalleru - 521356, Andhra Pradesh, India.
ABSTRACT: A rapid, sensitive and reproducible HPLC method was
developed and validated for the quantification of Ceritinib in rabbit plasma using PDA detector at wave length 264 nm. The method was developed using Dasatinib as internal standard (IS). Ceritinib is a selective and potent inhibitor of anaplastic lymphoma kinase (ALK) indicated in the treatment of non-small cell lung cancer (NSCLC). The Ceritinib and Dasatinib were separated as symmetrical peaks on an analytical column ODS (250 × 4.6 mm, 5 µm) column using a mixture of 75% phosphate buffer (pH 3.6) and 25% acetonitrile as mobile phase with a flow rate of 1.0 ml/min. The total chromatographic run time is 10.0 min with retention times for Ceritinib and Dasatinib at 7.630 min and 2.771 min respectively, no interferences from the endogenous plasma peaks is observed. The method is validated and linear calibration curves were obtained across a range of 0.002 - 0.2 µg/ml for Ceritinib with a correlation coefficient of 0.999. The coefficients of variation for intra-day and inter-day assays were less than 10%. The intra-batch and inter-batch precision (% CV) across five levels (LLOQ, LQC, MQC, HQC, and ULOQ) is less than 11.15. The method was validated as per the USFDA guidelines and the results were within the acceptance criteria for selectivity, sensitivity, linearity, precision, accuracy, recovery stability of solution and stability of solution in plasma.
INTRODUCTION: Ceritinib Fig. 1 is used for the treatment of adults with anaplastic lymphoma kinase (ALK)-positive metastatic non-small cell lung cancer 1 (NSCLC). Chemically Ceritinib is N-{ [(5-chloro- {[5-methyl-4- (piperidin-4-yl)- 2-(propan- 2- loxy) phenyl] amino} pyrimidin- 4-yl) amino] phenyl} propane- 2- sulfonamide.
QUICK RESPONSE CODE
DOI:
10.13040/IJPSR.0975-8232.9(7).2897-04
Article can be accessed online on: www.ijpsr.com DOI link: http://dx.doi.org/10.13040/IJPSR.0975-8232.9(7).2897-04
[image:1.612.55.570.63.126.2]Ceritinib exerts its therapeutic effect by inhibiting auto-phosphorylation of ALK, ALK-mediated phosphorylation of the downstream signaling protein STAT3, and proliferation of ALK-dependent cancer cells 2.
FIG. 1: STRUCTURE OF CERITINIB Keywords:
Ceritinib, Dasatinib, Rabbit plasma, HPLC Correspondence to Author: M. S. V. Sakuntala
Research Scholar,
School of Pharmaceutical Sciences, JNTUK, Kakinada - 533003 Andhra Pradesh, India.
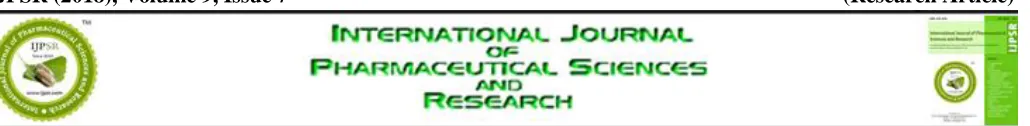
Dasatinib Fig. 2 is a potent multikinase inhibitor targeting BCR-ABL, the SRC family of kinases 3. Chemically Dasatinib is N-(2-chloro-6-methyl-phenyl)- 2- (6-(4-(2-hydroxyethyl)-piperazin-1-yl)-2-methylpyrimidin-4-ylamino)thiazole- 5- carboxa-midemonohydrate. Dasatinib is an effective treatment for chronic myeloid leukemia. Dasatinib acts by binding to the ATP-binding site, binds the inactive and active conformation of the ABL kinase domain, requires fewer contact points with ABL, and has a greater affinity to the ABL kinase 4.
FIG. 2: STRUCTURE OF DASATINIB
Literature survey reveals that few HPLC methods
5-8
have been reported for the determination of Ceritinib in pure and pharmaceutical dosage forms. As per the knowledge of the authors, no HPLC method was reported for the determination of the Ceritinib in rabbit plasma. Hence, we made an attempt to develop a simple, rapid, accurate, sensitive and precise HPLC method for the determination of Ceritinib in rabbit plasma using PDA detector. The developed method has been validated as per the guidelines of ICH and FDA 9, 10.
MATERIALS AND METHODS: The present study describes a rapid and validated HPLC method using an analytical column with PDA detection, which enables the determination of Ceritinib with good accuracy at low drug concentrations in plasma. Separation was performed on a reversed-phase column. The sample preparation involves a simple procedure and no evaporation step is required and requires less time for preparation and quantification.
Chemicals: Ceritinib and Dasatinib were supplied as gift samples from Spectrum Pharma Research Solutions, Hyderabad. HPLC grade acetonitrile, methanol and all other chemicals were obtained from Merck Chemical Division, Mumbai. HPLC grade water was obtained by double distillation and purified additionally with Milli-Q water purification system.
Instruments: Chromatography was performed with waters 2695 HPLC provided with high speed auto sampler, column, oven, degasser and 2996 PDA detector to provide a compact and with class Empower-2 software.
Chromatographic Conditions: The chromato-graphic conditions like column is as ODS (250 × 4.6 mm, 5 µm), by using mobile phase composition as mixture of 75%phosphate buffer (pH 3.6) and 25% acetonitrile and flow rate is 1 ml/min with the injection volume of 10 µl and the run time is 10 min by using detection wavelength 264 nm.
Extraction Procedure: Take 250 µl of plasma and 50 µl of internal standard, 10 µl of Ceritinib into a centrifuging tube and add 2 ml of acetonitrile in cyclomixer for 15 sec. Then vertex for 2 min and finally centrifuge for 3 min at 3200 rpm speed. After the centrifugation collect the organic layer and directly inject 10 µl into HPLC.
Buffer Preparation: (0.1% perchloric acid) 1 ml of perchloric acid was transferred into 1000 ml volumetric flask and make up the volume to produce 1000 ml, pH was adjusted to 4.6 by using triethylamine.
Preparation of Ceritinib Stock Solution (100 mg/ml): Take 1000 mg of Ceritinib in 10 ml volumetric flask and make the volume with diluent (water: acetonitrile, 50: 50% v/v) to produce 1 mg/ml.
Preparation of Ceritinib Spiking Solutions (230 µg/ml to 23000 µg/ml): From the above Ceritinib stock solution 0.023 ml, 0.115 ml, 0.230 ml, 0.460 ml, 0.920 ml, 1.380 ml, 1.840 ml and 2.300 ml was pipette and transferred to 8 individual 10 ml volumetric flasks and make up the volume up to the mark with diluents (water: acetonitrile, 50: 50% v/v) to produce 230 µg/ml, 1150 µg/ml, 2300 µg/ml, 4600 µg/ml, 9200 µg/ml, 13800 µg/ml, 18400 µg/ml and 23000 µg/ml.
ruggedness on precision accuracy and linearity, reinjection reproducibility and stability on day zero, long batch, LT at -28 ºC and LT at -80 ºC. System suitability was done by MQC level sample as six homogenous injections and will see the % RSD values for retention time and response of analyte and internal standard.
Auto sample carryover was done by ULOQ and LLOQ level and check whether drug is remains or not in system. Specificity and screening of biological matrix was done by LLOQ level of sample and check it for any interference of blank and sample response.
Sensitivity was done by LLOQ level sample to know the lowest limit of detection and calculate the % Mean accuracy and % CV. Matrix effect on analyte quantitation with respect to consistency in signal (suppression / enhancement), the matrix effect was checked in six different lots of Ceritinib plasma three replicates, each at LQC and HQC levels were prepared from these lots of plasma (total 36 QC samples) and checked for the accuracy in terms of %bias in all the QC samples.
Linearity of the method was determined by analysis of standard plots associated with an 8-point standard calibration curve. Intra-batch and inter-batch accuracy and precision was evaluated at five different concentrations levels (LLOQ, LQC, MQC and HQC) in six replicates for both the analytes. Mean values were obtained for calculated drug
concentration over these batches. The accuracy and precision was calculated and expressed in terms of % Accuracy and coefficient of variation (% CV), respectively. Recovery of the analytes from the extraction procedure was performed at LQC, MQC and HQC levels.
It was evaluated by comparing peak area of extracted samples (spiked before extraction) to the peak area of unextracted samples (quality control working solutions spiked in extracted plasma). Ruggedness can be done by changing the person to person for linearity, precision and accuracy in the levels of ULOQ, LQC, MQC and HQC. Stability studies were performed as zero hours, long batch, LT at -28 ºC and LT at -80 ºC. Day zero having two samples with six replicates of HQC and LQC levels. Long batch have 35 replicates of LLOQ, LQC, MQC and HQC level of samples with %Mean accuracy. LT at -28 ºC and LT at -80 ºC have HQC and LQC level with % Stability finding by comparison sample and stability sample.
RESULTS AND DISCUSSION:
System Suitability: System suitability was done by MQC level sample as six homogenous injections and will see the % RSD values for retention time and response of analyte and internal standard. The % CV for Ceritinib and standard area ratio was found to be 1.33%. Hence it passed the system suitability. The results are found to be within limits and results are summarised in Table 1.
TABLE 1: SYSTEM SUITABILITY DATA
Sample name Analyte area Analyte RT (min) STD Area STD RT (min) Area ratio
AQMQC 166132 7.64 162365 2.78 1.0232
AQMQC 162356 7.74 162378 2.79 0.9999
AQMQC 163256 7.63 164819 2.82 0.9905
AQMQC 166598 7.63 168015 2.81 0.9916
AQMQC 165239 7.53 167493 2.80 0.9865
AQMQC 167485 7.58 166985 2.79 1.0030
Mean 7.624 2.798 0.9991
SD 0.0707 0.0125 0.0133
%CV 0.93 0.45 1.33
Acceptance Criteria: The %CV of the retention time (RT) should be ≤2.00%. The % CV of the area ratio should be ≤5.00%
Auto sampler Carryover: Auto sample carryover was done by ULOQ and LLOQ level and check whether drug is remains in the system or not. The carryover area response in subsequent injections is found to be <20%. Hence the method passed the carryover effect. The results are summarised in Table 2.
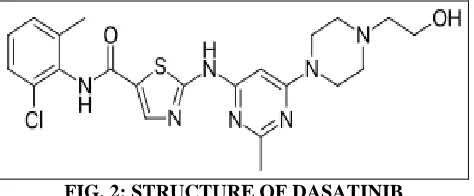
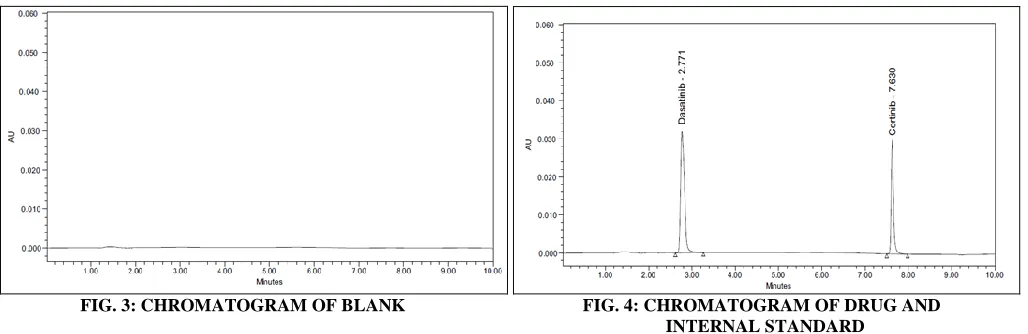
Fig. 3 and Fig. 4 represent the chromatograms of blank plasma sample and plasma sample spiked
[image:4.612.51.565.279.446.2]with drugs respectively. The results are shown in Table 3.
TABLE 2: AUTO SAMPLER CARRYOVER
Sample ID Peak area % Carry over
Drug STD Drug STD
Unextracted samples
RS 0 0 N/A N/A
AQ ULOQ 814596 791586 0.00 0.00
RS 0 0
AQLLOQ 1456 781236 N/A N/A
Extracted samples
STD Blk 0 0 N/A N/A
ULOQ 643991 791586 0.00 0.00
STD Blk 0 0
LLOQ 819 781236 N/A N/A
Acceptance Criteria: The carryover area response in subsequent injections of RS or STD blank after aqueous or extracted ULOQ should be ≤20.00% of the equivalent aqueous or extracted LLOQ standard area.
FIG. 3: CHROMATOGRAM OF BLANK FIG. 4: CHROMATOGRAM OF DRUG AND
INTERNAL STANDARD
TABLE 3: SPECIFICITY AND SCREENING OF BIOLOGICAL MATRIX
Sample ID Response % Interference Pass/Fail
Drug STD Drug STD
STD Blk1 0 0 0.00 0.00 Pass
LLOQ1 819 623987
STD Blk2 0 0 0.00 0.00 Pass
LLOQ 2 865 621798
STD Blk 3 0 0 0.00 0.00 Pass
LLOQ3 901 620859
STD Blk 4 0 0 0.00 0.00 Pass
LLOQ4 925 630015
STD Blk5 0 0 0.00 0.00 Pass
LLOQ5 891 619984
STD Blk6 0 0 0.00 0.00 Pass
LLOQ6 906 620065
Acceptance Criteria: Response of interfering peaks in STD Blank at the retention time of analyte should be ≤20.00% of that in LLOQ. Response of interfering peaks in STD Blank at the retention time of ISTD should be ≤5.00% of that in LLOQ. At least 80% of the matrix lots (excluding haemolysed, heparinised and lipemic matrix lots) with intended anticoagulant should be within the acceptance criteria.
Sensitivity: Sensitivity was done by LLOQ level sample to know the lowest limit of detection and calculate the % Mean accuracy and % CV. The %
TABLE 4: SENSITIVITY OF SAMPLE
Replicate No. LLOQ
Nominal concentration (µg/ml) 0.005
Nominal concentration range (µg/ml) (0.004-0.006)
Calculated concentration (µg/ml)
1 0.004
2 0.005
3 0.006
4 0.005
5 0.006
6 0.004
N 6
Mean 0.0050
SD 0.00089
% CV 17.89
% Mean accuracy 100.00
Acceptance Criteria: At least 67% (4 out of 6) of samples should be within 80.00-120.00%. %Mean accuracy should be within 80.00-120.00%. %CV accuracy should be ≤ 20.00%.
Matrix Effect: The matrix of plasma constituents over the ionization of analyte was determined by comparing the response of post-extracted plasma standard QC samples (n = 6) with the response of analyte from neat samples at equivalent
[image:5.612.50.564.386.587.2]concentrations. The matrix effect intended method was assessed by using chromatographically screened plasma. Precision (% CV) is 10.95% and 9.11% for Ceritinib at HQC and LQC, respectively. The results are given in Table 5.
TABLE 5: MATRIX EFFECT
Plasma Lot No. HQC LQC
Nominal Concentration (µg/ml)
3.000 0.050
Nominal Concentration Range (µg/ml) (2.550-3.450) (0.043-0.058)
Calculated Concentration (µg/ml) LOT 1
LOT 2 LOT 3 LOT 4 LOT 5 LOT 6
2.593 0.047
2.963 0.049
2.995 0.048
2.871 0.050
3.316 0.054
3.174 0.056
Mean (n = 6) 2.9857 0.0508
SD 0.32704 0.00463
% CV 10.95 9.11
% Mean accuracy 99.52 101.67
No. of QC failed 0 1
Acceptance Criteria: At least 67% (2 out of 3) of samples at each level should be within 85.00-115.00%. At least 80% (5 out of 6) of the matrix lot should be within the acceptance criteria. The %Mean accuracy of back calculated concentration of LQC and HQC samples prepared from different biological matrix lots should be within 85.00-115.00%.
Linearity: The standard curves were linear over the concentration range of 0.002 - 0.2 μg/ml. The correlation coefficient (r2) was 0.999. Samples were quantified using the ratio of peak area of analyte to that of internal standard. Peak area ratios were plotted against plasma concentrations, the limit of quantitation was 0.002 μg/ml. The linear graph is given in Fig. 5 and the results are
[image:5.612.318.563.631.746.2]TABLE 6: LINEARITY
Conc. (µg/ml) Back calculated conc. Avg. % CV % Mean accuracy
1 2 3
0.005 0.004 0.005 0.005 0.0047 7.67 94.00
0.020 0.019 0.020 0.022 0.0203 7.51 101.67
0.050 0.047 0.052 0.056 0.0517 8.73 103.33
0.100 0.087 0.095 0.110 0.0973 12.00 97.33
0.500 0.450 0.500 0.550 0.5000 10.00 100.00
1.000 0.862 0.950 1.145 0.9857 14.69 98.57
3.000 2.758 2.982 3.247 2.9957 8.17 99.86
4.000 3.470 4.200 4.574 4.0813 13.76 102.03
Acceptance Criteria: The regression coefficient should be R2 = 0.0999.
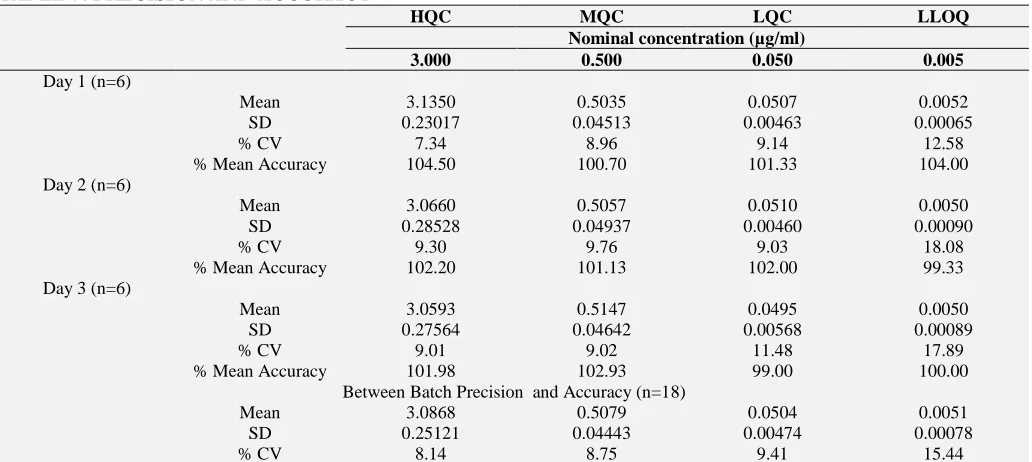
Precision and Accuracy: The intra-assay precision and accuracy were estimated by analysing six replicates containing Ceritinib at four different QC levels. The inter-assay precision was determined by
analysing the four levels QC samples on four different runs. The data on Precision and Accuracy is given in Table 7.
TABLE 7: PRECISION AND ACCURACY
HQC MQC LQC LLOQ
Nominal concentration (µg/ml)
3.000 0.500 0.050 0.005
Day 1 (n=6)
Mean 3.1350 0.5035 0.0507 0.0052
SD 0.23017 0.04513 0.00463 0.00065
% CV 7.34 8.96 9.14 12.58
% Mean Accuracy 104.50 100.70 101.33 104.00
Day 2 (n=6)
Mean 3.0660 0.5057 0.0510 0.0050
SD 0.28528 0.04937 0.00460 0.00090
% CV 9.30 9.76 9.03 18.08
% Mean Accuracy 102.20 101.13 102.00 99.33
Day 3 (n=6)
Mean 3.0593 0.5147 0.0495 0.0050
SD 0.27564 0.04642 0.00568 0.00089
% CV 9.01 9.02 11.48 17.89
% Mean Accuracy 101.98 102.93 99.00 100.00
Between Batch Precision and Accuracy (n=18)
Mean 3.0868 0.5079 0.0504 0.0051
SD 0.25121 0.04443 0.00474 0.00078
% CV 8.14 8.75 9.41 15.44
Acceptance Criteria: The within and between batch precision for LQC, MQC and HQC samples should be ≤15.00% and for the LLOQ QC, it should be ≤20.00%.
Intra-Batch: At least 67% (16 out of 24) of total QC samples and 50% (3 out of 6) at each level should be within 85.00 - 115.00% except LLOQ QC. LLOQ QC should be within 80.00 - 120.00%. % Mean accuracy for LQC, MQC and HQC samples should be within 85.00 - 115.00% and for the LLOQ QC sample it should be within 80.00 - 120.00%.
Inter-Batch: % Mean accuracy between batch for LQC, MQC and HQC samples should be within 85.00 - 115.00% and for the LLOQ QC sample it should be within 80.00 - 120.00%.
Recovery of Analyte: The recovery of drug and IS was evaluated at three concentration levels namely
low, medium and high quality control. Recovery was calculated by comparing its response in replicate samples with that of neat standard solution responses.
Analyte recovery from a sample matrix (extraction efficiency) is a comparison of analytical response from an amount of analyte added to that determined from sample matrix. Because of basic properties of Ceritinib, extraction was carried out using ethyl acetate as organic solvent.
[image:6.612.49.565.279.510.2]TABLE 8: RECOVERY OF ANALYTE
Sample HQC MQC LQC
Unextracted Response
Extracted Response
Unextracted Response
Extracted Response
Unextracted Response
Extracted Response
Mean (n=6) 656390.5 481863.7 261015.2 166099.2 1457.5 877.3
SD 4995.61 5779.16 2894.10 3561.45 42.66 36.03
% CV 0.76 1.20 1.11 2.14 2.93 4.11
% Mean Recovery 73.41 63.64 60.19
Overall % Mean Recovery 65.747
Overall SD 6.8566
Overall % CV 10.43
TABLE 9: RECOVERY OF INTERNAL STANDARD
Unextracted Area Ratio Extracted Area Ratio
Mean (n=6) 297018.7 161338.5
SD 5360.00 864.14
% CV 1.80 0.54
% Mean Recovery 54.32
Acceptance Criteria: The % CV of recovery at each QC level and for ISTD should be ≤ 15.00%. The overall mean recovery %CV for all QC levels should be ≤ 20.00%.
Ruggedness: The ruggedness is within acceptance limit. The data is given in Table 10. The precision
[image:7.612.51.565.315.497.2]and accuracy values for different column and different analyst are given below.
TABLE 10: RUGGEDNESS ON PRECISION AND ACCURACY
P &A ID HQC MQC LQC LLOQ QC
Nominal Concentration (µg/ml)
3.000 0.500 0.050 0.005
Nominal Concentration Range (µg/ml)
(2.550-3.450) (0.425-0.575) (0.043-0.058) (0.004-0.006)
Calculated Concentration (µg/ml) Different column
Mean (n=6) 3.0442 0.5062 0.0502 0.0050
SD 0.22376 0.03998 0.00454 0.00090
% CV 7.35 7.90 9.04 18.24
Mean Accuracy 101.47 101.23 100.33 99.00
Different analyst
Mean (n=6) 3.0812 0.5222 0.0500 0.0050
SD 0.20030 0.05426 0.00460 0.00090
% CV 6.50 10.39 9.21 18.24
Mean Accuracy 102.71 104.43 100.00 99.00
Acceptance Criteria: The within and between batch precision for LQC, MQC and HQC samples should be ≤15.00% and for the LLOQ QC, it should be ≤20.00%. At least 67% (16 out of 24) of total QC samples and 50% (3 out of 6) at each level should be within 85.00-115.00% except LLOQ QC. LLOQ QC should be within 80.00-120.00%. % Mean accuracy for LQC, MQC and HQC samples should be within 85.00-115.00% and for the LLOQ QC sample it should be within 80.00 - 120.00%.
Stability studies: Zero hours, long batch and LT at -28 ºC and LT at -80 ºC results of LQC, MQC, HQC were more than 85% which are within
acceptance limits. The results are furnished in Table 11.
TABLE 11: STABILITY DATA
Sample Nominal Concentration
(µg/ml)
Mean Calculated Conc. ± SD (µg/ml) (n=6)
%CV
Stability at day Zero
HQC 3.000 3.0077±0.17450 5.80
LQC 0.050 0.0502±0.00431 8.59
LT at -28 ºC
HQC 3.000 3.0960±0.399880 12.92
LQC 0.050 0.0526±0.00402 7.64
LT at -80 ºC
HQC 3.000 3.0242±0.39402 13.03
LQC 0.050 0.0513± 0.00388 7.56
SUMMARY AND CONCLUSION: The objective of this work was to develop a simple, cost-effective, rugged and sensitive HPLC method for determination of Ceritinib in rabbit plasma by using Dasatinib as internal standard. The work shows less run time while comparing with other reported methods. The total chromatographic runtime is 10.0 min with retention time for Ceritinib and Dasatinib at 7.630 min and 2.771 min, respectively.
The method is validated over a dynamic linear range of 0.002 - 0.2 µg/ml for Ceritinib with a correlation coefficient of 0.999. The intra-batch and inter-batch precision (% CV) across five levels (LLOQ, LQC, MQC, HQC and ULOQ) is less than 11.15. This can be validated according to USFDA guidelines.
ACKNOWLEDGEMENT: The authors are very much thankful for Spectrum Pharma Research Solutions, Hyderabad for providing pure drug samples.
CONFLICT OF INTEREST: The authors declare that there is no conflict of interests.
REFERENCES:
1. Deeks ED: Ceritinib: a review in ALK-positive advanced NSCLC. Target Oncol. 2016; 11(5): 693-700.
2. Shaw AT, Kim DW, Mehra R, Tan DS, Felip E, Chow LQ, Camidge DR, Vansteenkiste J, Sharma S, De Pas T, Riely GJ, Solomon BJ, Wolf J, Thomas M, Schuler M, Liu G, Santoro A, Lau YY, Goldwasser M, Boral AL and Engelman JA: Ceritinib in ALK-rearranged non-small-cell lung cancer. N Engl J Med. 2014; 370(13): 1189-1197. 3. McCormack PL and Keam SJ: Dasatinib: A review of its
use in the treatment of chronic myeloid leukaemia and Philadelphia chromosome-positive acute lymphoblastic leukaemia. Drugs. 2011; 71(13): 1771-1795.
4. Chen R, Chen B. The role of dasatinib in the management of chronic myeloid leukemia. Drug Des Devel Ther. 2015; 9: 773-779.
5. Reddy KY, Pranaya K, Babu K, Tanjeema MA, Ravi Kumar N and Udayasri: Analytical method development and validation for the estimation of Ceritinib by RP-HPLC method in bulk and pharmaceutical dosage form. Int J Chem Pharm Sci. 2016; 4(7): 376-380.
6. Babu SK, Rao NM and Rambabu C: Forced degradation studies and RP-HPLC method validation for the determination of Ceritinib in bulk and pharmaceutical dosage form. Asian J Pharm Clin Res. 2015; 8(3): 44-51. 7. Kumar AK, Ganapaty S and Radha GV: Analytical
method development and validation for the estimation of Ceritinib in pharmaceutical formulation by RP-HPLC. World J Pharm Res. 2016; 5(9): 1349-1357.
8. Kumar NC, Prathyusha V and Kannappan N: A novel validated stability indicating RP-HPLC method development for the estimation of Ceritinib in its bulk and finished dosage form as per ICH guidelines. Der Pharmacia Lettre. 2014; 6(5): 339-351.
9. ICH Harmonised Tripartite Guideline, Validation of analytical procedures: Text and methodology, Q2 (R1), International Conference on Harmonization, Geneva. 2005; 1-13.
10. Bioanalytical method validation, U.S. Department of Health and Human Services, Food and Drug Administration, USA. 2013; 1-28.
All © 2013 are reserved by International Journal of Pharmaceutical Sciences and Research. This Journal licensed under a Creative Commons Attribution-NonCommercial-ShareAlike 3.0 Unported License.
This article can be downloaded to ANDROID OS based mobile. Scan QR Code using Code/Bar Scanner from your mobile. (Scanners are available on Google Playstore)
How to cite this article: