© 2017, IRJET | Impact Factor value: 5.181 | ISO 9001:2008 Certified Journal | Page 315
treatment in urban cities
Mr. Gandhar Abhay Pandit
1, Miss. Samruddhi Shivraj Jagtap
21
U.G. Student, Department of Environmental Engineering, KIT’s College of Engineering, Kolhapur,
Maharashtra, India
2
U.G. Student, Department of Environmental Engineering, KIT’s College of Engineering, Kolhapur,
Maharashtra, India
---***---Abstract -
Waste treatment and management has now become a crucial problem due to the inadequate and insufficient collection, disposal and treatment techniques, we are facing a severe problem of environmental pollution. It is the duty of the local governing authorities to provide proper solid waste treatment and management techniques in order to keep our city hygienically clean and environmentally healthy. Even though disposal of the solid waste has become a serious techno-economic problem for treatment, Kagal Municipal Council is working & planning towards making the city clean. One method used in order to reduce this grave problem of disposal is the conversion of the wet waste to electricity. This paper includes the technology adopted by the Kagal Municipal Council that involves the utilization of the solid waste generated as a resource for the generation of electricity. This paper includes everything right from the way collection of solid waste is done to the generation of electricity using the anaerobic digester.Key Words: Solid waste management, anaerobic treatment, methane, electricity, manure.
1. INTRODUCTION
Rapid urbanization and industrialization in India has led to the migration of people to towns and cities thus generating thousands of tons of Municipal Solid Waste (MSW) daily. According to the 2015, CPCB report, the estimated solid waste generation in the country is around 1.43 lakh tons per day. The report said that cities like Pune, Mumbai, Ahmedabad, Agra, Bangalore, Bhopal, Chennai, Delhi, Hyderabad, Jaipur, Kanpur, Kolkata, Lucknow, Nagpur and Surat, among others, have an estimated waste generation of more than 500 tons per day.Poor collection, inadequate transportation and insufficient space to treat the waste of entire city are responsible for the accumulation of MSW at every corner. Unscientific disposal and treatment has lead to an adverse impact on all components of the environment and human health. Solid wastes are usually defined as the organic and inorganic waste materials produced by various activities of the society and which have lost their value to the first user. Rapid increase in population has lead to the
increased rate in waste generated from several sources such as domestic wastes, commercial wastes, institutional wastes and industrial wastes etc.
Rapid population growth and increase in per capita waste generation have resulted in a 50% increase in the waste generated by Indian cities within only a decade since 2001. There are 53 cities in India with a million plus population, which together generate 86,000 TPD (31.5 million tons per year) of MSW at a per capita waste generation rate of 500 grams/day. Such a steep increase in waste generation has severed the stress on all available natural and budgetary resources.
1.1 Kagal Solid Waste Treatments
Kagal situated 12 km from Kolhapur city (16.58°N 74.32°E) is a historically rich city located in the south west of Maharashtra State. Kagal has the honor of having the first textile cluster (5star MIDC) in western Maharashtra. Kagal has been on the tourist map of India, both Hindu and Muslim pilgrims visit the famous Gaibee Peer. The Kagal Municipal Council is collecting 10 to 11 Tons MSW per day. The average waste generation is only 200gm per capita per day. The city is registering almost 15% extra growth rate compared to similar other cities in India. This is leading to rapid development of real estates, housing, complexes etc. Consequently the per capita MSW quantity has been estimated to reach 300 gm/day by 2016 as per DPR. The present population as per census 2011 is 35,075.
© 2017, IRJET | Impact Factor value: 5.181 | ISO 9001:2008 Certified Journal | Page 316
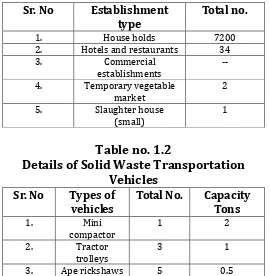
Table no. 1.1
No. of establishments covered by door to
door service
Sr. No
Establishment
type
Total no.
1. House holds 7200
2. Hotels and restaurants 34 3. Commercial
establishments -- 4. Temporary vegetable
market 2
5. Slaughter house
(small) 1
Table no. 1.2
Details of Solid Waste Transportation
Vehicles
Sr. No
Types of
vehicles
Total No.
Capacity
Tons
1. Mini
compactor 1 2
2. Tractor
trolleys 3 1
3. Ape rickshaws 5 0.5
© 2017, IRJET | Impact Factor value: 5.181 | ISO 9001:2008 Certified Journal | Page 317
Collection of Dry waste (11-2 pm) from D to D 39.20 %
Segregation
Crusher
Bio Digester
By product Biogas Collector
For Farming Electricity 50KWH/Hr
Door to Door Collection
Morning Collection of wet waste (6-10 am) from Hotel/
House/Markets
60.80%
If excess, will be used for pumping
station Supply to Street
Light
Segregation by using mechanical waste separators
on next day
Plastic (6%)
Rag, Metal, Glass & Rubber (14.20%)
Debris (19%)
Hydro-carbon Oil (proposed)
Recycle
© 2017, IRJET | Impact Factor value: 5.181 | ISO 9001:2008 Certified Journal | Page 318
2.1 Stage 1 Collection
The solid waste is collected from all the houses in Kagal by means of truck. The door to door collection of the solid waste is done in two phases viz.
I. Bio degradable waste is collected during the morning hours
II. Non bio degradable waste is collected during the evening hours.
Separate collection for vegetable market waste is carried out on Monday and Thursday (60% wet waste). Hotel waste is collected in the morning and the evening (80% wet waste).Slaughter house waste (except feathers) is also collected.
2.2 Stage 2 Segregation
Here the separation of biodegradable waste and non biodegradable waste is done.
1. Bio degradable waste is segregated on table and sent to a crusher and then to green box of capacity two ton each. From this biodegradable waste about 280 m3 of biogas is generated that is stored in a balloon. Generally the lemon and onion peels are removed from the wet waste as they tend to fluctuate the pH.
2. Non biodegradable waste is separated by two sieve separators of capacity one ton each. Materials like plastic, rubber, etc are recycled and sold out. Some of the materials are also auctioned or given to the rag pickers.
3. The building debris is sent to a crusher unit after which it is used for road blanketing, landfill, etc.
2.3 Stage 3 Crushing
As the organic waste is in various sizes, it is shredded in the crusher to form fine slurry and water is added to this shredded waste in the proportion 1:1. The fine slurry helps the bacteria to consume the organic matter efficiently and in a short period. Apart from this the fine slurry of waste is easier to digest as compared to the regular waste particles.
2.4 Stage 4 Bio Digestions
The biodegradable waste is set to two Green Boxes where generation of biogas takes place. Green boxes are nothing but the bio digester which is air tight reactors in which organic waste is decomposed and transformed into biogas by a biological process called anaerobic digestion. It is like a mechanical stomach.
It is fed with waste slurry, which is broken down (decomposed) by micro-organisms (bacteria) is an oxygen-free (anaerobic) environment via a process called as anaerobic digestion, to produce biogas (methane and carbon dioxide) and other material that is mainly used as fertilizer. Anaerobic digestion is a four stage process consisting of
hydrolysis, fermentation i.e. conversion of non soluble organic bio mass to soluble organic compounds, acidification i.e. conversion of volatile fatty acids to acetate and hydrogen gas and finally methane formation. The final product is a mixture of methane (CH4), carbon dioxide (CO2) and other
trace gases.
In bio digester, the pH is generally kept in the range of 7.0 to 7.5 i.e. neutral ranges. A temperature of 38-41°C is maintained in the green box. Here cow dung (1:7) and water hyacinth (1:9) are added which helps to accelerate the growth of culture and in order to provide necessary nutrients to the micro organisms present in the green box. There are two green boxes each of 2 tons.
2.5 Stage 5 Gas Separators
After the decomposition of the waste in the green box, the gas which is produced from the process needs to be separated from the waste. So gas separators are provided in order to separate the gas from the by product. The gas is further sent to the generation of electricity and the left over by product from this separator is sent to manure beds for preparing vermin compost.
2.6 Stage 6 Gas Collectors
After the gas separator, the generated gas is sent to gas collection balloons. There are two balloons of 60m3 capacity each. Generally out cuff valves are provided for safety purpose. Once the gas is filled in the balloons up to desired level, the valves are automatically closed and the excess gas is burnt off in order to avoid air pollution due to methane. Minimum of 3 bars and maximum of 5 bars pressure is maintained in the balloons. This gas includes around 65% of methane, moisture, CO2 and H2S. CO2 and H2Sare separated
by using a scrubber whereas moisture is removed by means of moisture separator.
2.7 Stage 7 Electricity generators
A 63 KV generator has been installed for generation of electricity from the gas. The electricity generated isabout 500kw/day which is used to illuminate 3 km street lights and existing Underground Street light. Also 900 street lights of 35 vat CFL/metal halides are laminated and the remaining electricity is supplied to the pump house.
2.8 Stage 8 Composting
© 2017, IRJET | Impact Factor value: 5.181 | ISO 9001:2008 Certified Journal | Page 319
21 days study observation table
Date
Total Feeding
(kg)
KWH
1 - 57.5
2 535 57.6
3 - 58.4
4 580 58.6
5 - 58.9
6 - 58.9
7 925 59.0
8 - 59.6
9 - 59.7
10 - 59.9
11 495 60.0
12 - 60.3
13 - 60.6
14 521 60.7
15 - 60.9
16 510 61.3
17 - 61.8
18 - 62.0
19 524 62.1
20 650 62.2
21 - 62.8
0 100 200 300 400 500 600 700 800 900 1000 01 -0 7 -2 0 16 02 -0 7 -2 0 16 03 -0 7 -2 0 16 04 -0 7 -2 0 16 05 -0 7 -2 0 16 06 -0 7 -2 0 16 07 -0 7 -2 0 16 08 -0 7 -2 0 16 09 -0 7 -2 0 16 10 -0 7 -2 0 16 11 -0 7 -2 0 16 12 -0 7 -2 0 16 13 -0 7 -2 0 16 14 -0 7 -2 0 16 15 -0 7 -2 0 16 16 -0 7 -2 0 16 17 -0 7 -2 0 16 18 -0 7 -2 0 16 19 -0 7 -2 0 16 20 -0 7 -2 0 16 21 -0 7 -2 0 16 Total Feeding (kg)
Chart 1.0.
21 days study observation table
3. CONCLUSIONS
Kagal Municipal Council’s waste treatment plant proves to be one of the efficient ways of treating the solid waste. It provides an epitome of the treatment for cities having low population. Thus the small cities can easily replicate the model in order to have efficient waste management system.
Other objectives like employment generation and aiding the economy is accomplished. Usually the compost prepared from the project is sold to the nearby famers at rate of ₹5 per kg. It generates revenue as well as helps in reducing the burden on the local authorities by the treatment of waste generated.
This treatment system requires less area as compared to other treatment options, it maybe a feasible option in case of metro Politian cities. Such type of plants can be executed for two or three wards or for group of buildings. It is a good and proven example of Solid Waste Disposal & Treatment Plant.
ACKNOWLEDGEMENT
We would like to express our gratitude to Mr. Nitin Kamble, Sanitation Officer, Kagal Municipal Council for permitting & supporting us for the carrying out a case study at one of their Solid Waste Management plants without which this work would not have been possible.
© 2017, IRJET | Impact Factor value: 5.181 | ISO 9001:2008 Certified Journal | Page 320 Engineering, KIT’s College of Engineering, Kolhapur for their
valuable support directly & indirectly in the successful completion of this case study as well as for their constant encouragement throughout the work.
REFERENCES
1. Ministry of Urban Development, Government of India, “Manual on Municipal Solid Waste Management”, 2000 Edition.
2. Getahun T1, Gebrehiwot M, Ambelu A, Van Gerven
T, Van der Bruggen B”The potential of biogas production from municipal solid waste in a tropical climate.” Environ Monit Assess. 2014
Jul;186(7):4637-46. doi: 10.1007/s10661-014-3727-4. Epub 2014 Apr 4.
3. MOMOH, O.L. YUSUF; NWAOGAZIE, L. Ify “Effect of Waste Paper on Biogas Production from Co-digestion of Cow Dung and Water Hyacinth in Batch Reactors “J. Appl. Sci. Environ. Manage. December, 2008 Vol. 12 (4) 95 – 98
4. A. Apte, V. Cheernam, M. Kamat, S. Kamat, P. Kashikar, and H. Jeswani .” Potential of Using Kitchen Waste in a Biogas Plant”. International Journal of Environmental Science and Development, Vol. 4, No. 4, August 2013
5. http://www.iitk.ac.in/3inetwork/html/reports/IIR 2006/Solid_Waste.pdf