© 2016, IRJET | Impact Factor value: 4.45 | ISO 9001:2008 Certified Journal
| Page 383
BY USING HYBRID SYSTEM TO IMPROVE EFFICIENCY OF POWER SYSTEM
1) 1
Vrushali V. Chaudhari,
2Ajit P. Chaudhari,
3Girish k. Mahajan,
4Gaurav P. Tembhurnikar
Department of Electrical S.S.G.B. College of Engg. Bhusawal
---***---Abstract:- Hybrid power generation system using Offshore-wind turbine and Tidal turbine for Power fluctuation Compensation is
an autonomous power system. Electric power is generated from both offshore wind and tidal and is distributed over the load system. Power quality problems such as frequency fluctuations and voltage sags, which arise due to a fault or a pulsed load, can cause interruptions of critical loads. This can be a serious concern for the survivability of the offshore-wind power system. In the proposed system, the DC generator for the tidal turbine can play also as a motor to store kinetic energy to mitigate (make stable)
the voltage fluctuation. The tidal generator is controlled by Switching control unit. When the wind generator/motor is driven by the control unit to exceed the tidal turbine rotating speed, it is mechanically isolated from the turbine by a one-way clutch and can
charge and discharge the kinetic energy like a fly-wheel. In order to study the feasibility of the system, the laboratory scale model was designed.
Keywords: Offshore-Wind Turbine, Tidal Turbine, Flywheel, Hybrid System.
Introduction
One important aspect of wind turbine applications, especially in an industrial environment, is that wind turbines generate electricity without creating pollution. Power systems based on renewable sources are affected by fluctuations on the generation side due to the seasonal and random nature of the energy resource [1], [2]. At the same time, the loads have also variable power demand. In this case, energy storage systems (batteries,
fly-wheels and so on) play an important role in matching up generation and demand. We have proposed the Hybrid power generation system using Offshore-wind turbine and Tidal turbine.
We propose an improved system to compensate generated power fluctuation and to stabilize voltage.In the proposed system, a tidal generation system of smaller capacity than a wind generation system is installed parallel to the offshore-wind system. Generally, the tidal flow is more stable than wind flow. The output of the tidal generator (induction machine) is controlled by the use of an MOSFET in order to compensate the power fluctuation of offshore-wind turbine generator. Additionally, the tidal Dc generator rotor can be mechanically isolated from the tidal turbine shaft by a one-way clutch, while the rotation speed of the turbine is lower than that of the rotating magnetic field given by the inverter. In other words, tidal Dc generator can be operated as not only the tidal turbine generator but also a fly-wheel energy storage and motor/generator system by use of the IGBT inverter control. The basic control strategy and the working of the proposed hybrid generation system are developed for the project.
I.
Proposed Model System
2.1 Model Setup
© 2016, IRJET | Impact Factor value: 4.45 | ISO 9001:2008 Certified Journal
| Page 384
the system Wind energy is the energy produced from the simple air in motion and this motion is caused by the uneven heating of the earth’s surface by the sun. The air over the sea absorbs the heats faster than the land and so the air moves from the sea to the land causing the wind but in the night the air motion is changed from the land to the sea because the air over the sea cools faster than the air over the land. This wind is hardly predictable source of energy. Tidal energy is due to the gravitational influence of the moon and the sun on the earth due to the rotation of the earth relative to the moon and the sun which produces two high and two low waters each day (12.4 h cycle). This rotation makes the rise and fall of the tides and these tides are predictable. These tides run approximately six hours in one direction and then reverse for another six hour in the opposite direction [1, 2]. Tidal in-stream energy has various advantages such as high energy density, hence cheap rotors for power output, predictable energy; hence its integration is easy, low environmental impact and low bird disturbance [3]. The main difference between the wind and tidal is the high density of the seawater (800 times greater than air) if it is compared to wind and this helps to use a smaller system for tidal and obtaining the same energy [4, 5]. While wind turbines have negative issues such as audio noise, visual impacts, erosion, birds and bats killed and radio interference, it is useful in rural area applications where access to transmission facilities is limited. Moreover, wind energy helps to reduce the environmental damage (Green house Gas emissions) and climate change due to fossil fuel replacement [6]. The wind power resource is intermittent and challenging to predict, and requires using some form of storage to integrate it in the electric grid. New control techniques and improved forecasting methods help establish operating practices which will increase reliability of wind energy supply to the grid. The problems of wind and tidal-stream may be overcome by the advanced technology in the near future and will become from the preferred ways for obtaining electrical energy.Fig.1: HOT-PC configuration system
2.2 Hybrid structure of energy conversion
© 2016, IRJET | Impact Factor value: 4.45 | ISO 9001:2008 Certified Journal
| Page 385
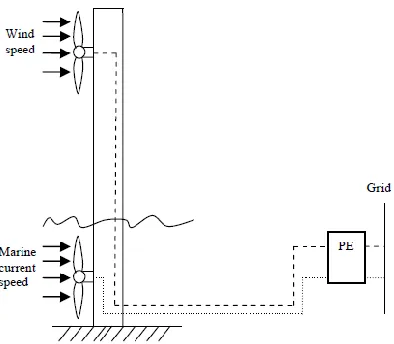
compensate for the non-continuous electricity production. Yet, there are also some issues like: From the general point of view, one can find that is important to have the same foundation for the two turbines, in order to have a more economic system. This does not concern the present paper, but this is still a field where many researches can be conducted, because it needs to have multiple characteristics: esthetical (no one wants to damage the landscape), environmental friendly, but also has to be resistant enough to be able to take the waters galling and the wear that comes from the two turbines. [image:3.612.228.425.326.498.2]In fig. 2 is shown the general the structure of the hybrid connection. It is composed, in a simplify view, from two turbines the offshore wind turbine, the tidal turbine and the power electronics device (PE) used to obtain a good quality of the energy and to solve the grid connection problems, and storage problems. Also, an effective maintenance system has to be studied, because do to the harsh environmental condition many problems have to be taken into consideration. In the hybrid connection the two energy sources has to compensate one another in order to produce energy in continuous regime. It is a well-known fact that the biggest problem with the renewable energies is that they do not produce energy continuously. In this study the diesel generator, used mainly in all hybrid connections as a backup for energy production. It is the tidal turbine the one who will fulfill this place and be considered as a continuous source, because the resource is most of the time constant and predictable. There are rare cases when the marine current surpasses the nominal speed or underpass it. As for the wind turbine, working in offshore gives it an almost continuous working regime, due to the much important wind presence, comparing with land condition. But, if there are problems with any off the resources they can be helped with the power stoked into batteries.
Fig. 2: General structure of the hybrid structure of energy conversion
II.
SYSTEM DEVELOPMENT
Block diagram Description:
© 2016, IRJET | Impact Factor value: 4.45 | ISO 9001:2008 Certified Journal
| Page 386
Fig.3: Block diagram of image of the proposed system setup© 2016, IRJET | Impact Factor value: 4.45 | ISO 9001:2008 Certified Journal
| Page 387
Many of system make up an offshore-wind/tidal generation farm and the ac generation power is converted and gathered to dc power. The dc power is transmitted through a dc under-sea transmission cable to a grid dc/ac converter station.To investigate the system performances and the control strategies, a small laboratory base hybrid power system model, whose photograph and
schematic view are shown in Fig. 5(b) and (c), were designed and made. The system has two types of generators, the tidal motor/generator and the offshore wind turbine generator. The tidal turbine (induction machine) can act as a motor or as a generator depending on the need. Thetidal generator provides smooth total output power, whereas the output power of a wind turbine depends on the wind velocity.
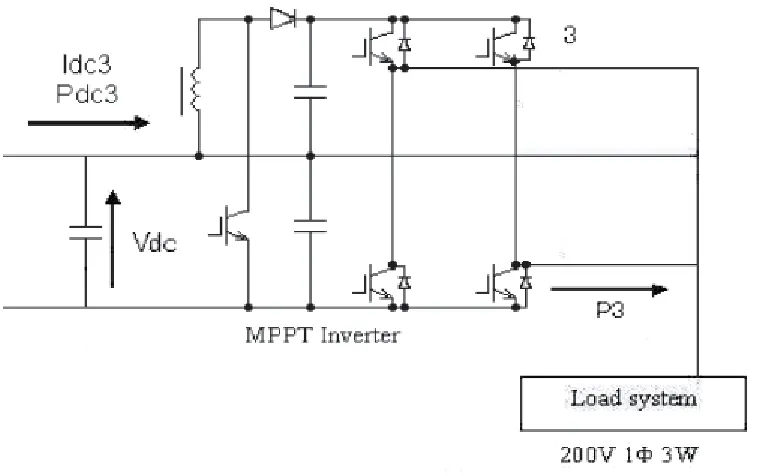
[image:5.612.63.443.319.557.2]3.1 Inverter circuit configuration
Figure 5 shows the HOTT inverter circuit for this method. The output of the inverter is a single-phase three-wire system. A general domestic power supply is often a single-phase three-wire system. The inverter has a circuit configuration that combines two half bridges. The input can share one line with the output by using the half bridge type inverter (Jeoung, H., Choi, J., 2000). In order to meet the grid voltage (200V), the boost up chopper circuit is adopted in figure 5 to increase the voltage of the DC side.
Fig. 5: Boost up chopper with a half-bridge inverter circuit
2.2 Rectifier circuit
The basic design of rectifier circuit for three phase supply is shown above. We want the output of the rectifier to be 18V and 4.6 Amps. 18V is considered because in market the converter is obtained for 12V ratings. Here in our project we are using 12V battery design. As we know that output of the generator is 3-phase AC signal as we have used a 3-phase uncontrolled rectifier using the diodes in the bridge form. The output of the rectifier block is pulsating DC, which is filtered with the help of capacitor filter to make it pure DC.
Design:
Given Vldc = 18V, Idc = 4.6 Amps
© 2016, IRJET | Impact Factor value: 4.45 | ISO 9001:2008 Certified Journal
| Page 388
Vldc = (3* Vm line) / Therefore
18 = (3* Vm line) /
Vm line = 22.5 V
Vm phase = Vm line / 3
= 15.35V
Fig.6 PIV of each diode = Vm line
= 22 V
Id avg = 4.6/ 3
=1.5 Amps
Id rms = Idc / 3
= 1.7 Amps
Id peak = Idc
= 4.6 Amps
Voltage regulator:
© 2016, IRJET | Impact Factor value: 4.45 | ISO 9001:2008 Certified Journal
| Page 389
IV.Features of LM317: Current handling capacity 1.5A max.
Output voltage range 1.2V – 37V presentable.
Line regulation 0.01%/ V
Load regulation 0.1%
80dB ripple rejection
100% electrical burn in.
Its output voltage can be calculated using the formula,
Volt = 1.25V*(1+R2/R1)
We need output voltage of 14.2V of the charging circuit at 4A. This IC cannot handle 4A but is fulfilling our need of presetting the voltage so we will employ a series pass transistor of higher current rating to handle the max. current. So output of this regulator will drive the base of the transistor where at the collector the rectified DC is applied and at the emitter output is taken out through the series diode.
This diode prevents the reverse voltage of the battery to damage the charging circuit. Also, it prevents the battery from discharging through the charging circuit in idle state. So, if we choose R1=220ohms and we need output voltage V0 to be 15V approx. then the value of R2 can be calculated. Putting these values to the formula
15V=1.25V (1+R2/220)
Therefore, R2=2.4K ohm.
3.4.
3 Charging Systems for Batteries
The modern charging system hasn't changed much in over 40 years. It consists of the generator, regulator (which is usually mounted on the generator or close to it to avoid copper loss and dissipate heat) and the interconnecting wiring.The purpose of the charging system is to maintain the charge in the battery, and to provide the main source of electrical energy while the system is running.
If the charging system stopped working, the battery's charge would soon be depleted, leaving a "dead battery." If the battery is weak and the generator is not working, the system may not have enough electrical current to operate it. If the battery is "dead", it does not necessarily mean that there is anything wrong with it. It is just depleted of its charge. It can be brought back to life by recharging it with a battery charger.
The main component in the charging system is the generator. The generator that produces Alternating Current (AC), like the electrical current in your home. This current is immediately converted to Direct Current (DC) inside the generator. This is because all modern automobiles have a 12 volt, DC electrical system.
A voltage regulator regulates the charging voltage that the generator produces, keeping it between 13.5 and 14.5 volts to protect the electrical components.
There is also a system if something is not right with the charging system, a warning lamp. This lamp If this warning lamp lights up while the generator is running, it means that there is a problem in the charging system, usually a generator that has stopped working. The most common cause is a broken generator drive belt.
© 2016, IRJET | Impact Factor value: 4.45 | ISO 9001:2008 Certified Journal
| Page 390
to that of running water. Water flows through a pipe with a certain amount of pressure. The size (diameter) of the pipe dictates how much resistance there will be to the flowing water. The smaller the pipe, the more resistance. You can increase the pressure to get more water to flow through, or you can increase the size of the pipe to allow more water to flow using less pressure. Since too much pressure can burst the pipe, we should probably restrict the amount of pressure being used. You get the idea, but how is this related to the flow of electricity?Well, voltage is the same as water pressure. Amperage is like the amount or volume of water flowing through, while resistance is the size of the wire transmitting the current. Since too much voltage will damage the electrical components such as light bulbs and computer circuits, we must limit the amount of voltage. This is the job of the voltage regulator. Too much water pressure and things could start breaking. Too much voltage and things could start burning out.
Now, let's go a little deeper and see how these charging system components work to produce the electrical power that a modern automobile requires.
3.5 BATTERY:
3.5.1 Lead Acid Battery:
The positive and negative electrodes of a lead acid battery are immersed in dilute sulphuric acid. When the battery is fully charged, there is lead peroxide the positive plate and spongy lead on the negative plate as the active materials. During the process of discharge, the chemical reactions from lead sulphate on both the plates thereby, liberating water. The specific gravity of the electrolyte is lowered during charging, there is reversal of the chemical reaction and the specific gravity of the electrolyte rises. The specific gravity is a good indication of the state of charge of a battery. The chemical reactions that take place during charging and discharging are as follows:
Charged Discharged
Positive Electrolyte Negative Positive Electrolyte Negative
Plate Plate Plate Plate
Pbo + 2H SO + pb ==== pbso + 2H O + pbso (Lead (Sulphuric (Spongy (Lead (Water) (Lead
Peroxide) acid) lead) sulphate) sulphate)
Table.1
Field Discharge Circuit:
A field discharge switch is used in the excitation circuit of analternator. This switch eliminates the potential danger to personnel and equipment resulting from the high inductive voltage created when the field circuit's opened.
Fig.4.8 illustrates the connections for the field circuit of a separately excited alternator. With the discharge switch closed, the field circuit's energized and the field discharge switch functions as a normal double-pole, single-throw switch.
© 2016, IRJET | Impact Factor value: 4.45 | ISO 9001:2008 Certified Journal
| Page 391
Fig.7: Field discharge circuitFig.8: Field discharge switch
When it's desired to open the field circuit, the following actions must take place.
Before the main switch contacts open, switch blade A meets contact B and thus pro vides a second path for the current through the field discharge resistor.
When the main switch contacts C-D open (Fig.4.10) high inductive voltage is created in the field coils by the collapsing magnetic field.
This high voltage is dissipated by sending a current through the field discharge resistor.
This procedure eliminates the possibility of damage to the insulation of the field windings as well as danger to anyone opening the circuit using a standard double pole switch. A field circuits used with all types of alternators.
Specifications:
Sr. No. Item Specification
1 Motor 1 Ac 230V/1500rpm/250W
2 Motor 2 Ac230v/2000/350W
3 3 Phase generator 12V/250W/2000 rpm
4 DC Generator 12V/250W/1500 rpm
5 Electromagnetic clutch 12V
6 Battery 12V/7.5ah
© 2016, IRJET | Impact Factor value: 4.45 | ISO 9001:2008 Certified Journal
| Page 392
Table-2Test Results
In the test plans section, three set ups were presented to help identify the properties of themotor, MPPT controller, and the two components combined. For the no-load test of the controller, the output voltage of the DC generator can generate between 10.66V to 19.65V from the RPM speeds of 350 to1200 These results, show that the motor at low to medium speeds can provide enough voltage for the MPPT controller to turn on.
The input range of the MPPT controller was also tested. The stated input voltagerange of 10-20Vwas tested using a DC power supply. Conducting this experiment, we found thatthe input voltage range to obtain 24V output is between 11.2V to 24V initially, and after thecontroller is activated, the input voltage can be turned down to as low as 8V and still maintain12V output. In addition, the controller was also put through a load test. It is desired to output100W, so the full load output current needed to produce this power output with a 12V outputvoltage is 8.03A. While maintaining a constant input voltage of 12V, an increment of 0.417Awas done to the load to obtain data showing 10% augmentations of each test. When the boostcontroller reaches full load, we noticed that a lot of current from the source is being pulled to achieve close to 100W output. The efficiency of the controller is not what is stated in thecompany’s website; however, 89% efficiency is still very efficient and effective in not having toomuch lost between the input and output. Table 7-2 displays the results of different loads on thecontroller. Figure 7-2 shows the efficiency of the system while undergoing various load tests.
In addition to finding the controller’s efficiency, it is also important to find its load andline regulation as each of these will allow us to tell how the controller can maintain its outputvoltage when its output power fluctuates in addition with the flywheel system or when the input voltage varies while the controller is performing at max load, respectively. The following two equations are used to find load and line regulation:
%Load Regulation=Vout(loe-load)- Vout(high-load) / Vout(high-load) × 100%
%Load Regulation= Vout(high-input)- Vout(low-input) / Vout(nominal) × 100%
Extracting the data, the controller is performing at 10% and 100%loads, the load regulation of MPPT controller is 9.97% which is good as this meansthe output voltage does not vary too much when we are demanding more power from thecontroller. The value of 9.97% for the percent load regulation was found by obtaining outputvoltages of 12.26V at no load and 11.06V at 96% of max load when maintaining a constant inputvoltage of 12.22V. The line regulation of the boost controller is determined to be 31.57% for thedifference in output voltage when the input voltage reaches its upper and lower limitations beforethe output voltage becomes unstable. 10V and 20V were used as the lower and upper bounds ofthe input voltage range because those are the recommended voltage limits of the MPPTController. The controller outputted 15.66V and 22.67V when receiving 10V and 20V at theinput, respectively, and the nominal voltage output was around 13.2V. The nominal voltageoutput of the controller should be 12V but the controller could only output a stable 13.2V due tothe controller operating at maximum load of 12.5A, which will provide a lot of strain to thecontroller.
After testing both the generator and the motor, they need to be connectedfor further testing. An adjustable speed control was used to control the motor’s speed while theelectronic load controlled the load at the output of the converter. Load tests were done at speedsfrom 450RPM to 1500RPM to determine the peak output current and power for the two interfaced systems of tidal and wind. It is important to note that the motor needed to first be driven at 350RPM to MPPT controller before data between 150RPM to 350RPM became valid and able to output 24V.
© 2016, IRJET | Impact Factor value: 4.45 | ISO 9001:2008 Certified Journal
| Page 393
Graph-1: Graph of the MPPT system at the varying load condition.Vout Iout Pout Pin %Efficiency
12 0.417 9.99 11.84 84.36
12 0.834 19.97 22.25 89.36
12 1.251 29.90 32.15 93.00
12 1.668 39.87 43.94 90.72
12 2.085 49.77 55.37 89.99
12 2.502 59.67 66.66 89.52
12 2.919 69.53 77.96 89.18
12 3.336 79.36 89.52 88.65
12 3.753 89.17 99.92 89.24
12 4.17 98.91 112.12 88.22
Table-3 Output of the combined system output at load after MPPT.
5.4Wind Turbinegenerator output:
Output Voltage Speed (RPM)
186 3000
167 2700
148 2400
129 2100
110 1800
93 1500
74 1200
54 900
35 600
© 2016, IRJET | Impact Factor value: 4.45 | ISO 9001:2008 Certified Journal
| Page 394
Graph-2: Graph of output voltage against speedTorque Nm Input Current
0.1 0.273
0.2 0.31
0.3 0.343
0.4 0.386
0.5 0.44
0.6 0.493
0.7 0.553
0.8 0.613
Table-5: torque at different input current
© 2016, IRJET | Impact Factor value: 4.45 | ISO 9001:2008 Certified Journal
| Page 395
TorqueNm Speed (RPM) Pin (W)
Pout
(W)
Power Factor
(W)
%Efficiency
0.1 2893 85 30.2945 0.47305 35.6406
0.2 2868 97 60.0654 0.47666 61.9231
0.3 2847 107 89.4385 0.476471 83.5873
0.4 2827 108 118.4136 0.427727 109.6422
0.5 2799 115 146.5509 0.399907 127.4356
0.6 2770 121 174.0391 0.3742142 143.8339
0.7 2741 125 200.9198 0.3443380 160.7358
0.8 2710 130 227.0257 0.3236294 174.6351
Table-6: Table of different power factor and efficiency with different power input
The graph of efficiency is calculated using the combination of the two power formulas, combing them to make the formula for efficiency.
Torque Nm %Efficiency 0.1 35.6406 0.2 61.9231 0.3 83.5873 0.4 109.6422 0.5 127.4356 0.6 143.8339 0.7 160.7358 0.8 174.6351
© 2016, IRJET | Impact Factor value: 4.45 | ISO 9001:2008 Certified Journal
| Page 396
Graph-4: Torque against efficiency graphTable-5: Plot showing the relationship between voltage and speed at with no load connect to the motor
© 2016, IRJET | Impact Factor value: 4.45 | ISO 9001:2008 Certified Journal
| Page 397
5.5Algorithm: Connect the supply to the motor of the wind turbine
Vary the supply voltage of the motor from min to max.
Generator voltage is connected to the tidal generator and it acts a motor
And starts running and the fly wheel starts to operate.
When the speed matches the preset value, which is detected by the tachogenerator output given to the controller.
Controller operates the relay
And the clutch operates and connects the shaft the motor shaft is coupled and the motor starts to operate as a Dc generator and the flywheel action is utilized. The second tachogenerator output is sampled and compared with the first one to make switching.
The DC voltage is fed to the battery and the voltage is fed to the MPPT and then to the load.
Conclusion
This paper presents a concept research for tidal turbine-offshore wind turbine hybrid connection system based on real time simulation. The paper puts forward the reasons why such a study is welcomed at this moment. It is developed the general structure of a hybrid structure concerning the using of two real time emulators: a wind turbine emulator and a tidal turbine emulator. Both of the emulators are conceived with the hardware-in the-loop simulation principles. The structures of the two emulators are presented, in the succeeding of the paper. The wind turbine emulator has in composition an informatics system and an electromechanical system, based on a permanent magnet synchronous simulator and a synchronous generator. The tidal turbine emulator is formed from a software system and an electromechanical system, which contains an asynchronous drive: a doubly feed induction generator and an active break. The final part of the paper proposes the structure connection between the emulators and research directions that are to be studied from now on.
REFERENCES
[1] Mohammad Lutfur Rahman, “ Hybrid Power Generation System Using Offshore-Wind Turbine and Tidal Turbine for Power Fluctuation Compensation (HOT-PC)” IEEE, Shunsuke Oka, and Yasuyuki Shirai, Member, IEEE
[2]Mohammad Lutfur Rahman., Lutfur Rahman., Yasuyuki Shirai., “Design and analysis of a prototype HOTT generation system” BUP JOURNAL, Volume 1, Issue 1, September 2012, ISSN: 2219-4851
[3]Hamed H. H. Aly, M. E. El-Hawary, “The current status of wind and tidal in-stream electric energy resources” Department of Electrical and Computer Engineering, Dalhousie University, Halifax, Nova Scotia, Canada, B3H 4R2
[4]Sean Leavey Supervisor: Dr Stefan Hild “Mitigating Power Fluctuations from Renewable Energy Sources” March 2012
[5] Akagi, H., Sato, H., "Control and performance of a doubly-fed induction machine intended for a flywheel energy storage system," Power Electronics, IEEE Transactions on, vol.17, no.1, pp.109-116, January 2002.
[6] Chapmann, S., Electric Machinery Fundamentals, McGraw Hill International Edition, Fourth Edition, 2005.
[7] Hirachilabrotory Technology Memo No.20090930 Accessed on October 2010 from http:// hirachi.cocolog-nifty.com/kh/
[8] Jeoung, H., Choi, J., "High efficiency energy conversion and drives of flywheel energy storage system using high temperature superconductive magnetic bearings”, Power Engineering Society Winter Meeting, 2000. IEEE, vol.1, no., pp.517-522, 2000.
[9] Muljadi, E., McKenna, H.E., "Power quality issues in a hybrid power system," Industry Applications, IEEE Transactions on, vol.38, no.3, pp.803-809, May/Jun 2002
[10] Polagye B., Previsic M., EPRI North American tidal in stream power feasibility demonstration project, EPRI-TP-006A, June 10, 2006.
© 2016, IRJET | Impact Factor value: 4.45 | ISO 9001:2008 Certified Journal
| Page 398
[12] Wave Energy Conversion (WEC), University of Michigan College of Engineering. Accessed on October 2008 from http://www.engin.umich.edu/dept/name/research/projects/wave_device/wave_ device.html[13]Mohammad Lutfur Rahman., Lutfur Rahman., Yasuyuki Shirai., “Design and analysis of a prototype HOTT generation system” BUP JOURNAL, Volume 1, Issue 1, September 2012, ISSN: 2219-4851