R E S E A R C H
Open Access
Evolutionary and developmental dynamics
of sex-biased gene expression in common
frogs with proto-Y chromosomes
Wen-Juan Ma
1,2*, Paris Veltsos
1, Roberto Sermier
1, Darren J Parker
1,3and Nicolas Perrin
1Abstract
Background:The patterns of gene expression on highly differentiated sex chromosomes differ drastically from those on autosomes, due to sex-specific patterns of selection and inheritance. As a result, X chromosomes are often enriched in female-biased genes (feminization) and Z chromosomes in male-biased genes (masculinization). However, it is not known how quickly sexualization of gene expression and transcriptional degeneration evolve after sex-chromosome formation. Furthermore, little is known about how sex-biased gene expression varies throughout development. Results:We sample a population of common frogs (Rana temporaria) with limited sex-chromosome differentiation (proto-sex chromosome), leaky genetic sex determination evidenced by the occurrence of XX males, and delayed gonadal development, meaning that XY individuals may first develop ovaries before switching to testes. Using high-throughput RNA sequencing, we investigate the dynamics of gene expression throughout development, spanning from early embryo to froglet stages. Our results show that sex-biased expression affects different genes at different developmental stages and increases during development, reaching highest levels in XX female froglets. Additionally, sex-biased gene expression depends on phenotypic, rather than genotypic sex, with similar expression in XX and XY males; correlates with gene evolutionary rates; and is not localized to the proto-sex chromosome nor near the candidate sex-determining geneDmrt1.
Conclusions:The proto-sex chromosome of common frogs does not show evidence of sexualization of gene expression, nor evidence for a faster rate of evolution. This challenges the notion that sexually antagonistic genes play a central role in the initial stages of sex-chromosome evolution.
Keywords:Sex bias, Gene expression, Evolutionary rate, Sexually antagonistic genes, Development, Sex reversals, Proto-sex chromosome, Sexualization, Transcriptional degeneration, Faster-X effect
Background
Sexual dimorphism is a nearly universal feature of species with separate sexes. Phenotypic differences between the sexes are assumed to reflect past or ongoing sexual con-flicts: trait values that facilitate gene transmission through the male function might impede gene transmission through the female function [1]. Hence, the phenotypic trait values that maximize male fitness might often differ from those that maximize female fitness. Although the genetic bases underlying sexually dimorphic traits are often complex and polygenic [2], they fall into two broad
categories, reflecting two alternative ways of solving sexual conflicts. On one hand, sexual dimorphism may arise from the differential expression of autosomal genes, via, e.g., hormonal control [3–5]. This is the only option available to species with non-genetic sex determination. On the other hand, species with genetic sex determination poten-tially benefit from an alternative option based on sex-chromosome differentiation: as Y sex-chromosomes only occur in males, they may safely accumulate sexually antag-onistic male-beneficial alleles without jeopardizing female fitness. Reciprocally, X chromosomes spend two thirds of their time in females, which selects for female-beneficial alleles (though in the case of differentiated sex chromo-some with silenced Y copies, male-beneficial alleles might segregate on X chromosomes if recessive) [6]. The same * Correspondence:[email protected]
1Department of Ecology and Evolution, University of Lausanne, CH 1015
Lausanne, Switzerland
2Current address: Department of Biology, Amherst College Amherst, MA, USA
Full list of author information is available at the end of the article
holds for female-heterogametic systems, in which W chro-mosomes are female limited, while Z chrochro-mosomes spend two thirds of their time in males and hence are expected to accumulate male-beneficial genes.
Sexually antagonistic genes are hypothesized to play a key role in the evolution of sex chromosomes. In proto-sex chro-mosomes (where X and Y chrochro-mosomes differ only at the sex-determining locus), male-beneficial mutations on the Y may spread even if detrimental to females, because linkage with the sex-determining locus makes them more likely to be transmitted to sons than to daughters. These might be mutations affecting coding sequences or promoter regions, but also DNA methylation or heterochromatinization affect-ing transcriptional activity, such that alleles from one game-tolog (e.g., X) might be upregulated, and those of the other gametolog downregulated. In turn, the accumulation of sexu-ally antagonistic alleles is expected to select for an arrest of XY recombination meaning male-beneficial alleles will then be only transmitted to sons (and female-beneficial alleles to daughters), thereby suppressing recombination load [7]. As a side consequence, however, recombination arrest will also trigger the accumulation of deleterious mutations on the Y chromosome due to reduced purifying selection and in-creased strength of genetic drift stemming from their low ef-fective population size (approximately one fourth that of autosomes). Over time, loss-of-function mutations may accu-mulate in Y-linked genes, resulting in the degeneration of non-recombining segments of Y chromosomes [8–10]. Thus, while the sex-biased expression of autosomal genes is thought to result from sexual conflict alone, sbiased ex-pression of sex-linked genes potentially arises from a com-bination of sexualization and decay [11].
So far, the sex-biased expression of autosomal and sex-linked genes has mostly been investigated in species with highly differentiated sex chromosomes, using model organisms such as mammals, birds, or insects [4,12–16], and with a focus on adult tissues (so that little is known about the dynamics of sex-biased gene expression throughout development) [3, 17, 18]. One general out-come of such studies is that X chromosomes are often enriched in female-biased genes (i.e., feminized) and Z chromosomes in male-biased genes (i.e., masculinized), as expected from their preferential occurrence in females and males respectively (reviewed in [19]). Another com-mon pattern in adult gonad tissues shown by sex-biased genes, regardless of their genomic locations, is that more genes are biased towards male expression than towards fe-male expression [3, 20–23]. Furthermore, male-biased genes consistently show greater between-species diver-gence than female-biased and unbiased genes, at both gene expression and coding sequence levels [3,17]. These patterns suggest that the evolution of sex-biased genes is largely driven by selection on males, most likely stemming from sexual selection and sexual conflict, which are
typically stronger in males [21,24]. In addition, sex-linked genes also often show a rapid evolutionary rate (so-called faster-X or faster-Z effect), which likely stems from both the lower effective population size of sex chromosomes and the exposure to selection of hemizygous genes in the heterogametic sex.
It is not clear, however, how fast gene expression of sex-linked genes becomes sexualized (e.g., feminization of X or masculinization of Z chromosomes) and how quickly signatures of selection can be detected follow-ing the birth of sex chromosomes [25–27]. This requires the study of gene expression and coding se-quence diversity from sex chromosomes at multiple dif-ferentiation stages. In this context, the European common frog (Rana temporaria) is an ideal species, be-cause it is polymorphic for sex-chromosome differenti-ation [28]. At one extreme are populations, found at high latitudes or altitudes, with differentiated X and Y chromosomes (evidenced by Y-specific alleles fixed at series of genetic markers along the whole sex chromo-some genetic map), associated with strictly genetic sex determination (GSD) [28,29]. At the other extreme are populations, found under mild climatic conditions, with undifferentiated XX chromosomes and non-genetic sex determination (non-GSD) [30]. Populations at inter-mediate climatic conditions contain a mix of XY males (with differentiated sex chromosomes), XX males (with undifferentiated sex chromosomes, genetically similar to XX females), and/or XY° males (with proto-Y chro-mosomes, only differentiated at a small genomic region
around the candidate sex-determining gene Dmrt1)
[31–33], together with rare sex-reversed XY or XY° fe-males [32, 33]. Sex determination in these populations is under partial genetic control (“leaky GSD”): XX indi-viduals tend to develop into females, but also have a significant probability of developing into sex-reversed XX males; XY individuals most often develop as males, but also have a low probability of developing into sex-reversed XY females. Sex-chromosome recombin-ation in these rare XY females produces XY° sons with proto-sex chromosomes [31,34].
“semi-differentiated sex race” present an intermediate situation: a majority of juveniles have ovaries at metamor-phosis, but a few already have testes, and some others an intermediate condition (ongoing transition from ovaries to testes) [35,36].
Here we focus on one such population from the semi-differentiated sex race comprising a majority of XY° males together with a few sex-reversed XX males. Through RNAseq analyses of different families and developmental stages, we ask the following questions: (i) Do sex chromo-somes at an early stage of evolution show signs of differen-tiation, such as altered expression of Y gametologs or signatures of increased selection (i.e., faster-X effect)? (ii) Has transcriptional sexualization already started, i.e., are proto-sex chromosomes already enriched in sex-biased genes compared to autosomes? (iii) Does sex bias in gene expression (whether sex-linked or autosomal) depend on genotypic or on phenotypic sex, and do sex-biased genes display faster rates of evolution? (iv) How does sex bias change along developmental stages, and in particular, do these patterns reflect the complex developmental pathways documented from the semi-differentiated sex race (namely, direct versus indirect development of testes)?
Results
Genotypic and phenotypic sexes
Analysis of field-sampled adults with Dmrt markers and sex-linked microsatellites revealed that all 24 females were XX, 26 males out of 28 were XY°, and two were XX (Additional file1). The population under study can there-fore be assigned to the semi-differentiated sex race, with a majority of males presenting proto-sex chromosomes and a small proportion of sex-reversed XX males. The parents of the six collected families comprised six XY° fathers and six XX mothers.Dmrtanalysis of their progeny sampled for RNAseq analyses revealed three to seven XX and XY° individuals respectively at each stage, for a total of 46 sam-ples. The phenotypic sexing of stages G43 and G46 estab-lished a reasonably good, but (as expected) imperfect correlation between phenotypic and genotypic sex: five XY° individuals still had ovaries at stage G43 (being ex-pected to develop testes at a later stage) and one XX indi-vidual had testes at stage G46 (being thus expected to develop as a functional sex-reversed XX male). In the fol-lowing analyses, we will contrast the gene expression of XX versus XY° individuals at the three early stages (as phenotypic sexes are undefined), while for later stages (G43 and G46), we will compare gene expression in refer-ence to both genotypic and phenotypic sex (namely XX fe-males, XY° fe-males, XY° with ovaries, and XX with testes).
Transcriptome sequencing and assembly
A total of 558,745 transcripts were assembled, of which 272,330 corresponded to unique genes, the others being
splicing variants. De novo transcriptome assemblies typic-ally consist of more contigs than can possibly be consid-ered real, even when alternative splicing is taken into account [14]. After quality control to exclude transcripts with low expression or that had high similarity to other transcripts, a reference transcriptome containing 67,288 transcripts was produced for use in the expression ana-lyses. BUSCO v2 [38] identified ~ 80% complete and < 3% fragmented single-copy tetrapod orthologs (n= 3950, C: 79.8% [S: 78.6%, D: 1.2%], F: 2.6%, M: 17.6%). Approxi-mately 85.7% of the trimmed reads could be mapped to the reference transcriptome using Bowtie2 v2.3.1 [39].
Sex-biased gene expression throughout development
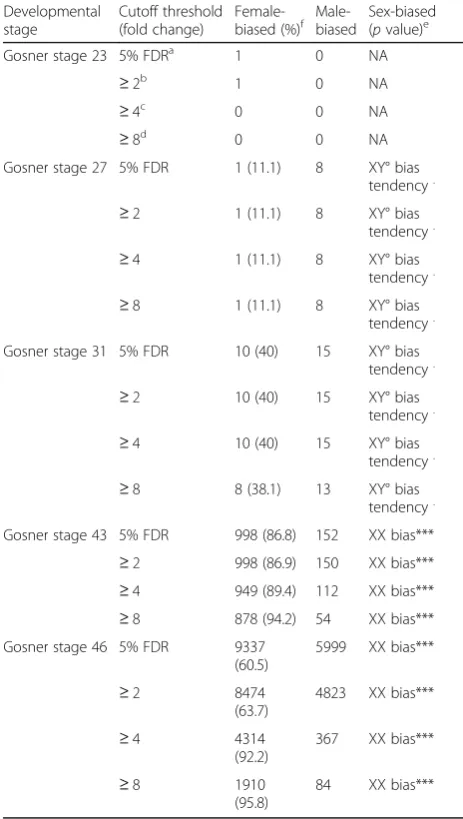
After multiple-test correction (FDR = 0.05), 16,246 tran-scripts (24%) were significantly sex-biased in expression in at least one of the five developmental stages, of which 14,480 (21.5% of total) also had a |log2FC| (absolute value of log2fold change difference)≥1 (Table1). The extent of sex bias increased drastically throughout development (Fig.1). At early stages (G23 to G31), very few genes were sex biased, with no significant differences between the numbers of female- and male-biased genes (Table1). One transcript had sex-biased expression at stage G23 (undif-ferentiated stage), eight at stage G27 (corresponding to the initiation of gonad development [40]), and 25 at stage G31 (when gonad differentiation becomes identifiable his-tologically [40, 41]). Sex bias increased strongly at the metamorph stage G43 (1148 genes with a ≥2-fold differ-ence between XY° males and XX females) and even more so at the froglet stage G46 (13,297 genes with a≥2-fold difference). At stages G43 and G46, many more genes were female biased (higher expression in XX females) than male biased (higher expression in XY° males), particu-larly those with stronger bias (|log2FC| ≥2 and ≥3; Fig. 1). There was little overlap between stages in the identity of sex-biased genes, with few differences from random expectation (SuperExactTest, p> 0.1 in most cases; Additional file 2), suggesting a rapid turnover among stages. No single gene was sex-biased across all five stages, and only 3.4% of XX-biased genes (323 out of 9680) and 1.4% of XY°-biased genes (88 out of 6217) were shared between at least two developmental stages (|log2FC|≥1, Additional file 3: Figure S1a, b), most of which were between stages G43 and G46. Still, 79.1% of sex-biased genes identified at stage G46 (11,959 out of
15,125) were unbiased at stage G43 (|log2FC|≥1,
Additional file3: Figure S1c).
Genomic locations of sex-biased genes
orthologs (see details in the“Methods”section). A total of 10,756 X. tropicalis orthologs could be identified with one-to-one reciprocal best BLAST hit, with no sig-nificant bias among chromosomes (except for a slight deficit on chromosome 9; Additional file 4: Table S1). Among these were 20.0% of the genes upregulated in XY° males (993 out of 4973) versus 40.8% of the genes upregulated in XX females (3856 out of 9472) in at least one developmental stage (FDR < 0.05), a highly significant difference (χ2= 330.0, p< 2.2e−16). As only
one ortholog could be detected among the genes that were sex-biased at early stages (G23 to G31), the gen-omic localization of sex-biased genes was only analyzed for stages G43 and G46 (with respectively 207 and 4642 orthologs identified).
The only distinctive feature of sex chromosomes was a slight deficit at stage G46 in genes biased for XY° males (among the sex-biased ones), as compared to autosomes: 17.1% (122 out of 714) of the sex-biased genes on sex chromosomes were male biased, versus 21.5% (846 out of 3928) on autosomes (χ2= 4.66, p= 0.03). No such deficit occurred at stage G43, with six male-biased genes out of 25 sex-biased on sex chromosomes versus three out of 182 on autosomes (χ2= 0.19, p= 0.67). On all other ac-counts, sex chromosomes did not differ from auto-somes. (i) The proportion of sex-biased genes did not differ between sex chromosomes and autosomes, both at G43, with 2.8% (39 out of 1418 orthologs) on sex chromosomes versus 2.1% (168 out of 8047) on auto-somes (χ2 test, p= 0.14), and at G46, with 35.3% (714 out of 2025) on sex chromosomes versus 34.6% (3928 out of 11,347) on autosomes (χ2 test, p= 0.54). (ii) Over all the orthologs found, the ratio of XY° male to XX female expression did not differ between sex chro-mosomes and autosomes, at both G43 (Wilcoxon test,
W= 4,161,700; p= 0.11) and G46 stages (Wilcoxon
test, W= 41,981,000; p= 0.53; Additional file3: Figure S2a, b). Furthermore, we did not detect an increase in bias around the sex-determination region (Additional file3: Figure S3a, b). (iii) The same result was found when the analysis was restricted to significantly sex-biased genes: the ratio of XY° male to XX female expression did not differ between sex chromosome and autosomes,
both for genes upregulated in XY° males (G43: W =
59, p= 0.98; G46: W= 110,760, p= 0.54) and those upregulated in XX females (G43: W= 2837, p= 0.17; G46: W= 1,207,300, p= 0.53, Fig.2; Additional file 3: Figure S4a, b, c), and no pattern was found either along the sex chromosome at both stages (Additional file 3: Figure S5a–d).
Differential expression of X and Y° genes and phenotypic vs genotypic sex
[image:4.595.55.287.122.532.2]Our study system offers a unique opportunity to test whether sex-chromosome differentiation (XY° versus XX) affects gene expression independent of any phenotypic sex effect. To address this, we first analyzed the total gene ex-pression profile using multiple dimensional scale analysis, which showed a grouping of XX male with XY° males, clearly separated from the XX female group (Additional file3: Figure S6). We then compared gene expression at G46 be-tween the XX male and either the three XY° males or the three XX females. Only 41 genes (0.06%) differed signifi-cantly in expression level between the XX male and the XY° Table 1Different fold change cutoff threshold of sex-biased
gene expression along five developmental stages in Rana temporaria Developmental stage Cutoff threshold (fold change)
Female-biased (%)f Male-biased Sex-biased(pvalue)e
Gosner stage 23 5% FDRa 1 0 NA
≥2b 1 0 NA
≥4c 0 0 NA
≥8d 0 0 NA
Gosner stage 27 5% FDR 1 (11.1) 8 XY° bias tendency.
≥2 1 (11.1) 8 XY° bias
tendency.
≥4 1 (11.1) 8 XY° bias
tendency.
≥8 1 (11.1) 8 XY° bias
tendency.
Gosner stage 31 5% FDR 10 (40) 15 XY° bias tendency.
≥2 10 (40) 15 XY° bias
tendency.
≥4 10 (40) 15 XY° bias
tendency.
≥8 8 (38.1) 13 XY° bias
tendency.
Gosner stage 43 5% FDR 998 (86.8) 152 XX bias*** ≥2 998 (86.9) 150 XX bias*** ≥4 949 (89.4) 112 XX bias*** ≥8 878 (94.2) 54 XX bias*** Gosner stage 46 5% FDR 9337
(60.5)
5999 XX bias***
≥2 8474
(63.7)
4823 XX bias***
≥4 4314
(92.2)
367 XX bias***
≥8 1910
(95.8)
84 XX bias***
a
Based on FDR correction for multiple testing. XY°-biased: log2(m/f) > 0,
XX-biased: log2(m/f) < 0 b
XY°-biased: log2(m/f)≥1, XX-biased: log2(m/f)≤ −1 c
XY°-biased: log2(m/f)≥2, XX-biased: log2(m/f)≤ −2 d
XY°-biased: log2(m/f)≥3, XX-biased: log2(m/f)≤ −3 e
Significance codes are 0.001‘***’, 0.1‘.’
f
Fig. 1Sex bias in gene expression across developmental stages inRana temporaria. The number of genes with significant sex bias (corrected for multiple testing) increases drastically in the late developmental stages (G43 and G46), corresponding to the morphological differentiation of gonads. At these stages, female-biased genes (reddish) significantly outnumber male-biased genes (blueish), mostly for the highly biased categories (|log2FC|≥2 and≥3). Drawings of frog tadpoles and larvae are reprinted from [80], with permission of the editors
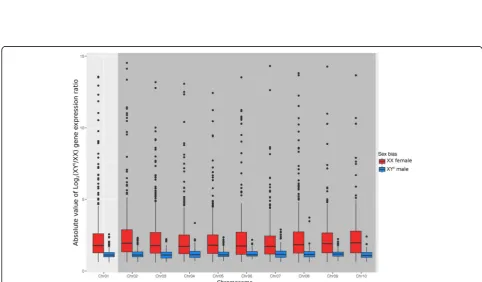
[image:5.595.58.539.87.356.2] [image:5.595.55.538.418.700.2]males (two of which had anX. tropicalisortholog, on chro-mosomes 2 and 7 respectively), as opposed to 8739 genes between this XX male and the three XX females. Further-more, the vast majority of identified sex-biased genes in the contrast between XX females and the XX male (female bias, 6433 out of 6473; male bias, 2283 out of 2285) overlapped with the identified sex-biased genes in the contrast between XX females and XY° males (Additional file3: Figure S7a, b). In addition, we found no difference between autosomes and sex chromosomes in the ratio of XY° to XX male expression (W= 5,163,700;p= 0.10), and this ratio did not vary along the sex chromosome (Fig.3a,b). Overall, we found no evi-dence for a differential gene expression between X and Y° chromosomes.
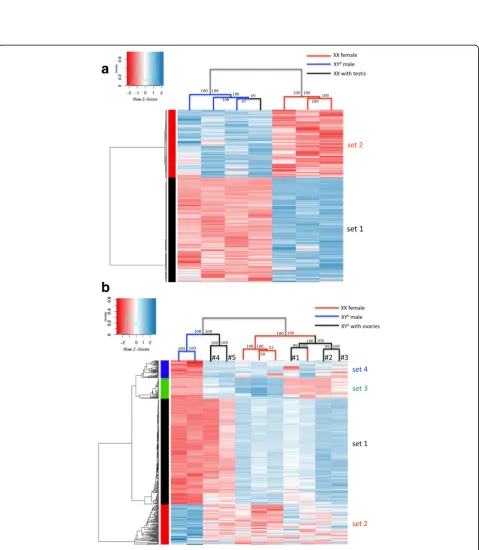
This finding was consistent with heatmap and hierarch-ical clustering analysis performed on differentially expressed genes (FDR < 0.05) of these seven G46 individ-uals. Individuals were contrasted either by phenotypic sex (four males vs three females; Fig. 4a) or by genotypic sex (three XY° vs four XX; Additional file 3: Figure S8). In both cases, individuals cluster into the same two well-sep-arated groups (i.e., independent of the imposed partition-ing), comprising respectively the four phenotypic males and the three phenotypic females. In both cases, sex-biased genes also cluster into two well-separated sets: a larger one (set 1) comprising genes upregulated in phenotypic females and a smaller one (set 2) with genes upregulated in phenotypic males. Hence, the patterns of gene expression clearly covary with phenotypic sex, not with genotypic sex (i.e., the XX with testes clusters with XY° males, not with XX females).
A similar analysis at stage G43 (metamorphs) provides more complex results (Fig. 4b). Eleven individuals were analyzed: two XY° males, five XY° individuals with ovaries (expected to develop later into males), and four XX indi-viduals with ovaries (some of which might later develop as males). The two XY° males and four XX females cluster into two well-differentiated groups. By contrast, XY° indi-viduals with ovaries fall into two categories: two of them (#4 and #5 in Fig. 4b) cluster with XY° males and three (#1, #2, and #3 in Fig.4b) with XX females. Differentially expressed genes can be categorized into four sets: the lar-gest one (set 1) is responsible for the differentiation be-tween the two main clusters of individuals, being upregulated in the cluster with (normal) XX females, and downregulated in the cluster with (normal) XY° males. Two other gene sets mostly differentiate the two XY° males, being respectively upregulated (set 2) or downregu-lated (set 4) in these two individuals. Finally, the fourth set (set 3) shows upregulation in three of the four XX females and two XY° individuals with ovaries and downregulation in all others. Thus, XY° with ovaries form a heterogeneous category: those clustering with XY° males show the same low-level expression for gene set 1 (largest set) but are
otherwise similar to XX females. The XY° with ovaries clustering with XX females have an overall female-like ex-pression profile, except for gene set 3, where they have the same low expression profile as males. Finally, one XX in-dividual clusters with this latter group (XY° with ovaries), possibly suggesting a future development towards a male phenotype. Gene ontology (GO) analysis of these four sets of genes (Additional file 4: Table S2) shows that set 1 is enriched in genes with reproductive and immune func-tions, while the other three sets of genes involve no reproduction-related function or association to specific pathways of sexual development. This complex situation might represent different developmental stages in the dif-ferentiation process of male phenotypes, and possibly dis-tinct pathways towards maleness.
Divergence of sex-biased and sex-linked genes
We combined data on sex bias from all stages by com-paring a set comprised of genes that were XX- or XY °-biased in any stage with the genes that were never sex biased at any stage. In this comparison, the aver-age ratio of non-synonymous to synonymous substitu-tions (dN/dS) differed neither between XX- and XY °-biased genes (Wilcoxon test, W= 890,990; p= 0.40) nor between unbiased and XY°-biased genes (W= 1,656,900;
p= 0.61). The difference was marginally significant between unbiased and XX-biased genes (W= 2,692,000; p= 0.09). However, stage-specific analyses revealed larger differences, some of them highly significant after correction for multiple testing. At stage G43, unbiased genes had sig-nificantly lower dN/dS ratios than those biased for ei-ther XX females (W= 25,589;p= 1.3e−05) or XY° males (W= 4710; p= 0.0002) (Fig. 5). At stage G46, unbiased genes also had significantly lower dN/dS ratios than those biased for XX females (W= 1,320,400, p= 0.04; Fig.5), but not significantly lower than those biased for XY° males (W= 823,710, p= 0.40). When the analysis was restricted to sex-biased and unbiased genes that were shared between stages G43 and G46, genes biased for either XX females or XY° males showed significantly higher dN/dS ratios than unbiased genes (Wilcoxon test: XX-biased, W= 23,424, p= 5.2e−05; XY°-biased,
a
b
[image:7.595.59.540.80.689.2](See figure on previous page.)
Fig. 3XX and XY° male froglets (G46) show similar patterns of gene expression, withano specific signature of sex chromosomes (Chr01, red, left) relative to ausosomes (boxplots of Log2(XY°/XX) gene expression ratio) andbno difference around the sex-determining region (Manhattan
plot of log2(XY°/XX) gene expression ratio along the sex chromosome, with a sliding window of 40 genes;Dmrt1position marked by the blue
dotted line)
a
b
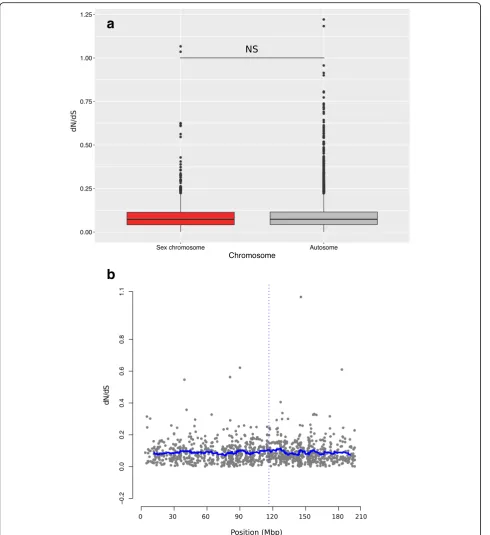
[image:8.595.59.539.147.698.2]Genes on the sex chromosome (1110 orthologs) did not differ from autosomal genes (5517 orthologs) in terms of dN/dS ratio (Wilcoxon test: W= 4,191,400; p
= 0.29, Fig. 6a). Similarly, there was no deviation from the meandN/dSratio scans with sliding windows of 40 genes along the sex chromosome, including in the re-gion surrounding the candidate sex determining gene
Dmrt1(Fig.6b, Additional file3: Figure S10a, b). Thus, our results provide no evidence for faster-X (or faster sex chromosome) evolution in our system.
Discussion
Our RNAseq analyses of multiple developmental
stages, from one Rana temporaria population with
proto-sex chromosomes, contributes to our under-standing of sex-biased gene expression on three main aspects: (i) the dynamics of sex-biased gene expression across developmental stages, (ii) the signature of selec-tion on sex-biased genes, and (iii) the contribuselec-tion of proto-sex chromosomes in the buildup of sexual
dimorphism throughout development. Below, we dis-cuss these three aspects in turn.
Dynamics of sex-biased gene expression across developmental stages
[image:9.595.60.538.86.433.2][28,35,36], so that genetic sexes might indeed show little differentiation at stage G31. It would be worth expanding our gene expression analyses to populations from the dif-ferentiated sex race for comparison. Few studies have ad-dressed sex-biased gene expression in vertebrates at early
embryonic stages, prior to the onset of gonad morpho-logical differentiation. In the rainbow troutOncorhynchus mykiss (which also has homomorphic XY sex chromo-somes), a larger proportion (8.7%) of genes had sex-biased expression prior to morphological gonad differentiation,
a
b
Fig. 6The ratios of non-synonymous to synonymous substitutionsdN/dSado not differ between sex chromosomes (red) and autosomes andb
show no special pattern around the sex-determining region (the horizontal blue line shows the averagedN/dSratio of a sliding window of 40 genes;
[image:10.595.57.548.86.622.2]though most of them were not related to sexual function [44,45]. This might indicate an earlier gonadal differenti-ation in trout but might also stem from differences in methodologies (microarrays versus RNAseq) and sex-bias calling criteria (FDR < 0.2 for the rainbow trout, compared to FDR < 0.05 and |log2FC|≥1 in our study).
The drastic increase in the number of sex-biased genes at G43 (1.7%) and G46 (20%) coincides with the morpho-logical differentiation of gonads: two out of seven XY° in-dividuals already had developed testes at G43, and all of them by G46. Our results are consistent with studies of other vertebrates at similar stages of differentiation: in the clawed frog Xenopus tropicalis, 1% of genes (588 out of 59,021) were male-biased, and 1.8% (1079 out of 59,021) female-biased by the end of metamorphosis [46]. In chick-ens, ~ 21% of genes show sex-biased expression (FDR = 0.1) at stages where gonads become morphologically dif-ferentiated [4]. Adult stages in vertebrates typically present the strongest sex bias in gene expression (e.g., up to 38% in adult zebra fish [21] and up to 71% in mice [47]). Invertebrates, by contrast, seem to present high de-grees of sex bias already at earlier stages: in Drosophila, for instance, > 50% of expressed genes at the late larval and pupal stages show moderate to high sex differences [2], similar to the proportions found in adults (50% on average, up to 88% [48,49]). The earlier expression of sex-ual dimorphism in invertebrates probably reflects onto-genetic differences with vertebrates, where gonadal ridges first develop as bipotential sex organs, before switching to either testes or ovaries [40,41]. In contrast, many inverte-brates start sexual differentiation soon after fertilization (e.g., Nasonia wasps [50]). In holometabolous insects, strong sex bias is expected during metamorphosis occur-ring at the pupal stage, when the body is entirely restruc-tured into male or female adults [18].
We also detected very little overlap of sex-biased genes between stages suggesting a rapid turnover during devel-opment, a situation similar to that found in chickens [4] and rainbow trout [45]. This contrasts again with Dros-ophilawhere most sex-biased genes are consistent across larval and pupal stages [2]. It is tempting to also interpret this contrast in the context of differences in the patterns of sexual differentiation between vertebrates and inverte-brates (though this remains largely speculative, given the limited number of studies available for comparison).
The few sex-biased genes at the pre-metamorph stages showed a trend towards XY°-biased expression (8 out of 9 at G27, 15 out of 25 at G31), which differs from the rain-bow trout data, where equal numbers of male- and fe-male-biased genes were reported during early embryonic stages [45]. At later stages (G43 and G46), however, sex bias was strongly and significantly skewed towards XX females, both in terms of gene numbers and expression ratios. This is in line with data fromX. tropicalis, which
showed consistent female bias in gene expression during metamorphosis [46], as well as from chickens, with dom-inantly female-biased gene expression during the morpho-logical differentiation of gonads [4]. The same occurs in the Drosophilalarval and pre-pupal stages, during which gonads already show morphological differentiation [2]. Taken together, these studies suggest that female bias in gene expression seems dominant during the morpho-logical differentiation of gonads, although the directions of bias prior to this morphological differentiation may vary across species. This consistency across studies and taxa in the amount, direction, and timing of sex bias also suggests that our use of whole body (rather than gonads) for RNAseq analyses, associated with stringent criteria when calling sex-biased genes, had no major effect on conclusions. The drastic increase in sex bias at stages G43 to G46 is likely to reflect the patterns of gonadal develop-ment, as many GO terms of sex-biased genes at these two stages are related to reproduction. Other GO terms in-cluded sex steroids at stage G46 (Additional file5), which have also been detected in the brain tissue or whole body of other frog species at pre-metamorphosis, during meta-morphosis, and towards adulthood (e.g., Rana pipiens,
Xenopus tropicalis, andPhysalaemus pustulosus[51–53]). Our study population belongs to the semi-differentiated sex race, in which some XY° individuals first develop ovar-ies, which are replaced by testes by the froglet stage, to re-sult in adult phenotypic males. At G43, the two XY° males had patterns of gene expression well differentiated from the four XX females. In contrast, the five XY° individuals still with ovaries at G43 did not constitute a homogeneous gene expression group. Two of them were more similar to the XY° males: they had the same low expression levels at gene set 1 (enriched in genes with reproductive and im-mune functions, Fig.4b), but were otherwise similar to fe-males. The three remaining individuals clustered with XX females, displaying an overall female-like expression pro-file, except for gene set 3 where they had the same low ex-pression profile as males. This suggests either different steps in the process of transition towards the male pheno-type or possibly different pathways towards fully differen-tiated male phenotypes. It would also be worth comparing these patterns with data from the differentiated sex race, where we predict an earlier, more homogeneous, and better-canalized transition to maleness.
Signatures of selection on sex-biased genes
since sex-biased genes consistently show elevated dN/dS
ratio compared to unbiased genes in stage-specific com-parisons (Fig. 5). This consistent signature of selection across stages towards increased evolutionary rate for sex-biased genes differs from the situation found in chick-ens, where patterns of divergence of sex-biased genes var-ied across stages [4]. Interestingly, when calling sex bias between XY° males and XY° individuals with ovaries at G43, we found that genes biased for XY°“females”had a higher rate of evolution than unbiased genes (Add-itional file3: Figure S9b). Furthermore, using one XX male to call sex bias at G46, we found that XX female-biased genes evolved marginally slower than XX male-biased genes at G46 (Additional file3: Figure S9c). These results
suggest that sexual selection acts on sex-biased
genes based on phenotypic rather than genotypic sex. In support, we found the vast majority of sex-biased genes are shared when contrasting XX females or XY° females with XY° males (202 out of 203; Additional file3: Figure S11), and a majority of female-biased (6433 out of 6473) and male-biased (2283 out of 2285) genes when contrast-ing XX females with either the XX or XY° males at G46 (Additional file3: Figure S7a, b).
We also found fewer X. tropicalis orthologs for male-biased genes than for female-male-biased or unmale-biased genes (especially at G46 which had the highest number of male-biased genes). One reason for this might be that a higher proportion of male-biased genes may be too di-verged from X. tropicalisto generate a significant BLAST hit, meaning they will be underrepresented in the ortholog set. This would make their calculateddN/dSan underesti-mation. Faster male evolution is expected both from stron-ger sexual selection [4,54, 55] and from relaxed purifying selection on males (faster-male effect, reviewed in [3]). Overall, our study unveils clear signatures of sex-specific evolutionary pressures acting on dimorphic traits, at devel-opmental stages in which gonads show morphological dif-ferentiation. This implies that the genes identified here as sex biased have been involved in sexual dimorphism over evolutionary times long enough for sex-selective pressures to translate into higherdN/dSratios.
Sexualization of proto-sex chromosomes
Unlike studies of organisms with differentiated sex chromosomes (reviewed by [3]), we found no clear evi-dence for sexualization of the proto-sex chromosomes inR. temporaria, even at developmental stages that dis-play strong sex bias in gene expression. (i) Sex-biased genes were not more common on proto-sex chromo-some than on autochromo-somes, nor around the candidate sex-determining locus compared to the rest of the sex chromosome. Male-biased genes at G46 constituted a lower proportion of sex-biased genes on sex chromo-somes than on autochromo-somes, which might indicate early
feminization. However, the effect was weak and might also result from faster evolution of male-biased genes (and hence lower detectability). (ii) There was no differ-ence between sex chromosomes and autosomes in the ratio of male-to-female expression over all identified orthologs. Similarly, there was no difference when ana-lyzing separately the genes with significant male- or female-biased expression, and their distribution was uniform along the sex chromosome. (iii) We found no evidence for faster-X effect, as the dN/dSratio did not differ between sex-linked and autosomal genes, and no specific pattern was found along the sex chromosomes. (iv) We found negligible differences in expression be-tween XX and XY° males at G46: only 0.06% of genes had significantly different expression (with two ortho-logs found on autosomes). The |log2| ratio of XY° to XX expression also did not differ between autosomal and sex-linked orthologs and had uniform distribution along the sex chromosome, suggesting negligible X-Y° differentiation. This is consistent with the results from expression patterns showing that the XX with testes clusters with XY° males, well apart from XX females. Not only does this confirm the absence of degeneration along the proto-Y chromosome, but it also shows that sex differences in expression only depend on pheno-typic sex, not on genopheno-typic sex.
The absence of faster-X effect in our study is consist-ent with the absence of faster-Z effect in the nascconsist-ent sex chromosomes of the basket willow Salix viminalis, which likely represents a more advanced stage of sex-chromosome differentiation than the common frog as it shows evidence for Z-W differentiation and masculinization of Z-expression in the sex-determining region [27]. More studies on organisms with young sex chromosomes at different stages in their evolution are needed to fully specify the sequential steps of differenti-ation that accompany the birth of sex chromosomes.
Conclusions
Methods
Field sampling and rearing conditions
Six mating pairs in amplexus, as well as 18 females and 22 males, were caught during the 2015 breeding season in the southern Swedish breeding pond of Stensma (55°50′51.83″ N, 13°55′24.83″E), 48 km northeast of the previously stud-ied population of Tvedöra [28,31]. The single adults were sampled for buccal cells with sterile cotton swabs and im-mediately released at the place of capture. The six mating pairs were left overnight in 11-l plastic tanks to lay their clutch. On the next day, they were similarly sampled for buccal cells and released at the place of capture. The six clutches were brought back to the University of Lausanne, and the six families were reared in separate tanks in a cli-matic room at constant conditions (19 °C with 12:12 light to dark cycle), in order to minimize environmental effects on gene expression. Juveniles were first fed fish flakes, then fruit flies, and small crickets after metamorphosis. Two to four offspring from each clutch were sampled at each of five developmental stages [37], namely stages G23, G27, G31, G43 (metamorph; 1.2–1.4 cm snout-vent length), and G46 (froglet; 2.1–2.3 cm snout-vent length), which at our rearing conditions took place respectively 10 days, 12 days, 27 days, 3 months, and 6 months after spawning. These stages represent important points regarding sex determin-ation and differentidetermin-ation [40, 41]: gonadal development is first initiated at stage G27, with histological differentiation visible from stage G31, and morphological differentiation from stage G43 (metamorphosis). At stage G46, the sec-ondary differentiation of males should be mostly achieved, with ovaries entirely replaced by testes ([35]; see Introduc-tion). Sampled juveniles were anesthetized and euthanized in 0.2% ethyl3-aminobenzoate methanesulfonate salt solu-tion (MS222), then immediately plunged in RNAlater (Qia-gen). The tail tip from each tadpole and a toe clip from metamorphs and froglets were cut for genotyping. Sam-ples of the two latter stages (G43 and G46) were dis-sected for phenotypic sex determination (see below), and their digestive tracts (stomach, small intestine, large intestine) were removed to limit contamination of RNA analyses by food remains and microorganisms. Samples in RNAlater were preserved at −20 °C up to 10 months before RNA extraction.
Genotyping
The genotypic sex of single adults and parents was deter-mined based both on fourDmrtmarkers with Y-diagnostic alleles (namelyDmrt1–1,Dmrt1–2, Dmrt1–5, andDmrt3) and on 14 sex-linked anonymous microsatellites (Bfg147,
Rtemp5, RtSB03, Bfg021, Bfg266, RtuB, Bfg093, Bfg191,
Bfg053,Bfg172,Bfg131,Bfg092,Bfg072,Kank1) with alleles diagnostic of fully differentiated Y chromosomes (primer sequences from [28,31]; Additional file1). As none of the parents had a fully differentiated Y chromosome, progenies
were only genotyped with theDmrtmarkers. After an over-night treatment at 56 °C with tissue lysis buffer ATL and 20% proteinase K (Qiagen), PCR reactions were performed in a total volume of 10μl, including 3μl of extracted DNA, 2.22 μl of Milli-Q water, 3μl of Qiagen Multiplex Master Mix, and 0.14 to 0.3μl of labeled forward primer and 0.14 to 0.3μl of unlabeled reverse primer (in total 1.78μl of pri-mer mix). PCRs were conducted on Perkin Elpri-mer 2700 ma-chines using the following thermal profile: 15 min of Hot Start Taq polymerase activation at 95 °C, followed by 35 cy-cles including denaturation at 94 °C for 30 s, annealing at 55 °C for 1.5 min, and elongation at 72 °C for 1 min, ending the PCR with a final elongation of 30 min at 60 °C. PCR products were then analyzed on an automated ABI Prism 3100 sequencer (Applied Biosystems, Foster City, CA, USA), and alleles were scored using GeneMapper v. 4.0 (Applied Biosystems).
Phenotypic sex
The phenotypic sex of G43 and G46 samples was deter-mined based on gonad morphology, following dissection in RNAlater (Qiagen) under a binocular microscope. Ovaries in common frogs develop from the whole gonadal primordia into a large whitish/yellowish structure with distinct lobes and a characteristic granular aspect con-ferred by the many oocytes embedded in the cortex [40]. In contrast, testes develop from the anterior part of the gonadal primordia only (the posterior part degenerates) into a small oblong structure, with a smooth cortex cov-ered with melanic spots [41]. Each individual was scored as phenotypic male, female, or undifferentiated, following the gonad-scoring description in (Additional file1) [31].
RNA extraction and sequencing
phase separation (using chloroform). After ethanol pre-cipitation of the upper phase, RNA was washed with 70% ethanol twice and collected, followed by a DNase diges-tion step. RNA libraries were then prepared and barcoded at the Lausanne Genomic Technologies Facility, Univer-sity of Lausanne, using standard protocols. Six RNA li-braries were multiplexed per lane and were sequenced on an Illumina HiSeq 2500 resulting in, on average, 84.2 mil-lion 100-bp paired-end reads per sample.
De novo transcriptome assembly, mapping, and annotation
RNAseq reads were quality assessed using FastQC v0.11.2 (https://www.bioinformatics.babraham.ac.uk/projects/fastqc/ ) and quality trimmed using Trimmomatic v0.33 with de-fault parameters for paired-end reads [63]. We filtered reads containing adaptor sequences and trimmed reads if the slid-ing window average Phred score over four bases was < 15 or if the leading/trailing bases had a Phred score < 3. Reads were then removed post filtering if either read pair was < 36 bases. In order to include all possible combinations of stage, phenotypic sex, and genotypic sex in the de novo transcrip-tome assembly, we used one XY° and one XX individual per stage, except for stage G43 where two individuals each of XX females, XY° males, and XY° with ovaries were sampled (i.e., 14 samples in total), using Trinity v2.4.0 with default parameters [64]. De novo transcriptome assemblies typically consist of more contigs than can possibly be considered “real,” even when alternative splicing is taken into account [14]. We thus applied a series of filtering steps to reduce the number of erroneous and non-expressed contigs. First, we removed transcripts shorter than 300 bp. We then mapped all the reads from all 46 samples to the most expressed Trin-ity isoform per gene cluster, using Kallisto v0.43.0 [65]. We applied a minimum expression filter of 1 for trimmed mean of the log expression ratios (trimmed mean of M values, TMM; mapping results from Kallisto output). Haplotype merging was then applied based on 90% transcript identity using cd-hit v4.6.1 (cd-hit-est for DNAs clustering, http:// weizhongli-lab.org/cd-hit/). Finally, we removed mapped ERCC internal control and ribosomal rRNA transcripts. After filtering, 67,288 transcripts remained. We used BUSCO v2 [38] with the tetrapoda database to assess the completeness of the filtered transcriptome and Bowtie2 [39] to evaluate the percentage of the total reads which could be mapped to the assembled transcriptome. The transcriptome and gene ontology were annotated using Trinotate v3.0.2 (https://trinotate.github.io), using default parameters.
Sex-biased gene expression analysis
To quantify gene expression, we mapped the trimmed reads of all 46 samples to the filtered assembled transcrip-tome with Kallisto v.0.43.0 [65]. Read counts of the output from Kallisto mapping were imported for gene expression
analysis in EdgeR v3.4 [66,67]. We filtered the low counts and kept genes with average Loge(CPM) > 0 per sample and CPM > 1 in at least half of the samples for each gen-etic sex per developmental stage. We then normalized the expression by trimmed mean ofMvalues (TMM). We ex-plored the libraries per stage in two dimensions using multi-dimensional scaling (MDS) plots (Additional file3: Figure S12a, b, c, d, Figure S6). Normalized expression counts for each sample were used to calculate sex bias using standard measures. We first identified sex-biased genes based on overall expression of each comparison group and using Benjamini-Hochberg correction for mul-tiple testing with false discovery rate (FDR) of 5%. We identified sex-biased genes for each developmental stage separately. Sex bias was classified into four categories of fold changes, namely 2 (low), 2–4 (mild), 4–8 (high), and > 8 (very high), and expressed as log2ratio of male-to-fe-male expression (which has negative values for to-fe-male- female-biased genes and positive values for male-female-biased genes). As suggested by [68], only fold changes≥2 will be inter-preted throughout, in order to minimize possible scaling issues due to whole-body sampling (ovaries are slightly larger than testes, which may potentially lead to bias in calling sex-biased gene expression). Thus, unless stated otherwise, both conditions FDR < 0.05 and |log2FC| ≥1 will have to be met when calling sex bias. The sex-biased genes at stages G43 and G46 were defined after excluding the sex-reversed individuals (only XX females and XY° males were used) to eliminate possible noise induced by sex reversals, unless otherwise stated.
Hierarchical clustering and heatmaps
Hierarchical clustering was performed using distance matrix (Euclidean clustering method) with the R pack-age dynamicTreeCut [69], using complete linkage in the R package pvclust [70], with bootstrap resampling (10,000 replicates). Differentially expressed genes were identified based on log2 of XY°-male-to-XX-female ex-pression (with a FDR threshold of 0.05). Heatmaps were generated separately for G43 and G46, and expression values (logCPM) for each differentially expressed gene (per row) were plotted using the heatmap.2 function in the R package gplots (R v3.4.0).
Gene ontology
resulting from Fisher’s exact tests that account for GO term topology (with topGO algorithm“weight01”).
Sequence divergence of sex-biased and sex-linked genes
Candidate coding regions within transcript sequences were identified from the transcriptome using TransDecoder v2.0.1 (https://github.com/TransDecoder/TransDecoder). If multiple open reading frames (ORFs) were detected for a transcript, we used the longest one. This resulted in 28,222 ORFs in total. Coding DNS sequence (CDS) of Xenopus tropicaliswere downloaded from XenBase ( http://www.xen-base.org/other/static/ftpDatafiles.jsp). Given the strong chromosome-level gene synteny betweenR. temporariaand
X. tropicalis[42,43], we performed a reciprocal best BLAST of coding sequences between the two species (custom perl script, protein sequence comparison with an e-value cutoff of 1e−10 and minimum percentage identity of 30% [26]) to identify orthologs and assign the location of each transcript on the genome. In total, 10,756 reciprocal 1:1 orthologs were identified across the genome.
Reciprocal orthologs were aligned with PRANK
(v140603) using the codon model [72]. Each alignment was then analyzed with codeml in PAML [73] (runmode
−2) to calculate the number of nonsynonymous substitu-tions per nonsynonymous site (dN), the number of syn-onymous substitutions per synsyn-onymous site (dS), and the ratio of the two (dN/dS). As mutational saturation and double hits can lead to inaccurate divergence estimates [74], orthologs were excluded ifdS> 2. We then compared
dN/dS ratio among female-biased, male-biased, and unbiased genes at each developmental stage. To assess the differences of dN/dS ratios between sex-biased and unbiased genes, as well as between female-biased and male-biased genes, datasets were compared using a non-parametric Wilcoxon test for each developmental stage when applicable. To compare the differences between each two groups, multiple comparisons among groups were done using the Tukey test as implemented in the R function package for general linear hypothesis [75]. Simi-larly, to assess possible faster-X effects, we compareddN/ dS ratio of orthologs from sex chromosome and auto-somes. We compared the differences between the two groups with a Wilcoxon test. All statistics were performed in R v3.4.0 [76].
Assessing transcriptional degeneration of proto-Y chromosome
To investigate possible transcriptional degeneration of the proto-Y chromosome, we used a Wilcoxon test to compare the expression of all genes on sex chromo-some and autochromo-somes between XY° and XX males at stage G46 (log2(XY°/XX)).
Sliding window analysis
Moving averages of gene expression ratios/sequence diver-gence were calculated in R v3.4.0 [76], based on sliding window analysis using the Rollapply function in the Zoo R package. Window size was 40 genes at G46 [77] but 20 genes at G43 due to the lower number of sex-biased genes (Additional file3: Figure S5a, b).
Additional files
Additional file 1:All LG2 marker andDmrt1genotype of adults and progeny samples used in RNAseq analysis. (XLSX 32 kb)
Additional file 2:Results of SuperExactTest for shared XY0-biased genes.
(XLS 41 kb)
Additional file 3:All supplementary figures. (PDF 3566 kb)
Additional file 4:Table S1.Genomic location distributions of one-to-one ortholog of reciprocal best BLAST hit betweenR. temporariaandX. tropicalis. *Ratio betweenR. temporariaortholog number and the number ofX. tropicalisgene number per chromosome.Table S2.GO enrichment analysis for differentially expressed gene clustering groups at stage G43. GO depicts three complementary biological concepts including biological process (BP), molecular function (MF), and cellular component (CC). (DOC 98 kb)
Additional file 5:GO term and Fisher’s exact test for significance at each developmental stage. (XLSX 60 kb)
Abbreviations
G23, G27, G31, G43, G46:Gosner stages 23, 27, 31, 43, and 46; FDR: False discovery rate; GO: Gene ontology;Dmrt1: Doublesex and mab-3 related transcription factor 1 gene; BLAST: Basic local alignment search tool; CDS: Coding DNA sequences; TMM: Trimmed mean ofMvalues; CPM: Count per million
Acknowledgements
Nicolas Rodrigues and Melissa Toups collected the clutches. N. Rodrigues genotyped sampled adults for sex-linked microsatellites. M. Toups made critical comments on an early version of the manuscript. Jason Buser and Julien Leuenberger helped in the rearing of froglets. We also thank the three anonymous reviewers for the constructive comments. The computations were performed at the Vital-IT (http://www.vital-it.ch) Center for high-performance computing of the SIB Swiss Institute of Bioinformatics.
Funding
This work was supported by the Swiss National Science Foundation (grants 31003A_166323 to NP and Sinergia grant CRSII3_147625 to NP, John Pannell, and Mark Kirkpatrick).
Availability of data and materials
The raw reads were deposited in NCBI Sequence Read Archive (SRR7140852 - SRR7140897) and transcriptome in NCBI Transcriptome Shotgun Assembly database (GGNS00000000) under the project code BioProject PRJNA464250 [78]. Scripts related to the analysis presented here are archived in Zenodo [79] (GitHub repository:https://github.com/Wen-Juan/Tvedora_dev_RNAseq).
Authors’contributions
W-JM and NP designed the study. W-JM reared the clutches and performed the gonad dissection. RS performed most of the genotyping lab work. RS and W-JM performed the RNA extractions. W-JM, PV, and DJP performed genetic and bioinformatics analyses. W-JM drafted the manuscript, which was improved by NP, PV, and DJP. All authors agreed on the final version of the manuscript.
Ethics approval
Competing interests
The authors declare that they have no competing interests.
Publisher’s Note
Springer Nature remains neutral with regard to jurisdictional claims in published maps and institutional affiliations.
Author details
1
Department of Ecology and Evolution, University of Lausanne, CH 1015 Lausanne, Switzerland.2Current address: Department of Biology, Amherst College Amherst, MA, USA.3Swiss Institute of Bioinformatics, Lausanne, Switzerland.
Received: 7 February 2018 Accepted: 20 September 2018
References
1. Lande R. Sexual dimorphism, sexual selection, and adaptation in polygenic characters. Evolution. 1980;34:292–305.
2. Perry JC, Harrison PW, Mank JE. The ontogeny and evolution of sex-biased gene expression inDrosophila melanogaster. Mol Biol Evol. 2014;31:1206–19. 3. Ellegren H, Parsch J. The evolution of sex-biased genes and sex-biased gene
expression. Nat. Rev. Genet. 2007;8:689–98.
4. Mank JE, Nam K, Brunström B, Ellegren H. Ontogenetic complexity of sexual dimorphism and sex-specific selection. Mol Biol Evol. 2010;27:1570–8. 5. Mank JE, Wedell N, Hosken DJ. Polyandry and sex-specific gene expression.
Phil Trans R Soc B. 2013;368:20120047.
6. Rice WR. Sex chromosomes and the evolution of sexual dimorphism. Evolution. 1984;38:735–42.
7. Charlesworth D. Evolution of recombination rates between sex chromosomes. Phil. Trans. R. Soc. B. 2017;372:20160456.
8. Bachtrog D. Y-chromosome evolution: emerging insights into processes of Y-chromosome degeneration. Nat. Rev. Genet. 2013;14:113–24.
9. Bachtrog D. A dynamic view of sex chromosome evolution. Curr Opin Genet Dev. 2006;16:578–85.
10. Graves JAM. Evolution of vertebrate sex chromosomes and dosage compensation. Nat. Rev. Genet. 2015;17:33–46.
11. Wright AE, Mank JE. The scope and strength of sex-specific selection in genome evolution. J Evol Biol. 2013;26:1841–53.
12. Meisel RP. Towards a more nuanced understanding of the relationship between sex-biased gene expression and rates of protein-coding sequence evolution. Mol Biol Evol. 2011;28:1893–900.
13. Wright AE, Harrison PW, Montgomery SH, Pointer MA, Mank JE. Independent stratum formation on the avian sex chromosomes reveals inter-chromosomal gene conversion and predominance of purifying selection on the W chromosome. Evolution. 2014;68:3281–95. 14. Harrison PW, Wright AE, Zimmer F, Dean R, Montgomery SH, Pointer MA,
Mank JE. Sexual selection drives evolution and rapid turnover of male gene expression. Proc Natl Acad Sci. 2015;112:4393–8.
15. Dean R, Harrison PW, Wright AE, Zimmer F, Mank JE. Positive selection underlies Faster-Z evolution of gene expression in birds. Mol Biol Evol. 2015; 32:2646–56.
16. Vicoso B, Bachtrog D. Numerous transitions of sex chromosomes in Diptera. PLoS Biol. 2015;13:e1002078.
17. Parsch J, Ellegren H. The evolutionary causes and consequences of sex-biased gene expression. Nat Rev Genet. 2013;14:83–7.
18. Ingleby FC, Flis I, Morrow EH. Sex-biased gene expression and sexual conflict throughout development. Cold Spring Harb Perspect Biol. 2015;7:a017632. 19. Mank JE. The W, X, Y and Z of sex-chromosome dosage compensation.
Trends Genet. 2009;25:226–33.
20. Zhang Y, Sturgill D, Parisi M, Kumar S, Oliver B. Constraint and turnover in sex-biased gene expression in the genusDrosophila. Nature. 2007;450:233–7. 21. Small CM, Carney GE, Mo Q, Vannucci M, Jones AG. A microarray analysis of
sex- and gonad-biased gene expression in the zebrafish: evidence for masculinization of the transcriptome. BMC Genomics. 2009;10:579. 22. Zhao M, Zha XF, Liu J, Zhang WJ, He NJ, Cheng DJ, et al. Global expression
profile of silkworm genes from larval to pupal stages: toward a comprehensive understanding of sexual differences. Insect Sci. 2011;18:607–18.
23. Martins MJF, Mota CF, Pearson GA. Sex-biased gene expression in the brown alga Fucus vesiculosus. BMC Genomics. 2013;14:294.
24. Connallon T, Knowles LL. Intergenomic conflict revealed by patterns of sex-biased gene expression. Trends Genet. 2005;21:495–9.
25. Wright AE, Dean R, Zimmer F, Mank JE. How to make a sex chromosome. Nat Commun. 2016;7:12087.
26. Wright AE, Darolti I, Bloch NI, Oostra V, Sandkam B, Buechel SD, et al. Convergent recombination suppression suggests role of sexual selection in guppy sex chromosome formation. Nat Commun. 2017;8:14251. 27. Pucholt P, Wright AE, Conze LL, Mank JE, Berlin S. Recent sex chromosome
divergence despite ancient dioecy in the willowSalix viminalis. Mol Biol Evol. 2017;34:1991–2001.
28. Rodrigues N, Vuille Y, Loman J, Perrin N. Sex-chromosome differentiation and“sex races”in the common frog (Rana temporaria). Proc R Soc B. 2015; 282:20142726.
29. Rodrigues N, Vuille Y, Brelsford A, Merilä J, Perrin N. The genetic contribution to sex determination and number of sex chromosomes vary among populations of common frogs (Rana temporaria). Heredity. 2016;117:25–32.
30. Brelsford A, Rodrigues N, Perrin N. High-density linkage maps fail to detect any genetic component to sex determination in aRana temporariafamily. J Evol Biol. 2016;29:220–5.
31. Ma W-J, Rodrigues N, Sermier R, Brelsford A, Perrin N.Dmrt1polymorphism covaries with sex-determination patterns inRana temporaria. Ecol Evol. 2016;6:5107–17.
32. Rodrigues N, Merilä J, Patrelle C, Perrin N. Geographic variation in sex-chromosome differentiation in the common frog (Rana temporaria). Mol Ecol. 2014;23:3409–18.
33. Rodrigues N, Studer T, Dufresnes C, Ma W-J, Veltsos P, Perrin N.Dmrt1
polymorphism and sex chromosome differentiation inRana temporaria. Mol Ecol. 2017;26:4897–905.
34. Rodrigues N, Studer T, Dufresnes C, Perrin N. Sex-chromosome
recombination in common frogs brings water to the fountain-of-youth. Mol Biol Evol. 2018;35:942–8.
35. Witschi E. Studies on sex differentiation and sex determination in amphibians. III. Rudimentary hermaphroditism and Y chromosome inRana temporaria. J Exp Zool. 1929;54:157–223.
36. Witschi E. Studies on sex differentiation and sex determination in amphibians. IV. The geographical distribution of the sex races of the European grass frog (Rana temporaria,L.). A contribution to the problem of the evolution of sex. J Exp Zool. 1930;56:149–65.
37. Gosner KL. A simplified table for staging anuran embryos and larvae with notes on identification. Herpetologica. 1960;16:183–90.
38. Sima FA, Waterhouse RM, Ioannidis P, Kriventseva EV, Zdobnov EM. BUSCO: assessing genome assembly and annotation completeness with single-copy orthologs. Bioinformatics. 2015;31:3210–2.
39. Langmead B, Salzberg SL. Fast gapped-read alignment with Bowtie 2. Nat Methods. 2012;9:357–9.
40. Ogielska M, Kotusz A. Pattern and rate of ovary differentiation with reference to somatic development in anuran amphibians. J Morphol. 2004;259:41–54. 41. Haczkiewicz K, Ogielska M. Gonadal sex differentiation in frogs: how testes
become shorter than ovaries. Zool Sci. 2013;30:125–34.
42. Brelsford A, Stöck M, Betto-Colliard C, Dubey S, Dufresnes C, Jourdan-Pineau H, et al. Homologous sex chromosomes in three deeply divergent anuran species. Evolution. 2013;67:2434–40.
43. Brelsford A, Dufresnes C, Perrin N. High-density sex-specific linkage maps of a European tree frog (Hyla arborea) identify the sex chromosome without information on offspring sex. Heredity. 2016;116:177–81.
44. Iturra P, Lam N, de la Fuente M, Vergara N, Medrano JF. Characterization of sex chromosomes in rainbow trout and coho salmon using fluorescence in situ hybridization (FISH). Genetica. 2001;111:125–31.
45. Hale MC, Xu P, Scardina J, Wheeler PA, Thorgaard GH, Nichols KM. Differential gene expression in male and female rainbow trout embryos prior to the onset of gross morphological differentiation of the gonads. BMC Genomics. 2011;12:404.
46. Haselman JT, Olmstead AW, Degitz SJ. Global gene expression during early differentiation ofXenopus (Silurana) tropicalisgonad tissues. Gen Comp Endocrinol. 2015;214:103–13.
47. Yang X, Schadt EE, Wang S, Wang H, Arnold AP, Ingram-Drake L, et al. Tissue-specific expression and regulation of sexually dimorphic genes in mice. Genome Res. 2006;16:995–1004.
minimally differentiated from its ancient X chromosome partner. Genome Res. 2017;27:1417–26.
50. Verhulst EC, Beukeboom LW, van de Zande L. Maternal control of haplodiploid sex determination in the waspNasonia. Science. 2010; 328:620–3.
51. El Jamil A, Magre S, Mazabraud A, Penrad-Mobayed M. Early aspects of gonadal sex differentiation inXenopus tropicaliswith reference to an antero-posterior gradient. J Exp Zool. 2008;309:127–37.
52. Duarte-Guterman P, Ryan MJ, Trudeau VL. Developmental expression of sex steroid- and thyroid hormone-related genes and their regulation by triiodothyronine in the gonad-mesonephros of a Neotropical frog, Physalaemus pustulosus. Gen Comp Endocrinol. 2012;177:195–204. 53. Hogan NS, Crump KL, Duarte P, Lean DRS, Trudeau VL. Hormone
cross-regulation in the tadpole brain: developmental expression profiles and effect of T3 exposure on thyroid hormone- and estrogen-responsive genes inRana pipiens. Gen Comp Endocrinol. 2007;154:5–15.
54. Ranz JM, Castillo-Davis CI, Meiklejohn CD, Hartl DL. Sex-dependent gene expression and evolution of theDrosophilatranscriptome. Science. 2003; 300:1742–5.
55. Zhang Z, Hambuch TM, Parsch J. Molecular evolution of sex-biased genes in
Drosophila. Mol Biol Evol. 2004;21:2130–9.
56. Sumida M, Nishioka M. Sex-linked genes and linkage maps in amphibians. Comp Biochem Physiol Part B. 2000;126:257–70.
57. Miura I. Sex determination and sex chromosomes in Amphibia. Sex Dev. 2017;11:298–306.
58. Jeffries DL, Lavanchy G, Sermier R, Sredl MJ, Miura I, Borzée A, et al. A rapid rate of sex-chromosome turnover and non-random transitions in true frogs. Nat Commun. 2018. In press. DOI: 10.1038/s41467-018-06517-2.
59. Blaser O, Grossen C, Neuenschwander S, Perrin N. Sex-chromosome turnovers induced by deleterious mutation load. Evolution. 2013;67:635–45. 60. Blaser O, Neuenschwander S, Perrin N. Sex-chromosome turnovers: the
hot-potato model. Am Nat. 2014;183:140–6.
61. Rice WR. The accumulation of sexually antagonistic genes as a selective agent promoting the evolution of reduced recombination between primitive sex chromosomes. Evolution. 1987;41:911–4.
62. Charlesworth D, Charlesworth B, Marais G. Steps in the evolution of heteromorphic sex chromosomes. Heredity. 2005;95:118–28.
63. Bolger AM, Lohse M, Usadel B. Trimmomatic: a flexible trimmer for Illumina sequence data. Bioinformatics. 2014;30:2114–20.
64. Haas BJ, Papanicolaou A, Yassour M, Grabherr M, Philip D, Bowden J, et al. De novo transcript sequence reconstruction from RNA-seq: reference generation and analysis with Trinity. Nat Protoc. 2013;8:1494–512. 65. Bray NL, Pimentel H, Melsted P, Pachter L. Near-optimal RNA-Seq
quantification. Nat Biotechnol. 2016;34:525–7.
66. Robinson MD, McCarthy DJ, Smyth GK. edgeR: a bioconductor package for differential expression analysis of digital gene expression data.
Bioinformatics. 2010;26:139–40.
67. McCarthy DJ, Chen Y, Smyth GK. Differential expression analysis of multifactor RNA-Seq experiments with respect to biological variation. Nucleic Acids Res. 2012;40:4288–97.
68. Montgomery SH, Mank JE. Inferring regulatory change from gene expression: the confounding effects of tissue scaling. Mol Ecol. 2016;25: 5114–28.
69. Langfelder P, Zhang B, Horvath S. Defining clusters from a hierarchical cluster tree: the dynamic tree cut package for R. Bioinformatics. 2008;24:719–20. 70. Suzuki R, Shimodaira H. Pvclust: an R package for assessing the uncertainty
in hierarchical clustering. Bioinformatics. 2006;22:1540–2.
71. Alexa A, Rahnenführer J. topGO: enrichment analysis for Gene Ontology. R Package version 2.32.0. 2016.
72. Löytynoja A, Goldman N. webPRANK: a phylogeny-aware multiple sequence aligner with interactive alignment browser. BMC Bioinformatics. 2010;11:579. 73. Yang Z. PAML 4: phylogenetic analysis by maximum likelihood. Mol Biol
Evol. 2007;24:1586–91.
74. Axelsson E, Hultin-Rosenberg L, Brandstrom M, Zwahlen M, Clayton DF, Ellegren H. Natural selection in avian protein-coding genes expressed in brain. Mol Ecol. 2008;17:3008–17.
75. Hothorn T, Bretz F, Westfall P. Simultaneous inference in general parametric models. Biom J. 2008;50:346–63.
computing. R Foundation for Statistical Computing, Vienna, Austria.http:// www.R-project.org/
77. Zeileis A, Grothendieck G. zoo: S3 infrastructure for regular and irregular time series. J Stat Softw. 2005;14:1–27.
78. Ma W-J, Veltsos P, Perrin N. Evolution and developmental dynamics of sex-biased gene expression. NCBI BioProject PRJNA464250. Available from (01. 08.2018).https://www.ncbi.nlm.nih.gov/bioproject/PRJNA464250. 79. Ma W-J, Veltsos P, Sermier R, Parker DJ, Perrin N. Evolutionary and
developmental dynamics of sex-biased gene expression in common frogs with proto-Y chromosomes. Data sets. Zenodo (12.09.2018). 2018.https:// doi.org/10.5281/zenodo.1414000.