Technology (IJRASET)
Study on Genetic Algorithm and Implementation
of Various Test Function using Crossover
Operator
Avni Sharma1, Sanjay2 1,2Computer Science & Engineering, Himachal Pradesh Technical University, Hamirpur
Abstract: Nature has always been a great source of inspiration to all mankind. Genetic Algorithms(GAs) are search based algorithms based on the concepts of natural selection and genetics. GAs is a subset of a much larger branch of computation known as Evolutionary Computation. There are a number of operators available for each and every phase. Crossover is one such phase for which a variety of crossover operators exist. It becomes very confusing to select one crossover operator. Therefore, a comparative study of various crossover operators is provided to help researchers select any one of the available crossover operators. The study includes a deep study of various aspects of genetic algorithms and its phases. In this we can randomly create initial population and assign fitness value it depends on selection criteria . Then we create new offspring and calculate the domain value to find out the best operator
Keywords: Genetic Algorithm, Crossover, Evolutionary Computation, Genetics, Fitness value
I. INTRODUCTION
The experimentation is done on some of the standard test functions taken from the literature. These test functions are often used for evaluation of the performance of genetic algorithm. These functions are Sphere modal function,Rosenbrock’s function, Rastrigin’s function, Schwefel’s function, Ellipsoid’s function, Ackley’s function and Axis Parallel Hyper-Ellipsoid function. A number of situations have occurred in which the choice of crossover depends upon the kind of encoding strategy we have used, and the problem itself.
II. APPROACH
For the implementation, we have used MATLAB. The properties of the matlab used are as follows: MATLAB R2013a (8.1.0.604) 64-bit. In matlab, there is an optimization toolbox which have genetic algorithm. The implementation of this work required the following steps:
A. Each function is first coded as matlab function and saved with .m extension.
B. Then we click on Apps>Optimization toolbox.
C. The same optimization toolbox can be opened by writing Optimtool in the command window.
D. In the optimization toolbox, a number of problem solvers are present and we have to select genetic algorithm
E. Then all the specifications related to genetic algorithm are to be mentioned according to the problem like population type, selection, fitness scaling, objective function, crossover etc.
III. ALGORITHM FOR GENETIC ALGORITHM IMPLEMENTATION
Step-1: Randomly create the initial population of individual string of the given TSP problem and create a matrix representation of the cost of the path between two cities.
Step-2: Assign the fitness to each chromosome in the population using fitness criteria measure. The selection criteria depend upon the value of string if it is close to some threshold value.
Step-3: Create new off-spring population from two existing chromosomes in the parent population by applying crossover operator. Step-4: Mutate the resultant off-springs if required. NOTE: After the crossover off spring population has the fitness value higher than the parents.
Technology (IJRASET)
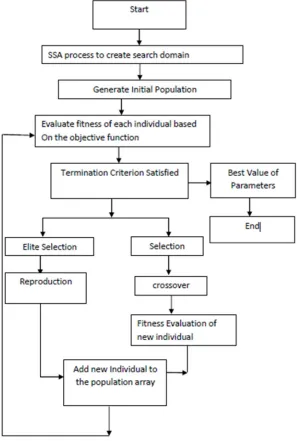
[image:3.612.184.481.96.537.2]A. Flowchart of Genetic Algorithm
Figure 3.1.1 Flowchart of Genetic Algorithm
IV. OUTPUT
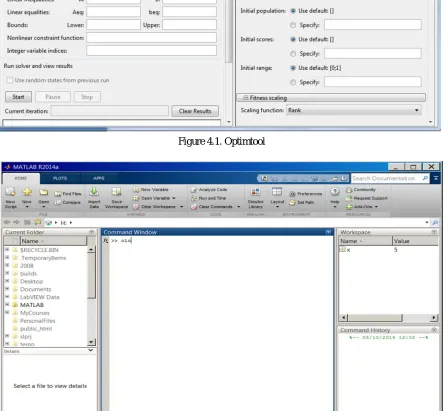
The mentioned functions were first coded in matlab. This can be achieved by first clicking on New>>function. The function prototype is also shown. Code each of the function and then save. Open apps>>optimization tool. Enter the objective function. The objective function is the function that we have coded.
Enter the constraints and do the following settings: Population Type: Double Vector Generations=100
Technology (IJRASET)
Selection Function= RouletteElite Count=2
Population Size= 20 and 100 Crossover Fraction=0.8
[image:4.612.103.548.166.415.2] [image:4.612.105.549.281.692.2]Mutation Function= Adaptive Feasible Mutation Rate= 0.01
Figure 4.1. Optimtool
Technology (IJRASET)
After implementing the test functions, we get the following results:Functions Obtained SC 1PC 2PC IC HC AC
Results
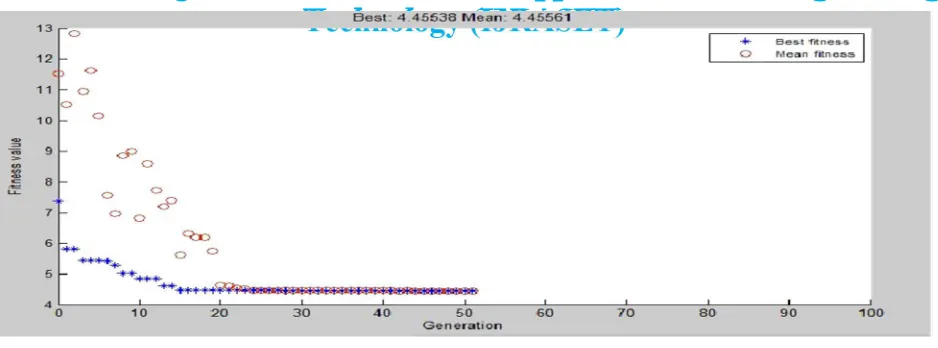
Sphere Best 2.74915 4.45538 5.92096 5.39837 0.70909 5.56254
Mean 2.75093 4.45561 5.92141 5.39873 2.5932 5.56332
Schwefel Best 830.075 830.075 830.075 830.075 830.075 830.075
Mean 830.075 830.075 830.075 830.075 830.075 830.075
Rosenbrock Best 0.074635 0.0064694 0.004848 0.01726 4.774e-5 0.00011
Mean 0.075486 0.0065578 0.005973 0.01977 20.8592 0.86355
Ackley Best 1.004e-5 0.0001723 0.000137 1.224e-6 7.781e-5 0.00023
Mean 0.000240 0.0002388 0.000786 0.00154 0.86052 0.00846
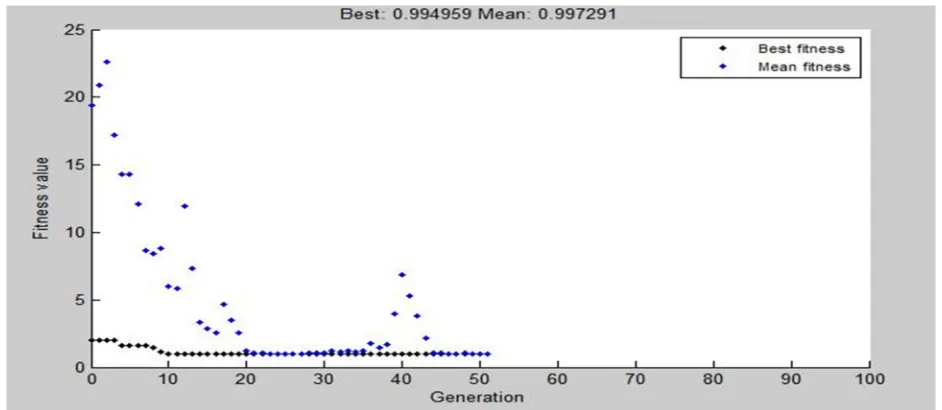
Rastrigin Best 0.994959 0.99496 8.048e-7 0.99495 1.278e-8 1.25124
Mean 0.994962 0.994963 4.919e-6 0.99729 3.72625 0.00133
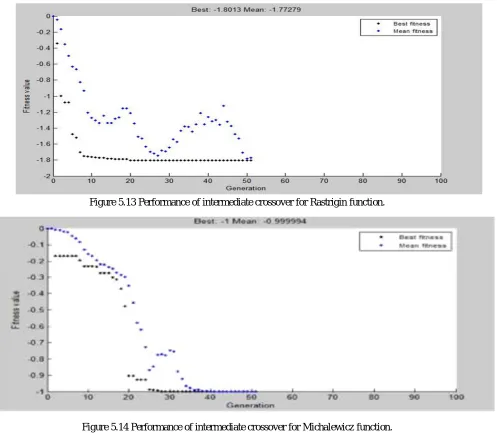
Michalewicz Best -1.21406 -1.8013 -1.8013 -1.8013 -1.8013 -1.00004
Mean -1.21404 -1.8013 -1.8013 -1.77279 -1.79425 -1.00004
Easom Best -0.99999 -1.0000000 -1.00000 -1.0000 -1.00000 -1.00000
Mean -0.99998 -1.0000000 -1.00000 -0.99994 -0.79629 -1.00000
[image:5.612.62.556.427.733.2]Population Size=20
Table 4.1: Comparison of crossover operators for population size =20.
Functions Obtained SC 1PC 2PC IC HC AC
Results
Sphere Best 0.356117 1.11999 0.502891 2.00828 0.10590 3.58712
Mean 0.574933 2.49184 2.52815 4.98286 0.72005 3.58762
Schwefel Best 830.075 830.075 830.075 830.075 830.075 830.075
Mean 830.075 830.075 830.075 830.075 830.075 830.075
Rosenbrock Best 7.226e-5 0.0012806 0.001815 1.156e-5 6.10e-13 1.65e-10
Mean 0.005132 0.0172026 0.003094 0.90392 97.8011 0.000717
Ackley Best 2.158e-5 3.0139e-5 7.498e-5 5.802e-8 8.330e-7 4.447e-7
Mean 0.000215 0.0001859 0.000215 0.00952 1.18623 0.022810
Rastrigin Best 7.607e-8 2.96338e-7 2.462e-9 2.05e-11 0.00000 7.32e-12
Mean 2.004e-6 2.01847e-6 1.050e-5 0.00109 0.51141 9.519e-5
Michalewicz Best -1.8013 -1.8013 -1.8013 -1.8013 -1.8013 -1.8013
Mean -1.8013 -1.8013 -1.8013 -1.80129 -1.8013 -1.8013
Easom Best -1.00000 -1.0000000 -1.00000 -1.00000 -1.00000 -1.00000
Technology (IJRASET)
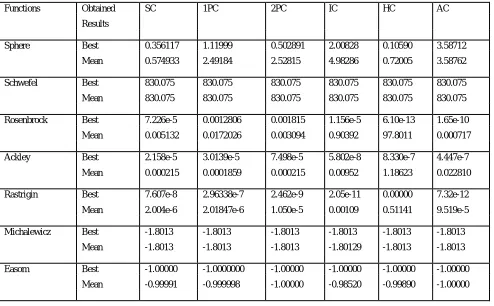
[image:6.612.60.540.127.305.2]Population size=100
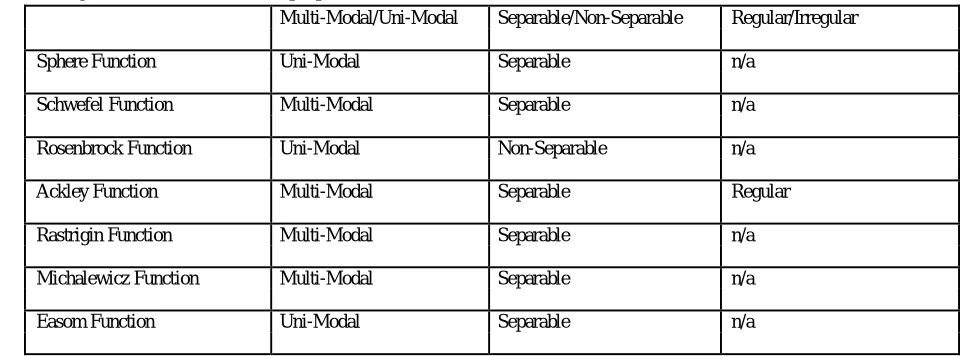
Table 4.2: Comparison of crossover operators for population size =100. The following table shows some of the properties of the test functions:
Multi-Modal/Uni-Modal Separable/Non-Separable Regular/Irregular
Sphere Function Uni-Modal Separable n/a
Schwefel Function Multi-Modal Separable n/a
Rosenbrock Function Uni-Modal Non-Separable n/a
Ackley Function Multi-Modal Separable Regular
Rastrigin Function Multi-Modal Separable n/a
Michalewicz Function Multi-Modal Separable n/a
Easom Function Uni-Modal Separable n/a
Table 4.3: Table showing properties of various test functions
[image:6.612.76.549.326.703.2]V. COMPARISION GRAPHS
Figure 5.1 Performance of crossovers for best value for population size=20.
Technology (IJRASET)
Figure 5.3 Performance of crossovers for best value for population size=100.
[image:7.612.86.554.483.694.2]Technology (IJRASET)
Figure 5.5 Performance of scatter crossover for Sphere function.
A. SNAPSHOTS OF THE OUTPUTS (population size=20)
[image:8.612.51.561.249.715.2]Figure 5.6 Performance of single-point crossover for Sphere function.
Technology (IJRASET)
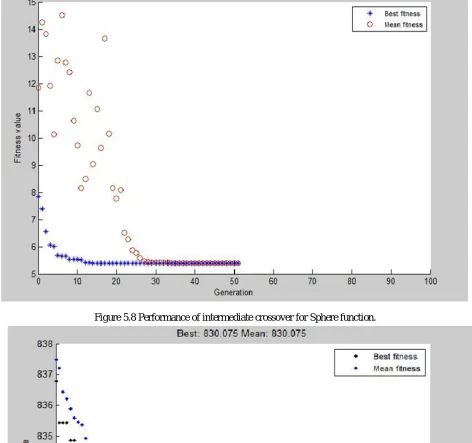
Figure 5.8 Performance of intermediate crossover for Sphere function.
[image:9.612.77.548.393.703.2]
Technology (IJRASET)
[image:10.612.77.564.57.469.2]Figure 5.10 Performance of scattered crossover for Schwefel function.
Figure 5.11 Performance of scattered crossover for Rosenbrock function.
[image:10.612.96.567.500.705.2]Technology (IJRASET)
Figure 5.13 Performance of intermediate crossover for Rastrigin function.
[image:11.612.83.554.69.265.2]Figure 5.14 Performance of intermediate crossover for Michalewicz function.
[image:11.612.78.554.500.685.2]Technology (IJRASET)
VI. CONCLUSIONS
Genetic algorithms are searching and optimization techniques inspired by biology. We can use the crossover operator for optimization and calculate the fitness value for various function of genetic algorithm. We have use various crossover operators to find out the domain value. After calculating or finding out value of domain using various operator we can conclude that the heuristic crossover operator is best because its domain value is appropriate for optimizing the problems. Genetic algorithm can be applied in many problems like mathematical optimization and simulation parameterization. The main use of genetic algorithm is in optimization problems like travelling salesman problem (TSP), knapsack problem, bin packing problem etc. The genetic algorithms are increasingly gaining popularity for optimization problems. The genetic algorithm consists of three basis phases which are encoding, selection and crossover. A number of variants of every phase are present. For example, encoding phase has a number of encoding strategies like binary encoding, permutation encoding, tree encoding etc. In the same way, the selection phase can be implemented using a number of selection operators like Roulette wheel selection, Rank selection, tournament selection, steady state selection, Boltzmann selection, elitism selection etc. Likewise, crossover also have a number of different crossover operators like single point crossover, two point crossover, scattered crossover, intermediate crossover, heuristic crossover, arithmetic crossover etc. Also the phases can be extended to mutation and replacement. The need of the study is to evaluate the crossover operators using the standard functions. The main objective is to find the crossover operator which give satisfactory results.
In the literature survey, we studied the whole genetic algorithm in detail. Its every phase is studied in detail. The main focus is given to the crossover phase. The crossover phase and the various crossover operators are chosen for the evaluation as the crossover phase is responsible for achieving the required “exploration.” During the study, both theoretical and empirical research methodologies are adopted. The theoretical approach is used for the literature survey and the empirical approach is used to implement and evaluate the crossover operators. This study includes the introduction of genetic algorithm, its phases and applications. The implementation is done in MATLAB. The software tool MATLAB is also explained briefly.
VII. ACKNOWLEDGMENT
I would like to take this opportunity to express my deepest gratitude to my advisor Mr. Sanjay for providing excellent guidance, encouragement and inspiration throughout the dissertation work. His extreme energy, creativity and excellent skills have always been a constant source of motivation for me. The perfection that he brings to each and every piece of work that he does always inspired me to do things right at first time. Without his invaluable guidance, this work would never have been a successful one. He is a great person and one of the best mentors. I will always be thankful to him.
REFERENCES
[1] L. Yao, “Parameter Estimation for Nonlinear Systems”, Ph.D Dissertation, University of Wisconsin-Madison, 1992.
[2] J. Joines, C. Culbreth and R. King, “Manufacturing Cell Design: An Integer Programming Model Employing Genetics”, IEEE Trans., Vol. 28, No. 1, pp. 69-85, 1996.
[3] F. Gold, “Application of the Genetic Algorithm to the Kinematic Design of Turbine Blade Fixtures”, Ph.DDissertation, Worcester Polytechnic Institute, 1998.
[4] Sharma et al.,”A study on crossover operator”, International Journal of Advanced Research in Computer Science and Software Engineering 3(7), pp. 1476-1479, July – 2013.
[5] . Davern, “Architecture for Job Shop Scheduling with Genetic Algorithms”, Ph.D Dissertation, University of Central Florida, 1994. [6] S.N.Sivanandam, S.N.Deepa,” An Introduction to Genetic Algorithms”,Springer,ISBN 9783540731894,2007.

![I Design of the Primary Prevention Parameters Evaluation (PREPARE) trial of implantablecardioverter defibrillators to reduce patient morbidity [NCT00279279]](data:image/gif;base64,R0lGODlhAQABAIAAAP///wAAACH5BAEAAAAALAAAAAABAAEAAAICRAEAOw==)