M E T H O D
Open Access
Network analysis of gene essentiality in
functional genomics experiments
Peng Jiang
1, Hongfang Wang
2, Wei Li
1, Chongzhi Zang
1, Bo Li
1, Yinling J. Wong
2, Cliff Meyer
1, Jun S. Liu
3,
Jon C. Aster
2and X. Shirley Liu
1,4*Abstract
Many genomic techniques have been developed to study gene essentiality genome-wide, such as CRISPR and shRNA screens. Our analyses of public CRISPR screens suggest protein interaction networks, when integrated with gene expression or histone marks, are highly predictive of gene essentiality. Meanwhile, the quality of CRISPR and shRNA screen results can be significantly enhanced through network neighbor information. We also found network neighbor information to be very informative on prioritizing ChIP-seq target genes and survival indicator genes from tumor profiling. Thus, our study provides a general method for gene essentiality analysis in functional genomic experiments (http://nest.dfci.harvard.edu).
Keywords:CRISPR screen, Network analysis, Gene essentiality
Background
Essential genes are those genes critical for cell viability under certain contexts. Recent years have seen the rapid development of functional genomics techniques for studying gene essentiality genome-wide. For example, large-scale shRNA screens have been used to search for essential genes in diverse cell lines [1]. If a specific transcrip-tion factor drives the cell viability under certain conditranscrip-tion, ChIP-seq technique can be used to profile the regulatory targets to further find essential genes [2]. Many computa-tional methods have also been developed to predict context specific gene essentiality through integration of gene expres-sion, molecular alterations, and biological pathways [3].
Recently, the CRISPR (clustered regularly interspaced short palindromic repeats) screen emerged as an exciting new approach to profile gene essentiality at genome scale [4–11]. In the CRISPR system, single-guide RNAs (sgRNA) direct Cas9 nucleases to induce double-strand breaks (DSB) at targeted genomic regions [12, 13]. When the error-prone non-homologous end-joining mechanism repairs the DSBs, insertions and deletions occur with high frequency, which produce a non-functional
protein. Catalytically inactive Cas9 fused with a transcrip-tional activator or repressor has also been used to modulate gene expression at targeted loci [8, 9, 14–17]. Combined with lentiviral delivery method, CRISPR systems enable genome-scale functional screening in a cost-effective man-ner [4–11]. In CRISPR screens, sgRNAs targeting candidate genes are synthesized, and viral integration enables readout through next-generation sequencing [18]. The relative abundances of each integrated sgRNA between different conditions are compared and the importance of sgRNA tar-get gene is inferred according to its sgRNAs’effect on cell growth.
The progress of CRISPR screen technology enabled systematic and reliable determination of gene essentiality under diverse conditions. The high quality gene essenti-ality profiles from CRISPR could enable a better com-parison among essentiality prediction methods and better identification of distinct features of the essential genes. Such features not only facilitate a better under-standing of the CRISPR screen data, but also can help prioritize the leads from CRISPR screens. From the ana-lysis of yeast protein interactions, it is well known that highly connected proteins in a network (degree hubs) are more likely to be essential for viability [19–21]. Thus, we hypothesize that the gene essentiality outcome in CRISPR screens might depend on the gene connectiv-ity in biological networks. Protein interaction networks * Correspondence:[email protected]
1Department of Biostatistics and Computational Biology, Dana-Farber Cancer
Institute, Harvard T.H. Chan School of Public Health, Boston, MA 02215, USA 4School of Life Science and Technology, Tongji University, Shanghai, MA
02138, China
Full list of author information is available at the end of the article
have been integrated to improve the quality of RNAi screen results, which are very noisy due to off-target ef-fect and low knockdown efficiency [22–25]. These previ-ous works on RNAi screen indicate that the CRISPR screen result quality may also be improved by integra-tion with protein interacintegra-tion networks.
In this study, we took a network perspective and developed a method called NEST (Network Essenti-ality Scoring Tool) to systematically analyze the re-cent genome wide CRISPR screen data. We found that gene essentiality determined by CRISPR screen largely depends on the expression level of interacting genes in the biological network. Moreover, the qual-ity of CRISPR and shRNA screen data can be further improved by NEST after considering the gene neigh-borhood screen outcome. Besides applications on CRISPR and shRNA screens, NEST is also generally applicable on many other types of genomics data analysis, such as ChIP-seq target gene prioritization and survival gene identification from tumor profiling data.
Results and discussion
NEST predicts gene essentiality in CRISPR screen
We first collected recently published CRISPR loss-of-function screen data [4, 5, 8], and selected three cell lines (K562, HL60, and A375) with publicly available gene expression data [26–28]. The significant CRISPR screen gene hits are called with software MAGeCK [29]. In CRISPR screens for growth phenotype, most signifi-cant genes are negatively selected, which means these genes are essential in the corresponding experimental condition (Additional file 1: Figure S1). To identify dis-tinct features of gene essentiality in CRISPR screens, we developed a network-based method called NEST (Net-work Essentiality Scoring Tool), and found the following metric to give reliable performance.
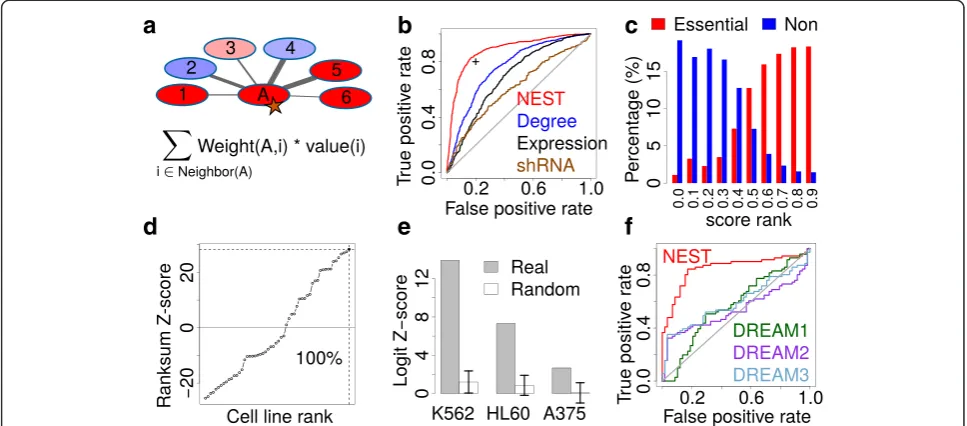
For each gene, NEST calculates neighbor expression measure as the sum of normalized expression of its neighbor genes connected in the protein interaction net-work, weighted by the interaction confidence (Fig. 1a). The calculation of NEST score can also be formulated as product between connectivity matrix, which is composed of interaction weights between protein pairs, and gene expression vector. Each gene’s relative expression in one cell is normalized against its average expression across all cell lines, and the protein interaction network infor-mation is from STRING [30] (Additional file 1: Figure S2). For essential genes selected by CRISPR screen, we defined the gold standard set as the genes hits called by MAGeCK with FDR threshold 0.05 [29]. For each meas-ure, such as NEST score or network degree, all genes were ranked by their values in descending order. Re-ceiver operating characteristic (ROC) curve was used to
test the performance of predicting the CRISPR screen gold standard set (Fig. 1b).
For gene essentiality prediction in K562 CRISPRi screen, NEST achieved a false positive rate of 0.2 and a true positive rate of 0.8, with an area under the ROC curve (AUC) of 0.89. The AUC of NEST score is consist-ently better than network degree, gene expression, and shRNA screen data from the Achilles project [1] (Delong Pvalue <1e-10 for all comparisons). Similar performance differences were also observed in CRISPR screen in HL60 and A375 (Additional file 1: Figure S3a). To visualize the CRISPR prediction performance in an intui-tive way, we plotted the rank percentile of NEST scores for essential genes and non-essential genes in CRISPR screen (Fig. 1c and Additional file 1: Figure S3B). The NEST ranks are significantly higher for essential genes than non-essential genes (Wilcoxon rank-sum P value <1e-10 for cell lines). Besides STRING network, we also used other large-scale networks for CRISPR outcome pre-diction. However, we did not find any performance im-provement using either other network or merged network among several data sources (Additional file 1: Figure S4).
The results above suggest that if a gene’s network neighbors are over-expressed in some conditions, the gene itself becomes more essential. We also found that genes with high NEST scores are tightly clustered in protein interaction network. The STRING network genes were grouped into 2,271 dense complexes using SPICi [31]. Gene with high NEST scores tend to stay in fewer number of STRING clusters than clusters with gene names shuffled (Additional file 1: Figure S5). Thus, a high NEST score may indicate the gene to be member of an active protein complex.
Since gene network degree and gene expression are also predicative of gene essentiality (Fig. 1b), we then tested whether the prediction performance of NEST is simply an additive effect of network degree and gene ex-pression (Table 1). Using the gene essentiality in CRISPR
screen as responsive variable, we did a multivariate logis-tic regression among all three covariates (NEST score, gene network degree, and expression). While all covari-ates are predictive of gene essentiality jointly, NEST has the largest statistical significance defined as Logit Z-score (Table 1). Moreover, the logistic regression fitted value, combining all covariates together, did not improve the CRISPR prediction performance comparing to NEST score alone (Additional file 1: Figure S7). As a further control, we randomized the STRING network but pre-served the network degree for each gene [33]. The Logit Z-scores for the NEST score in random networks are significantly smaller than in real data (Fig. 1e, empirical P value <0.001 for K562 and HL60, and P value = 0.003 for A375).
[image:3.595.56.540.90.303.2]There have been many previous methods developed for gene essentiality prediction. Since CRISPR screen measures the gene essentiality, any previous methods can be predictive for CRISPR outcome. In a recent DREAM challenge, contenders were asked to develop al-gorithms to predict cell specific gene essentiality [3]. Among cell lines included in the DREAM challenge, A375 has CRISPR screen data available. We compared the CRISPR outcome prediction performance between our method and the top three methods from the Table 1Confounding factors for NEST prediction performance
Covariate Coefficient Standard error Z-score Pvalue
NEST 0.02329 0.001748 13.32 1.72e-40
Degree 0.00415 0.000846 4.91 9.33e-07
Expression 0.12937 0.054223 2.39 1.70e-02
A. K562
NEST 0.03494 0.00505 6.91 4.73e-12
Degree 0.00608 0.00146 4.16 3.13e-05
Expression 0.33873 0.16595 2.04 4.12e-02
B. HL60
NEST 0.07296 0.02483 2.94 0.00329
Degree 0.00792 0.00357 2.22 0.02647
Expression 1.12266 0.48343 2.32 0.02022
C. A375
The prediction power of NEST score on gene essentiality decided by CRISPR screen is tested through logistic regression with gene network degree and gene expression as covariates. The Logit Z-score is defined as Coef/Stderr. ThePvalue is calculated by Ward test. The result is shown for (A) K562, (B) HL60, and (C) A375
a
b
c
d
e
f
[image:3.595.56.290.518.699.2]DREAM challenge, and found NEST to consistently out-perform all DREAM winners (Fig. 1f ). Besides the methods in DREAM, we also compared the performance of NEST with other methods using gene expression and network to predict gene essentiality [34, 35]. NEST sig-nificantly outperformed all other methods (Additional file 1: Figure S8 and Additional file 1: Methods).
Besides gene expression, we also used H3K27ac his-tone mark data to compute NEST scores and tested the gene essentiality prediction performance. Previously, we developed a method to calculate the regulatory potential (RP) scores of a histone modification on each gene pro-moter from the ChIP-seq profile [36, 37]. Based on our previous method, gene level RP scores in K562 cell were computed using the Roadmap H3K27ac ChIP-seq profile [26]. For each gene, NEST computed neighbor H3K27ac score as the sum of H3K27ac RP scores of its neighbor genes connected in the protein interaction network, weighted by the interaction confidence (Fig. 1a). H3K27ac NEST scores could also reliably predict the gene essential-ity in K562 CRISPRi screen (Additional file 1: Figure S3), suggesting the applicability of NEST analysis on histone modification data.
NEST enhances the quality of CRISPR screen results
Since early CRISPR screens might have inefficient sgRNA selection and few sgRNA per gene, these screens may not give very strong hits. Encouraged by the predic-tion performance, we checked whether the network neigh-bor information could enhance the quality of CRISPR screen results. To measure the quality of a screen data, we need to know the expected outcome. In a K562 CRISPRi screen, the authors performed a genome-scale selection for genes that modulate sensitivity to Cholera/Diphtheria toxin [8]. For genes that work with the toxin, their knock out will protect the cell against the toxin and induce a positive gene selection in screen. For genes that are tar-geted by toxin, their knock out will sensitize the cell for toxin effect and induce a negative gene selection. The positively selected genes, which played a protective role against toxin, were enriched in KEGG pathways ‘Vibrio Cholerae Infection’ and ‘Glycosphingolipid Biosynthesis’ [8]. The negatively selected genes, which played a sensitiz-ing role for toxin, were enriched in‘Ribosome’and‘ Prote-asome’ pathways [8]. We used these enriched pathway genes as gold standard and tested how well network inter-action could improve the CRISPR screen result (Fig. 2).
For each gene, NEST calculated a neighbor CRISPR score by adding up the CRISPR fold change scores among neighbor genes connected in the STRING net-work, weighted by the interaction confidence. This NEST score is significantly more predictive on the gold standard outcome than the original CRISPR scores for both protective and sensitizing genes
(Fig. 2a, b, Delong test P value = 0.010 for protective genes, P value = 9.92e-14 for sensitizing genes). More-over, when we put different levels of Gaussian white noise into CRISPR screen scores, the prediction per-formance of NEST score diminishes slower than original CRISPR scores (Fig. 2c, d). As a control, if we calculated the NEST scores from randomized net-work, the prediction power became significantly worse (Fig. 2e,Pvalue <0.001 for both protective and sensitizing genes). Thus, through the connectivity of protein inter-action network, NEST can enhance the quality of CRISPR screen result.
As an example of gene with high NEST score,COG6is a member of Golgi complex and its NEST score is sig-nificantly larger than expected (permutation test Pvalue <0.001). COG6 is connected with many other members of Golgi complex (Fig. 2f ), and most of them have posi-tive CRISPR screen fold change scores. Since they are connected with each other in network, they mutually boosted each other’s NEST scores. Our result is consist-ent with the knowledge that cholera toxin needs to consist-enter host cells and travel through the trans-Golgi network to take effect [38].
The above results suggest that if a gene’s network neighbors are under CRISPR screen selection, the gene itself is more likely to be under CRISPR screen selection in the same direction. Besides CRISPR screen, we applied NEST on the Achilles shRNA screen data [1]. NEST can also significantly enhance the quality of shRNA screen result (Additional file 1: Figure S9). Thus, in general, the quality of functional genomic screen result can be improved by considering the gene network neighbor information.
Previously, there were methods developed to improve the quality of RNAi screen results from integration with protein interaction networks [25]. For CRISPR enhance-ment, we compared our method NEST against NePhe, which was a leading method on RNAi screen network analysis [24]. Using K562 toxin screen as the gold stand-ard, we found that NePhe and NEST show similar per-formance as measured by ROC curves (Additional file 1: Figure S10AB). However, while NePhe used 14 GB memory and 6.2 h running time, NEST only used 8.3 MB memory and 10.8 s (Additional file 1: Figure S10C). Thus, NEST maintains reliable screen enhance-ment performance of previous method with much better computational efficiency.
NEST prioritizes ChIP-seq essential targets
to profile its regulatory targets to further find essential genes [2]. The previous analyses demonstrate that NEST can identify the essential genes in a CRISPR screen. We further explored whether NEST can help prioritize key target genes in a ChIP-seq experiment. ChIP-seq often finds tens of thousands in vivo binding sites for a TF. Since target genes can be regulated by TF binding through long range DNA looping, often thousands of genes near the TF binding sites can be putative targets, and it is hard to prioritize the functional target genes directly from a ChIP-seq experiment. We therefore in-vestigated using network neighbor information to prioritize the functional TF target genes.
Our previous studies of NOTCH1 ChIP-seq and gene expression profiles in the T-lymphoblastic leukemia (TLL) cell line CUTLL1 identified 1,012 differential NOTCH1 binding sites between theNOTCH on and off conditions [2]. Based on the ChIP-seq peaks, we cal-culated a regulatory potential (RP) score for each gene [36, 37, 39], a distance-weighted sum of binding sites measuring the overall regulatory impact of differ-ential NOTCH1 binding on target genes. We set the KEGG NOTCH signaling pathway members as the gold stand, and tested the prediction performance of
expression, ChIP-seq RP and NEST scores (Fig. 3). In addition to NEST scores computed from gene expres-sion (NEST E), we also computed NEST scores from ChIP-seq (NEST C), which measures the sum of ChIP-seq RP scores of neighbor genes connected in network. While expression and ChIP-seq measures
a
b
Fig. 3Prediction of NOTCH signaling pathway members.aThe differential gene expression betweenNOTCHon and off conditions is used to calculate the NEST E score. The NOTCH1 ChIP-seq regulatory potential score for each gene is used to calculate the NEST C score. The KEGG Notch Signaling pathway members are used as gold standard and the prediction performances of all measures are shown by ROC curves.bThe area under ROC curve (AUC) is shown for each measure. The comparison between AUCs is done by Delong test Fig. 2Enhancement of CRISPR screen result.aFor K562 CRISPRi screen under Cholera/Diptheria toxin selection, the gold standard of toxin protective genes comes from KEGG pathways‘Vibrio Cholera Infection’and‘Glycosphingolipid biosynthesis’. For each gene, NEST computes the neighbor CRISPR score as the sum of CRISPR screen fold change scores of neighbor genes connected in the network. The prediction performance is compared between NEST and original CRISPR scores.bThe gold standard of toxin sensitizing genes comes from KEGG pathways‘Ribosome’and‘Proteasome’. The prediction performances of NEST and original CRISPR values are compared.cThe original CRISPR values were randomized by Gaussian white noise. The standard deviation of all original CRISPR values was used as base level. At each noise level relative to the base level, the area under ROC curve (AUC) of prediction is compared with the initial AUC for toxin protective genes in K562 Cholera toxin screen. The reduction ratios were plotted for NEST and original CRISPR scores.dThe reduction ratios were plotted for toxin sensitizing genes.eThe STRING network was randomized and the NEST scores were calculated for 1,000 random networks. We used multivariate logistic regression to test the association of NEST scores with gold standards, after controlling the effects from network degree and original CRISPR score. The Logit Z-scores are shown for real and random networks.
[image:5.595.56.540.89.298.2] [image:5.595.306.540.538.644.2]are barely better than random, NEST scores can pre-dict the annotated KEGG NOTCH signaling pathway members at AUC 0.90 and 0.95 (Fig. 3). It suggests that if a gene’s network neighbors are enriched in the binding target of a TF, the gene itself is more likely to be regulated by the same TF.
NEST predicts cancer patient survival
Encouraged by the above analyses in cell lines, we checked whether NEST could facilitate the analysis of tumor profiling data. There have been previous studies integrating biological networks with cancer (or disease) biology data to understand the mechanisms of pathogen-esis [35, 40–43]. Inspired by these studies, we examined the TCGA tumor profiling data to see whether NEST score computed from gene expression can better predict patient survival than gene expression. For example, over-activation of oncogene EGFR is a key feature of Glioblastoma (GBM) [44]. In TCGA GBM profiles [45], while EGFR over-expression does not correlate with worse survival (Fig. 4a, Cox-PHP value = 0.109), higher EGFR NEST score is significantly associated with worse survival (Fig. 4b, Cox-PHPvalue = 0.001).
To systematically evaluate the survival prediction per-formance, we hypothesized that a good gene-wise sur-vival predictor should show significant higher death risk for oncogenes than for tumor suppressors. We tested this hypothesis on all the annotated oncogenes and tumor suppressors [46] using the TCGA GBM data (Fig. 4c). While gene expression showed no significant difference on survival risk Z-scores, NEST gave signifi-cantly higher survival risk for oncogenes than tumor suppressors (Fig. 4c). This observation was corroborated in another independent GBM cohort [47] (Additional file 1: Figure S11), suggesting NEST score to be a much better indicator of GBM survival than gene expression alone. To examine the survival prediction performance of NEST in other cancer types, we used the Wilcoxon rank-sum test to measure the difference of survival risk Z-scores between oncogenes and tumor suppressors. A positive rank-sum Z-score indicates oncogenes with higher survival risk than tumor suppressors, and a nega-tive Z-score indicates the opposite. For low death rate cancers, the Cox-PH survival regression may not get ac-curate risk estimation for each gene. In contrast, cancer types with high death rate, such as GBM and ovarian cancer (OV), seemed to give positive rank-sum Z-scores that separate oncogenes from tumor suppressors (Fig. 4d). These results suggest that if a gene’s neighbors are over expressed in tumors, the gene itself is more likely to be an oncogene with associated survival risk.
We conducted pathway analysis on all the genes whose NEST scores are associated with GBM survival (FDR < = 0.05), and found ‘cytokine cytokine-receptor
interaction’ to be the most enriched KEGG pathway (Additional file 1: Table S2). It was known that cytokines played a pivotal role in the pathogenesis of GBM [48], so we plotted the outcome-associated cytokine genes using CytoScape [49] (Fig. 5). Many of them are known onco-genes in GBM, such asEGFR and CSF1R [46], and sev-eral also have known targeted drugs from Drug Bank [50]. For example, the inhibitors of EGFR, CSF1R, and CXCR4 were shown to reduce the invasiveness of Gli-oma cells or block GBM progression [51–53]. Besides the known druggable genes, many other genes in our prediction could serve as promising targets. For ex-ample, NEST predicted KITLG as indicator of poor GBM survival which is consistent with the finding that downregulation ofKITLG inhibits angiogenesis and Gli-oma growth [54]. Thus, our predictions could sketch a general landscape to investigate therapeutic possibilities for GBM and other cancers.
a
b
c
d
Fig. 4Prediction of patient survival.aAll TCGA Glioblastoma (GBM) patients are ranked byEGFRexpression; the top half patients are assigned as high group and the lower half are assigned as low. Kaplan Meier (KM) survival plot is shown for two groups.bThe survival analysis is done in the same way as A forEGFRNEST scores.
[image:6.595.307.539.87.317.2]Conclusion
To identify distinct features of gene essentiality in CRISPR screens, we developed a network-based method called NEST (Network Essentiality Scoring Tool). We found that essential genes selected in CRISPR screens showed characteristic higher expression level of neigh-bor genes connected in protein interaction network. Our analysis of Cholera toxin screen in K562 cell also suggests that the quality of CRISPR screen result can be enhanced through the neighbor CRISPR selection score. For a ChIP-seq experiment, NEST can also reliably iden-tify the key TF target genes. Last but not least, NEST score can better predict patient survival than gene ex-pression alone from TCGA tumor profiles. Historically, protein interaction networks were widely used to infer discrete labels such as gene functions, phenotypes [55– 57], or gene categories [58]. Our study is different from these previous works in that continuous expression or screen change fold values are integrated with the protein networks. Despite these differences, all of these studies indicate that network information can greatly help bio-logical inference.
NEST significantly outperformed previous methods on gene essentiality prediction and functional screen result enhancement, including all winning methods in the DREAM challenge (Fig. 1f ). According to the rule of DREAM challenge, all DREAM methods can gene ex-pression as well as any other features they could utilize. However, NEST outperformed all top DREAM methods. One possible reason is that the gene essentiality gold standard of DREAM is the Achilles shRNA screen data, which is poorly correlated with CRISPR screen (Fig. 1b and Additional file 1: Figure S3A). Because we used CRISPR data as gold standard, those top DREAM methods, optimized to fit Achilles shRNA screen, may not have satisfactory performance.
[image:7.595.57.540.91.377.2]inactivatedTP53compared with those with wild type [59]. We currently summed all neighbor values without distin-guishing between activating, repressive, or synthetic lethal relations. Thus, further categorization of network inter-action types will be critical for better gene prioritization. Another limitation of our study is that current data on protein interaction network only covered a subset of well-studied genes [60]. Because of the dependence on interaction knowledge, our method may not reliably infer the activity for under-studied genes. As a third limitation, we only tested NEST on gene loss-of-function CRISPR screens. However, for CRISPRa gain of function screen [8, 9], it remains to see whether network-based analysis can bring any predictive power and result enhancement.
In summary, we derived a network-based method, NEST, to interpret and enhance the outcome of genome-wide CRISPR screens, and NEST showed sig-nificantly better performance than previous related methods. We recommend researchers using NEST to calculate neighbor CRISPR values from their CRISPR screen result. Moreover, the candidate essential genes in a cell condition might be prioritized before running a large-scale screen to reduce the total number of genes under the screen, which might improve the results and practicality of in vivo CRISPR screens. Besides CRISPR analysis, our method can also identify key targets from ChIP-seq experiments, and find clinical outcome associ-ated genes from tumor profiling data. Thus, we foresee NEST as generally applicable to many applications re-lated with gene essentiality prioritization.
Materials and methods
Availability
The web application and source code of NEST are freely available under the GNU Public License v3 at http://nest.dfci.harvard.edu. The source code and test-ing data of NEST are additionally deposited at https:// github.com/foreverdream2/NEST/releases.
Data collection
For CRISPR screen data, we searched published studies with data publicly available and sgRNA coverage on gen-ome scale for human cell lines until 1 June 2015. There are three studies fulfilling our criterion. In K562 cell, growth phenotype and toxin selection phenotype are screened with CRISPRi technology [8]. In HL60 and A375 cell lines, growth phenotype is screened on gen-ome scale with CRISPR technology [4, 5]. Significant gene hits are called from these datasets by MAGeCK 0.5 with default parameters and FDR threshold 0.05 [29]. For gene essentiality prediction in each cell line, only negatively selected gene hits were considered as gold standard, because most significant gene hits are
negatively selected in collected CRISPR experiments (Additional file 1: Figure S1). For gold standard con-trol set, we extracted the same number of genes ranked by MAGeCK on bottom.
For K562, the gene expression profile was downloaded from the Roadmap project [26]. For HL60, the gene ex-pression profile by exon-array was downloaded from the ENCODE project [27] and converted to gene level values by JETTA [61]. For A375, the gene expression profile was downloaded from the CCLE project [28]. For each gene, we normalized the expression value by subtracting the mean across all samples in each cohort. Compared to absolute expression level, the normalized expression value can achieve a better CRISPR prediction perform-ance of NEST (Additional file 1: Figure S12). The TCGA tumor gene expression data was downloaded from TCGA Data Portal on 27 July 2014. Only cohorts that are not embargoed are used. For each cancer cohort, the expression values of all normal control samples were av-eraged as background, and the difference of gene expres-sion between tumor sample and normal background was analyzed. For NOTCH signaling pathway analysis, the NOTCH off condition is defined as gamma secretase inhibitors (GSI) treatment 3 days, and NOTCH on con-dition is defined as GSI wash 4 h [62]. The differential expression value between on/off conditions was analyzed [62]. The NOTCH1 ChIP-seq data are generated in our previous work, and the dynamic binding peaks between NOTCH on/off conditions were used [2].
For H3K27ac ChIP-seq profiles, we downloaded data from the Roadmap project [26]. Among all cell lines with CRISPR data collected, K562 is the only one having H3K27ac profile available. Previously, we developed a BETA method to calculate the regulatory potential (RP) on gene promoters from the ChIP-seq profile of a tran-scription factor or histone modification [36, 37]. We used the implementation in RABIT package with default parameters to calculate the H3K27ac RP scores [39]. For each gene, the RP scores were normalized, by subtract-ing the mean across all cell lines profiled.
Network randomization and permutation test
We used stub rewiring method to randomize un-weighted STRING network, which preserves gene degree [33]. The edges from each gene are first detached from its partners, and then randomly connected with each other. Since we do not allow self-interaction and dupli-cated edges, the connection process may fail to finish. In this case, we restart the rewiring process until 98 % edges are reconnected.
random NEST. For each gene, we computed the Z-score as (real NEST– average random NEST)/(Stderr of ran-dom NEST). If the Z-score is positive, we computed the P value as the fraction of random NEST scores that are larger than or equal to the real NEST score. If the Z-score is negative, we computed the P values as the fraction of random NEST scores that are smaller than or equal to the real NEST score.
Survival analysis
We used Cox-PH model to analyze the effect of gene expression or NEST scores on survival. For GBM, there are several factors that affect the survival and we in-cluded them as covariates in survival regression, includ-ing age, gender, G-CIMP status, and treatment status [45]. So the final survival effect was corrected with the effects of these confounding factors. For TCGA pan-cancer analysis, we only included cancer types with more than 50 patients and 5 % death rate. In the Cox-PH regression, we only included age, gender, and stage (if available) to enable uniform comparison among different cancer types.
Additional file
Additional file 1:Supplementary methods, Supplementary Figures S1 to S12 and Tables S1 and S2.(PDF 524 kb)
Competing interests
The authors declare that they have no competing interests.
Authors’contributions
PJ, HW, WL, CZ, BL, CM, YW, JSL, JCA, and XSL designed the study and interpreted the results. PJ developed the algorithm and performed the analyses. PJ and XSL wrote the paper. All authors read and approved the final manuscript.
Acknowledgements
The authors would like to thank Michael Love, Eric Severson, Han Xu, Yiwei Chen, and Jing Mi for helpful discussions. The project was supported by the U01 CA180980 grant from NIH and the Claudia Adams Barr Award in Innovative Basic Cancer Research from the Dana-Farber Cancer Institute.
Author details
1Department of Biostatistics and Computational Biology, Dana-Farber Cancer
Institute, Harvard T.H. Chan School of Public Health, Boston, MA 02215, USA. 2Department of Pathology, Brigham and Women’s Hospital, Boston, MA
02115, USA.3Department of Statistics, Harvard University, Cambridge 200092, USA.4School of Life Science and Technology, Tongji University, Shanghai, MA 02138, China.
Received: 13 August 2015 Accepted: 20 October 2015
References
1. Cowley GS, Weir BA, Vazquez F, Tamayo P, Scott JA, Rusin S, et al. Parallel genome-scale loss of function screens in 216 cancer cell lines for the identification of context-specific genetic dependencies. Sci Data. 2014;1:140035.
2. Wang H, Zang C, Taing L, Arnett KL, Wong YJ, Pear WS, et al. NOTCH1-RBPJ complexes drive target gene expression through dynamic interactions with superenhancers. Proc Natl Acad Sci U S A. 2014;111:705–10.
3. Broad-DREAM Gene Essentiality Prediction Challenge. Available at: https:// www.synapse.org/#!Synapse:syn2384331/wiki.
4. Shalem O, Sanjana NE, Hartenian E, Shi X, Scott DA, Mikkelsen TS, et al. Genome-scale CRISPR-Cas9 knockout screening in human cells. Science. 2014;343:84–7.
5. Wang T, Wei JJ, Sabatini DM, Lander ES. Genetic screens in human cells using the CRISPR-Cas9 system. Science. 2014;343:80–4.
6. Koike-Yusa H, Li Y, Tan EP, Velasco-Herrera Mdel C, Yusa K. Genome-wide recessive genetic screening in mammalian cells with a lentiviral CRISPR-guide RNA library. Nat Biotechnol. 2014;32:267–73. 7. Zhou Y, Zhu S, Cai C, Yuan P, Li C, Huang Y, et al. High-throughput
screening of a CRISPR/Cas9 library for functional genomics in human cells. Nature. 2014;509:487–91.
8. Gilbert LA, Horlbeck MA, Adamson B, Villalta JE, Chen Y, Whitehead EH, et al. Genome-scale CRISPR-mediated control of gene repression and activation. Cell. 2014;159:647–61.
9. Konermann S, Brigham MD, Trevino AE, Joung J, Abudayyeh OO, Barcena C, et al. Genome-scale transcriptional activation by an engineered CRISPR-Cas9 complex. Nature. 2015;517:583–8.
10. Chen S, Sanjana NE, Zheng K, Shalem O, Lee K, Shi X, et al. Genome-wide CRISPR screen in a mouse model of tumor growth and metastasis. Cell. 2015;160:1246–60.
11. Shi J, Wang E, Milazzo JP, Wang Z, Kinney JB, Vakoc CR. Discovery of cancer drug targets by CRISPR-Cas9 screening of protein domains. Nat Biotechnol. 2015;33:661–7.
12. Jinek M, Chylinski K, Fonfara I, Hauer M, Doudna JA, Charpentier E. A programmable dual-RNA-guided DNA endonuclease in adaptive bacterial immunity. Science. 2012;337:816–21.
13. Gasiunas G, Barrangou R, Horvath P, Siksnys V. Cas9-crRNA
ribonucleoprotein complex mediates specific DNA cleavage for adaptive immunity in bacteria. Proc Natl Acad Sci U S A. 2012;109:E2579–86. 14. Maeder ML, Linder SJ, Cascio VM, Fu Y, Ho QH, Joung JK. CRISPR
RNA-guided activation of endogenous human genes. Nat Methods. 2013;10:977–9.
15. Qi LS, Larson MH, Gilbert LA, Doudna JA, Weissman JS, Arkin AP, et al. Repurposing CRISPR as an RNA-guided platform for sequence-specific control of gene expression. Cell. 2013;152:1173–83.
16. Gilbert LA, Larson MH, Morsut L, Liu Z, Brar GA, Torres SE, et al. CRISPR-mediated modular RNA-guided regulation of transcription in eukaryotes. Cell. 2013;154:442–51.
17. Zalatan JG, Lee ME, Almeida R, Gilbert LA, Whitehead EH, La Russa M, et al. Engineering complex synthetic transcriptional programs with CRISPR RNA scaffolds. Cell. 2015;160:339–50.
18. Shalem O, Sanjana NE, Zhang F. High-throughput functional genomics using CRISPR-Cas9. Nat Rev Genet. 2015;16:299–311.
19. Jeong H, Mason SP, Barabasi AL, Oltvai ZN. Lethality and centrality in protein networks. Nature. 2001;411:41–2.
20. Han JD, Bertin N, Hao T, Goldberg DS, Berriz GF, Zhang LV, et al. Evidence for dynamically organized modularity in the yeast protein-protein interaction network. Nature. 2004;430:88–93.
21. Hahn MW, Kern AD. Comparative genomics of centrality and essentiality in three eukaryotic protein-interaction networks. Mol Biol Evol. 2005;22:803–6. 22. Kaplow IM, Singh R, Friedman A, Bakal C, Perrimon N, Berger B. RNAiCut:
automated detection of significant genes from functional genomic screens. Nat Methods. 2009;6:476–7.
23. Tu Z, Argmann C, Wong KK, Mitnaul LJ, Edwards S, Sach IC, et al. Integrating siRNA and protein-protein interaction data to identify an expanded insulin signaling network. Genome Res. 2009;19:1057–67.
24. Wang L, Tu Z, Sun F. A network-based integrative approach to prioritize reliable hits from multiple genome-wide RNAi screens in Drosophila. BMC Genomics. 2009;10:220.
25. Ma X, Chen T, Sun F. Integrative approaches for predicting protein function and prioritizing genes for complex phenotypes using protein interaction networks. Brief Bioinform. 2014;15:685–98.
26. Roadmap Epigenomics C, Kundaje A, Meuleman W, Ernst J, Bilenky M, Yen A, et al. Integrative analysis of 111 reference human epigenomes. Nature. 2015;518:317–30.
27. Consortium EP, Bernstein BE, Birney E, Dunham I, Green ED, Gunter C, et al. An integrated encyclopedia of DNA elements in the human genome. Nature. 2012;489:57–74.
29. Li W, Xu H, Xiao T, Cong L, Love MI, Zhang F, et al. MAGeCK enables robust identification of essential genes from genome-scale CRISPR/Cas9 knockout screens. Genome Biol. 2014;15:554.
30. Franceschini A, Szklarczyk D, Frankild S, Kuhn M, Simonovic M, Roth A, et al. STRING v9.1: protein-protein interaction networks, with increased coverage and integration. Nucleic Acids Res. 2013;41:D808–15.
31. Jiang P, Singh M. SPICi: a fast clustering algorithm for large biological networks. Bioinformatics. 2010;26:1105–11.
32. Eisenberg E, Levanon EY. Human housekeeping genes are compact. Trends Genet. 2003;19:362–5.
33. Milo R, Shen-Orr S, Itzkovitz S, Kashtan N, Chklovskii D, Alon U. Network motifs: simple building blocks of complex networks. Science. 2002;298:824–7.
34. Chuang HY, Lee E, Liu YT, Lee D, Ideker T. Network-based classification of breast cancer metastasis. Mol Syst Biol. 2007;3:140.
35. Hofree M, Shen JP, Carter H, Gross A, Ideker T. Network-based stratification of tumor mutations. Nat Methods. 2013;10:1108–15.
36. Tang Q, Chen Y, Meyer C, Geistlinger T, Lupien M, Wang Q, et al. A comprehensive view of nuclear receptor cancer cistromes. Cancer Res. 2011;71:6940–7.
37. Wang S, Sun H, Ma J, Zang C, Wang C, Wang J, et al. Target analysis by integration of transcriptome and ChIP-seq data with BETA. Nat Protoc. 2013;8:2502–15.
38. Wernick NL, Chinnapen DJ, Cho JA, Lencer WI. Cholera toxin: an intracellular journey into the cytosol by way of the endoplasmic reticulum. Toxins (Basel). 2010;2:310–25.
39. Jiang P, Freedman ML, Liu JS, Liu XS. Inference of transcriptional regulation in cancers. Proc Natl Acad Sci U S A. 2015;112:7731–6.
40. Goh KI, Cusick ME, Valle D, Childs B, Vidal M, Barabasi AL. The human disease network. Proc Natl Acad Sci U S A. 2007;104:8685–90. 41. Menche J, Sharma A, Kitsak M, Ghiassian SD, Vidal M, Loscalzo J, et al.
Disease networks. Uncovering disease-disease relationships through the incomplete interactome. Science. 2015;347:1257601.
42. Greene CS, Krishnan A, Wong AK, Ricciotti E, Zelaya RA, Himmelstein DS, et al. Understanding multicellular function and disease with human tissue-specific networks. Nat Genet. 2015;47:569–76.
43. Wang X, Wei X, Thijssen B, Das J, Lipkin SM, Yu H. Three-dimensional reconstruction of protein networks provides insight into human genetic disease. Nat Biotechnol. 2012;30:159–64.
44. Hatanpaa KJ, Burma S, Zhao D, Habib AA. Epidermal growth factor receptor in glioma: signal transduction, neuropathology, imaging, and
radioresistance. Neoplasia. 2010;12:675–84.
45. Brennan CW, Verhaak RG, McKenna A, Campos B, Noushmehr H, Salama SR, et al. The somatic genomic landscape of glioblastoma. Cell. 2013;155:462–77. 46. Vogelstein B, Papadopoulos N, Velculescu VE, Zhou S, Diaz Jr LA, Kinzler KW.
Cancer genome landscapes. Science. 2013;339:1546–58.
47. Gravendeel LA, Kouwenhoven MC, Gevaert O, de Rooi JJ, Stubbs AP, Duijm JE, et al. Intrinsic gene expression profiles of gliomas are a better predictor of survival than histology. Cancer Res. 2009;69:9065–72.
48. Zhu VF, Yang J, Lebrun DG, Li M. Understanding the role of cytokines in Glioblastoma Multiforme pathogenesis. Cancer Lett. 2012;316:139–50. 49. Shannon P, Markiel A, Ozier O, Baliga NS, Wang JT, Ramage D, et al.
Cytoscape: a software environment for integrated models of biomolecular interaction networks. Genome Res. 2003;13:2498–504.
50. Law V, Knox C, Djoumbou Y, Jewison T, Guo AC, Liu Y, et al. DrugBank 4.0: shedding new light on drug metabolism. Nucleic Acids Res. 2014;42:D1091–7.
51. Taylor TE, Furnari FB, Cavenee WK. Targeting EGFR for treatment of glioblastoma: molecular basis to overcome resistance. Curr Cancer Drug Targets. 2012;12:197–209.
52. Pyonteck SM, Akkari L, Schuhmacher AJ, Bowman RL, Sevenich L, Quail DF, et al. CSF-1R inhibition alters macrophage polarization and blocks glioma progression. Nat Med. 2013;19:1264–72.
53. Ehtesham M, Winston JA, Kabos P, Thompson RC. CXCR4 expression mediates glioma cell invasiveness. Oncogene. 2006;25:2801–6. 54. Sun L, Hui AM, Su Q, Vortmeyer A, Kotliarov Y, Pastorino S, et al. Neuronal
and glioma-derived stem cell factor induces angiogenesis within the brain. Cancer Cell. 2006;9:287–300.
55. Schwikowski B, Uetz P, Fields S. A network of protein-protein interactions in yeast. Nat Biotechnol. 2000;18:1257–61.
56. Hishigaki H, Nakai K, Ono T, Tanigami A, Takagi T. Assessment of prediction accuracy of protein function from protein–protein interaction data. Yeast. 2001;18:523–31.
57. Sharan R, Ulitsky I, Shamir R. Network-based prediction of protein function. Mol Syst Biol. 2007;3:88.
58. Warde-Farley D, Donaldson SL, Comes O, Zuberi K, Badrawi R, Chao P, et al. The GeneMANIA prediction server: biological network integration for gene prioritization and predicting gene function. Nucleic Acids Res.
2010;38:W214–20.
59. Sur S, Pagliarini R, Bunz F, Rago C, Diaz Jr LA, Kinzler KW, et al. A panel of isogenic human cancer cells suggests a therapeutic approach for cancers with inactivated p53. Proc Natl Acad Sci U S A. 2009;106:3964–9. 60. Rolland T, Tasan M, Charloteaux B, Pevzner SJ, Zhong Q, Sahni N, et al. A
proteome-scale map of the human interactome network. Cell. 2014;159:1212–26.
61. Seok J, Xu W, Gao H, Davis RW, Xiao W. JETTA: junction and exon toolkits for transcriptome analysis. Bioinformatics. 2012;28:1274–5.
62. Wang H, Zou J, Zhao B, Johannsen E, Ashworth T, Wong H, et al. Genome-wide analysis reveals conserved and divergent features of Notch1/RBPJ binding in human and murine T-lymphoblastic leukemia cells. Proc Natl Acad Sci U S A. 2011;108:14908–13.
Submit your next manuscript to BioMed Central and take full advantage of:
• Convenient online submission
• Thorough peer review
• No space constraints or color figure charges
• Immediate publication on acceptance
• Inclusion in PubMed, CAS, Scopus and Google Scholar
• Research which is freely available for redistribution