Influence of Biodiesel-Diesel Blend with Ethanol As
Additive on Exhaust Gas Emission with
Optimization by Combined Response Surface
Methodology and Genetic Algorithm
Atul G. Londhekar1, S. C. Kongre2
1
Rajiv Gandhi Institute of Technology, Mumbai, India
2
ASP Pipri, Wardha, India
Abstract: In this study, multi-objective optimization of emission parameters has been conducted with combination of response surface methodology (RSM) and Genetic algorithm (GA) on single cylinder four stroke diesel engine using Karanja biodiesel, ethanol as additive and diesel blend as fuel. The exhaust gas emission or output variables are HC (ppm), CO (% vol.), NOx (ppm) and CO2 (% vol.). The input variables were biodiesel (10-20% in four level), Ethanol (0-20% in five level) and load (0-5kg
in six level) at constant speed of 1500 rpm. Firstly, experiment is performed in three stages i.e. with diesel, biodiesel-diesel blend and then biodiesel-additive-diesel blended fuel. Then analysis of variance (AVOVA) is done by RSM with Design Expert software, where it gives quadratic regression equation which will utilized by GA to obtain optimal solution. GA is performed by using Matlab 2016a software. GA gives Pareto optimal solution containing 18 set. For validation, three values were selected and performed experiment on the same. On comparison, it gives 3-8% error. So, this combination of methods will helpful in reduction of number of experiment effectively. This study gives approach towards utilization of non-edible oil with addition of additive. The developed model and modelling techniques can be used as helpful tool in design and optimization of biodiesel-ethanol-diesel blended fuel with effective emission characteristics.
Keywords: RSM,GA ,AVOVA, Biodiesel, MOGA
I. INTRODUCTION
alcohol addition to blend. The studies carried for analysing effect of ethanol on different biodiesel blend with diesel shows improved emission [13-16].On targeting the optimal characteristics, experimentation work will be increased, due to experimentation at different blend with varying other input parameter simultaneously, which bring cost factor and time factor. To reduce effort of experimentation, artificial intelligence and design of experiment techniques were implemented by researcher [9]. Kiani et al. [17] studied application of artificial neural network (ANN) for prediction of performance parameter and emission characteristics of spark ignition engine. Ganapathy et al. [18] carried optimization of performance parameters with blend of Jatropha biodiesel and diesel by using RSM. Bojan et al. [20] developed RSM model for optimization of biodiesel production from high free fatty acid Jatrophacurcas oil. So, with optimal factors predicted model results matched with experimental yield result i.e. 80.32 +/-0.82%. So, these studies show advantage over experimentation in terms of prediction and optimization of parameters with lesser runs of experiment. Some more studies which utilizes combination of techniques to obtain more accurate result as compared to experiment. Dhingra et al. [23] carried out optimization of Karanja biodiesel yield based on input, namely, molar ratio, reaction time, reaction temperature, catalyst concentration and mixing speed done by using combining RSM and GA. The optimized result is confirmed by re-experimentation on optimized input as of RSM and GA, showing good agreement with developed model. Similar model with combination of RSM and artificial neural network with GA have been developed for optimization [24-25]. Dhingra et al. [26] developed non-dominated sorting genetic algorithm-II for prediction of performance parameter and emission characteristics. With prediction, optimization is carried with specific objective of minimization or maximization of output variable. So, this technique is used to optimize the emission variables. Further, Hiroyasu et al. [27] developed multi-objective genetic algorithm (MOGA) and phenomenological model for reduction of emission and fuel consumption in heavy duty diesel engine. Since, MOGA requires large number of iteration. So, phenomenological model used to simulate engine combustion with reduced calculation cost. In current
work, RSM and GA is combined to optimize the exhaust gas emission i.e. HC (ppm), CO (% by volume), NOX (ppm) and CO2 (%
by volume) with Karanja as biodiesel, ethanol as additive and diesel blend in single cylinder compression ignition diesel engine. This type of study is not previously carried out which involve ternary fuel. So, this study will help in analysis of exhaust gas emission with minimum number of experiments.
II. METHODOLOGY
A. Experimental setup
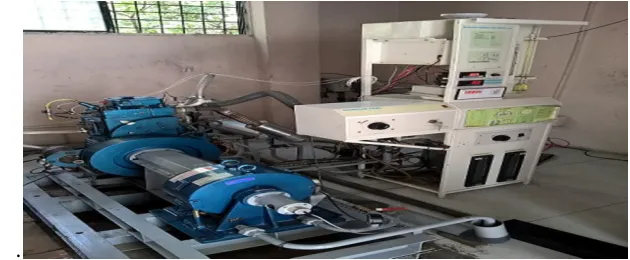
The schematic of experimental setup is shown in Figure 1 which consist of single cylinder four stroke compression ignition diesel engines, eddy current dynamometer, exhaust gas analyser, fuel tank as major component. Table 1 shows technical specification of
test engine. For measurement of HC, CO, NOX, CO2 emissions, KEG-500 model 5-gas analyser of Sincro company has been used.
The eddy current dynamometer used was manufactured by Tecnomech (Model TMEC-10). Maximum power of eddy current dynamometer is 7.5 KW and revolution per minute in range of 1500-1600 rpm. The unmodified diesel engine is initially started by hand cranking with no load. The diesel engine is allowed to run for nearly 15 min to obtain steady condition. While taking readings, all the ests were conducted twice and average of same taken for further analysis to accomplish greater accuracy.
Experiment was performed in three parts with diesel, biodiesel and ethanol blend as fuel. In first part, the test has been conducted with diesel fuel with varying load in range of 0-5 kg. In second part Karanja biodiesel and diesel blend as fuel is used. The biodiesel is blended with diesel in percentage of total volume of fuel i.e. 10%, 15%, 18% and 20%. The tests performed with varying load in range of 0-5kg on different blends as BD10, BD15, BD18 and BD20. In third part, Karanja biodiesel, ethanol as additive and diesel fuel blend was used. Test is performed with BD10+E10, BD15+E15, BD18+E18 and BD20+E20, load is varied in range of 0-5kg on different blend ratio
[image:3.612.146.461.589.719.2].
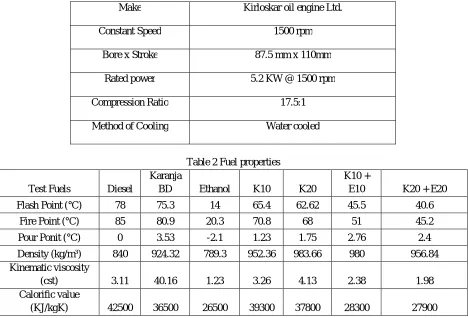
Table 1 Technical specification of Test engine
Make Kirloskar oil engine Ltd.
Constant Speed 1500 rpm
Bore x Stroke 87.5 mm x 110mm
Rated power 5.2 KW @ 1500 rpm
Compression Ratio 17.5:1
Method of Cooling Water cooled
Table 2 Fuel properties
Test Fuels Diesel
Karanja
BD Ethanol K10 K20
K10 +
E10 K20 + E20
Flash Point (°C) 78 75.3 14 65.4 62.62 45.5 40.6
Fire Point (°C) 85 80.9 20.3 70.8 68 51 45.2
Pour Ponit (°C) 0 3.53 -2.1 1.23 1.75 2.76 2.4
Density (kg/m³) 840 924.32 789.3 952.36 983.66 980 956.84
Kinematic viscosity
(cst) 3.11 40.16 1.23 3.26 4.13 2.38 1.98
Calorific value
(KJ/kgK) 42500 36500 26500 39300 37800 28300 27900
B. Fuel used
In the experimentation, base fluid as diesel blended with Karanja biodiesel and ethanol as additive are used. Biodiesel and additive ethanol is purchased from SVM Agro Processor, Nagpur, India. The blended fuel properties were tested in Geo-Chem Laboratories Pvt. Ltd., India, which is presented in Table 2. The density is measured by ASTM D-4052 method. Similarly, Kinematic viscosity, Flash point and Pour point were measured by ASTM D-44, ASTM D-93 and ASTM D-97 method respectively.
C. Design of experiments
The input parameters were Karanja biodiesel, ethanol and load with different levels is shown in Table 3. The number of replicates were three to obtain more accurate outputs. The outcome of experiment was HC (in ppm), CO (% of total volume of exhaust gas), NOX (in ppm) and CO2 (% of total volume of exhaust gas). For all reading, speed is kept constant at 1500 rpm. The total number of runs recorded is 54.
D. Response surface method (RSM)
RSM is an aggregation of mathematical and statistical techniques which are used for the modelling and analysis of problems. Here, the response of interest or output is influenced by several variables and the aim is to optimize this response. In RSM, approximation between response variable and input parameters is sated firstly. For this, model second order quadratic polynomial equation is formed, can be seen in [18], to fit response using input variables. After fitting developed model is directed to testing such as, significance test with ANOVA (validation). The same model equation is, also, used to calculate precision index values such as coefficient of determination (R2), adjusted R2, predicated R2. The Fisher’s test (F-value) for ANOVA was conducted on experimental data to determine the statistical significance of the model, while p-value is probability of getting results equal to actually observer value [31].
variables with polynomial mode. No transformation is selected, since ratio of maximum to minimum value of parameters were less than 10.
E. Genetic Algorithm (GA)
GA is algorithm that simulate heredity and evolution of living organisms. GAs were invented by John Holland and developed by him and his students and colleagues. GA is multi-point search method and probabilistic. It can be applied to both continuous and discrete function. While designing diesel engine, it is difficult to perform parameter search with conventional method like response surface method, gradient method, etc. So, GA can be applied in this situation [27]. This algorithm starts with a set of solutions as population. Solutions from one population are taken and utilize to form a new population. This is with assumption that the new population will be better than the old one. Solutions which are to be selected to form new solutions are selected based on their fitness function. This process is repeated until the best solution is obtained [30]. The steps involved during optimization are starting solution with random population, defining fitness function, selection of new population based on selection function, crossover function and mutation, replace the old population and test new one against fitness function. It has been performed by using optimization tool of Matlab 2016a software.
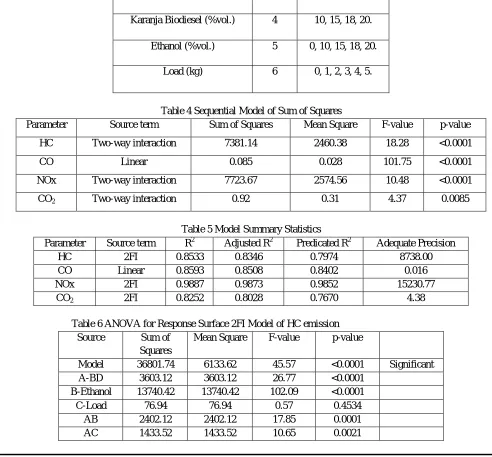
Table 3 Detailing of input variables
Variable Levels Detailing
Karanja Biodiesel (%vol.) 4 10, 15, 18, 20.
Ethanol (%vol.) 5 0, 10, 15, 18, 20.
[image:5.612.55.547.295.752.2]Load (kg) 6 0, 1, 2, 3, 4, 5.
Table 4 Sequential Model of Sum of Squares
Parameter Source term Sum of Squares Mean Square F-value p-value
HC Two-way interaction 7381.14 2460.38 18.28 <0.0001
CO Linear 0.085 0.028 101.75 <0.0001
NOx Two-way interaction 7723.67 2574.56 10.48 <0.0001
CO2 Two-way interaction 0.92 0.31 4.37 0.0085
Table 5 Model Summary Statistics
Parameter Source term R2 Adjusted R2 Predicated R2 Adequate Precision
HC 2FI 0.8533 0.8346 0.7974 8738.00
CO Linear 0.8593 0.8508 0.8402 0.016
NOx 2FI 0.9887 0.9873 0.9852 15230.77
CO2 2FI 0.8252 0.8028 0.7670 4.38
Table 6 ANOVA for Response Surface 2FI Model of HC emission
Source Sum of
Squares
Mean Square F-value p-value
Model 36801.74 6133.62 45.57 <0.0001 Significant
A-BD 3603.12 3603.12 26.77 <0.0001
B-Ethanol 13740.42 13740.42 102.09 <0.0001
C-Load 76.94 76.94 0.57 0.4534
AB 2402.12 2402.12 17.85 0.0001
BC 4807.42 4807.42 35.72 <0.0001
Residual 6325.59 134.59
[image:6.612.99.517.118.687.2]Cor. Total 43127.33
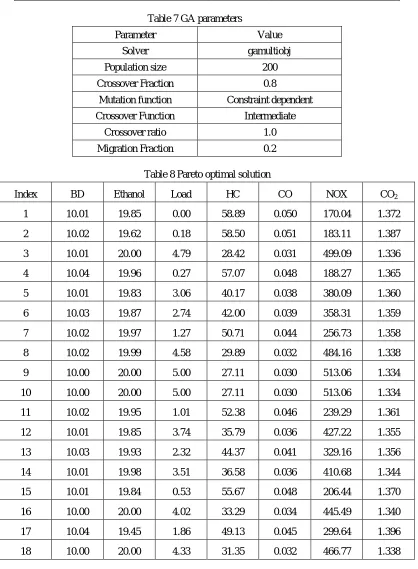
Table 7 GA parameters
Parameter Value
Solver gamultiobj
Population size 200
Crossover Fraction 0.8
Mutation function Constraint dependent
Crossover Function Intermediate
Crossover ratio 1.0
[image:6.612.99.516.292.681.2]Migration Fraction 0.2
Table 8 Pareto optimal solution
Index BD Ethanol Load HC CO NOX CO2
1 10.01 19.85 0.00 58.89 0.050 170.04 1.372
2 10.02 19.62 0.18 58.50 0.051 183.11 1.387
3 10.01 20.00 4.79 28.42 0.031 499.09 1.336
4 10.04 19.96 0.27 57.07 0.048 188.27 1.365
5 10.01 19.83 3.06 40.17 0.038 380.09 1.360
6 10.03 19.87 2.74 42.00 0.039 358.31 1.359
7 10.02 19.97 1.27 50.71 0.044 256.73 1.358
8 10.02 19.99 4.58 29.89 0.032 484.16 1.338
9 10.00 20.00 5.00 27.11 0.030 513.06 1.334
10 10.00 20.00 5.00 27.11 0.030 513.06 1.334
11 10.02 19.95 1.01 52.38 0.046 239.29 1.361
12 10.01 19.85 3.74 35.79 0.036 427.22 1.355
13 10.03 19.93 2.32 44.37 0.041 329.16 1.356
14 10.01 19.98 3.51 36.58 0.036 410.68 1.344
15 10.01 19.84 0.53 55.67 0.048 206.44 1.370
16 10.00 20.00 4.02 33.29 0.034 445.49 1.340
17 10.04 19.45 1.86 49.13 0.045 299.64 1.396
Figure 2 Comparison of HC emission of biodiesel-diesel blend with pure diesel.
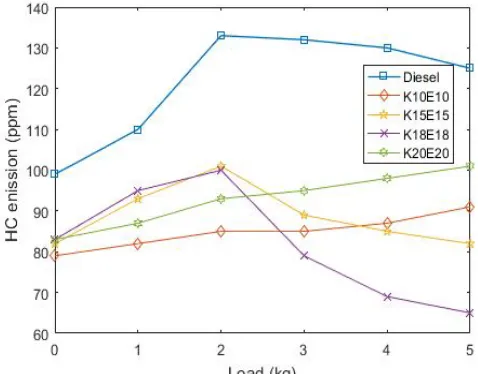
[image:7.612.186.425.304.491.2]Figure 3 Comparison of HC emission of biodiesel-additive-diesel blend with pure diesel.
Figure 5 Comparison of CO emission of biodiesel-diesel blend with pure diesel.
Figure 6 Comparison of CO emission of biodiesel-additive-diesel blend with pure diesel.
[image:8.612.168.446.293.444.2]Figure 8 Comparison of NOx emission of biodiesel-diesel blend with pure diesel.
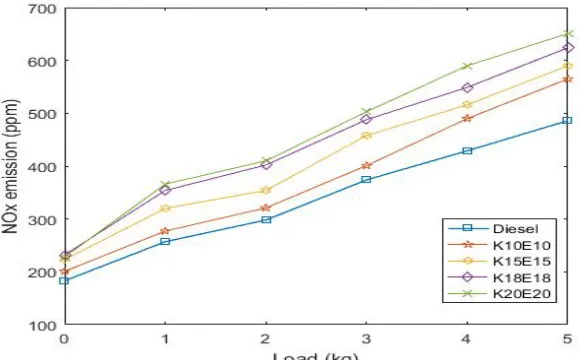
[image:9.612.160.450.311.491.2]Figure 9 Comparison of NOx emission of biodiesel-additive-diesel blend with pure diesel.
Figure 11 Comparison of CO2 emission of biodiesel-diesel blend with pure diesel.
Figure 12 Comparison of CO2 emission of biodiesel-additive-diesel blend with pure diesel.
[image:10.612.124.489.496.720.2]III. RESULTS AND DISCUSSION A. HC emission
The variation of HC emission with blend biodiesel-diesel and biodiesel-ethanol-diesel as fuel is shown in Figure 3 and Figure 4 respectively. So, with biodiesel HC emission is increased. For blend K15, K18, K20, it increases with increasing load. For blend with biodiesel-ethanol, the HC emission is decreased with all blend. Exception K18+E18 blend, which increased with load initially and then decreased. The main reason for HC emission is unburned fuel blend due to insufficient combustion so with addition of ethanol this emission can be reduced effectively. From result of sum of squares, as shown in Table 4, it can be seen that among the effect of linear, interaction, quadratic, cubic factors; interaction variables are effective. It can be decided based on p-value and F-value which is provided from analysis of variance (ANOVA). The p-value less than 0.001 is significant in most of the cases. The contour plot of HC emission with biodiesel and ethanol is shown in Figure 5. For evaluation of model, deciding criteria are R2, Adjusted R2, which is shown in Table 5. So, interaction model is suggested by software. ANOVA for response surface model is shown in Table 6, since interaction variables effect are significant, so quadratic and cubic effect have been aliased. As it can be seen from Table 6 developed model is significant. The Quadratic Regression equation obtained for HC emission is given as
HC = 119.63473 - 0.90943 × BD - 4.81021 × Ethanol + 2.85834 × Load + 0.22081 × BD × Ethanol + 0.53320 × BD × Load - 0.72371 × Ethanol × Load…………..………..(1)
B. CO emission
CO emission is toxic in nature and has to be controlled. CO emissions are results from incomplete combustion i.e. due to deficiency of oxygen in blended fuel. The variation of HC emission with blend biodiesel-diesel and biodiesel-ethanol-diesel as fuel is shown in Figure 6 and Figure 7 respectively. In first case blend with biodiesel, CO emission increases with compare to pure diesel case. Also, with increasing blend volume, there is decrease in CO emission. In second case with biodiesel-ethanol, CO emission decreased with compare to diesel as fuel. For K18+E18 blend, observed the lowest possible emission in range of 3-5kg.From results of sequential model of sum of squares and model summary parameters in Table 4 and Table 5 respectively, it is clear that linear model is significant over quadratic and interaction model. ANOVA model developed for CO emission, is similar to HC emission as shown in Table 6 with linear model is significant a compare to quadratic, interaction and cubic term. The contour plot of CO emission versus ethanol and load is shown in Figure 8, which gives same interpretation. The quadratic regreesion equation obtained from RSM for CO emission is
CO = 0.15955 + 1.01489E-003 × BD - 7.60932E-003 × Ethanol - 3.71995E-003 × Load + 1.57767E-004 × BD × Ethanol + 2.21993E-004 × BD × Load - 1.17554E-004 × Ethanol × Load………..(2)
C. NOx emission
uring combustion of fuel in diesel engine, it requires highly compressed air which is mainly consists of oxygen and nitrogen. Since nitrogen do not react with oxygen at temperature below 1600°C in the cylinder resulting NOX emission (NO and NO2 emission).With experimental data shown for biodiesel and biodiesel-ethanol blend with diesel in Figure 9 and Figure 10 respectively, NOx emission have been increased as compare to pure diesel for both cases. With results observed from sequential model of sum of squares and model summary statistics results in Table 4 and Table 5 respectively, the interation model is significant over other. The overall model is significant. The contour plot of NOX emission versus biodiesel and load is shown in Figure 11. The quadratic regression equation obtained from RSM for NOX emission is given as
NOX = 178.47765 + 4.92102 × BD - 5.06672 × Ethanol + 62.45842 × Load + 0.21467 × BD × Ethanol + 1.03307 × BD × Load - 0.20147 × Ethanol × Load………….(3)
D. CO2 emission
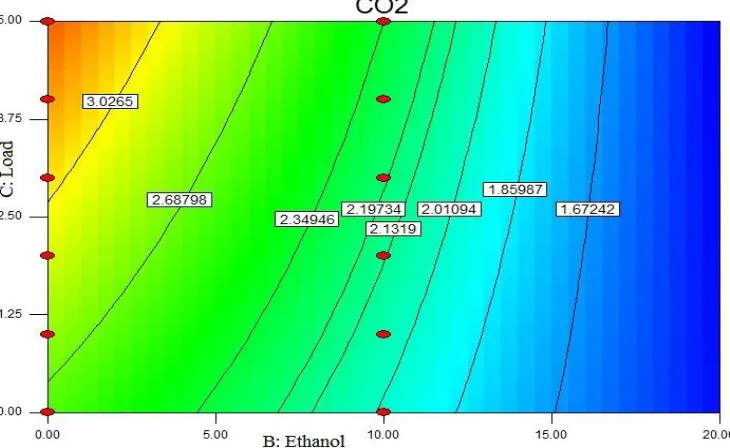
As shown in Figure 12 and Figure 13 shows CO2 emission for biodiesel and biodiesel-ethanol blend with diesel as fuel respectively. In first case with biodiesel blend, for K10 and K15 blend, CO2 emission is decreasing as compare to diesel. For K18 and K20 blend, it is increasing with load. In second case with biodiesel-ethanol blend, for all blend CO2 emission is reduced as compare to diesel fuel. Lowest value of CO2 emission is observed with K18+E18 and also decreasing nature with increasing load.
CO2 = 2.64541 - 1.49320E-003 × BD - 0.091328 × Ethanol + 0.11163 × Load + 2.78926E-003 × BD × Ethanol + 3.52806E-003 × BD × Load - 7.62413E-003 × Ethanol × Load………….(4)
E. Multi-objective Optimization by GA
The objective is to minimize emission,namely HC, CO, NOX and CO2 emission, from exhaust gas in single cylinder CI engine with Karanja biodiesel and ethanol additive blend with diesel as fuel. The parameters used to perform is shown in Table 16. Among these emission, NOx emission have selected for importance as compare to other. The Pareto optimal soilution ontained by GA is shown in Table 17. Also, Distance plot and spread plot is shown in Figure respectively obtained by software.For validation, three rows selected from Pareto optimal solution as highlited in Table 17. The input variable were adjusted to these values and average of five times reading noted. It shows 3-8 % error. So, it shows good agreement with these input variables. So, best solution obatined ad 10.02 % of biodiesel, 19.97 % of ethanol and 1.27 kg of load at constant speed of 1500 rpm. The response were 50.71 ppm, 0.044 % vol., 256.7 ppm and 1.358 % for HC, CO, NOX and CO2 emission respectively.
REFERENCE
[1] M. Takase, T. Zhao, M. Zhang, Y. Chen, H. Liu, L. Yang, X. Wu, “An expatiate review of neem, jatropha, rubber and Karanja as multipurpose non-edible biodiesel resources and comparison of their fuel, engine and emission properties”. Renewable and Sustainable Energy Reviews, Vol. 43, 2015, 495–520. [2] V. Kesari, L. Rangan, “Development of Pongamiapinnata as an alternative biofuel crop-current status and scope of plantations in India". Journal of Crop
Science and Biotechnology, Vol. 13, no. 3, 2010, 127-137.
[3] J.H. Ng, H.K. Ng, S. Gan, "Advances in biodiesel fuel for application in compression ignition engines". Clean technologies and environmental policy, Vol. 12, no. 5, 2010, 459-493.
[4] R. Kumar, M. Sharma, S.S. Ray, A.S. Sarpal, A.A. Gupta, D.K. Tuli, R. Sarin, R.P. Varma, N.R. Raje, “Biodiesel from Jatrophacurcas and Pongamia Pinnate”. No. 2004-28-0087, SAE Technical Paper, 2004.
[5] C. Vijayakumar, M. Ramesh, Murugesan, N. Panneerselvam, D. Subramaniam, M. Bharathiraja, “Biodiesel from plant seed oils as an alternate fuel for compression ignition engines-a review”. Environmental science and pollution research international, Vol. 23, no. 24, 2016, 24711-24730.
[6] A. K. Agarwal, K. Rajamanoharan, “Experimental investigations of performance and emissions of Karanja oil and its blends in a single cylinder agricultural diesel engine”. Applied Energy, Vol. 86, no.1, 2009, 106–112.
[7] K. Sivaramakrishnan, P. Ravikumar, “Optimization of operational parameters on performance and emissions of a diesel engine using biodiesel”. International Journal of Environmental Science and Technology, Vol. 11, no. 4, 2014, 949.
[8] D. M. Korres, Arg. Painesaki, D. Karonis and E. Lois, S. Kalligeros, “Use of Ethanol along with Biodiesel in Diesel and Jet Fuels on a Stationary Diesel Engine”. SAE technical paper, 2005-01-3676.
[9] L. Pidol, B. Lecointe, L. Pesant, N. Jeuland, “Ethanol as a Diesel Base Fuel -Potential in HCCI Mode”. SAE technical paper, 2008-01-2506.
[10]J. R. Sodré, M. A. Luciano, O. S. Valente, “Solubility analysis of ethanol and diesel oil with biodiesel (b7) blends”. SAE Technical Paper Series, 2015-36-0403.
[11]A. Datta, B. K. Mandal, “A numerical study on the performance, combustion and emission parameters of a compression ignition engine fuelled with diesel, palm stearin biodiesel and alcohol blends”. Clean Technologies and Environmental Policy, Vol. 19, no. 1, 2017, 157-173.
[12]J. Krahl, S. Tanugula, H. Hopf, “Diesel Fuel Additives to Reduce NOx Emissions from Diesel Engines Operated on Diesel and Biodiesel Fuels by SNCR”. SAE technical paper, 2010-01-2280.
[13]B. Baiju, M.K. Naik, L.M. Das, “A comparative evaluation of compression ignition engine characteristics using methyl and ethyl esters of Karanja oil”. Renewable energy, Vol. 34, no. 6, 2009, 1616-1621.
[14]N. Kumar, H. S. Pali, “Effects of n-Butanol Blending with Jatropha Methyl Esters on Compression Ignition Engine”. Arabian Journal for Science and Engineering, Vol. 11, no. 41, 2016, 4327-4336.
[15]T. Shudo, A. Fujibe, M. Kazahaya, Y. Aoyagi, H. Ishii, Y. Goto, A. Noda, “The Cold Flow Performance and the Combustion Characteristics with Ethanol Blended Biodiesel Fuel”. SAE technical paper series, 2005-01-3707.
[16]V. Vibhanshu, N. Kumar, C. Mishra, S. Sinha, H. S. Pali, S. Bansal, “Experimental Investigation of Diesel Engine Fueled with Jatropha Oil Blend with Ethanol”. SAE technical paper series, 2013-24-0105.
[17]M. K. D. Kiani, B. Ghobadian, T. Tavakoli, A.M. Nikbakht, G. Najafi, “Application of artificial neural networks for the prediction of performance and exhaust emissions in SI engine using ethanol-gasoline blends”. Energy, Vol. 35, no. 1, 2010, 65-69.
[18]T. Ganapathy, R. P. Gakkhar, K. Murugesan, “Optimization of performance parameters of diesel engine with Jatropha biodiesel using response surface methodology”. International Journal of Sustainable Energy, Vol. 30, No. S1, 2011, S76–90.
[19]G. Khoobbakht, G. Najafi, M. Karimi, “Optimization of operating factors and blended levels of diesel, biodiesel and ethanol fuels to minimize exhaust emissions of diesel engine using response surface methodology”. Applied Thermal Engineering, Vol. 99, 2016, 1006-1017 .
[20]S. G. Bojan, S. Chelladurai, S. K. Durairaj, “Response Surface Methodology for Optimization of Biodiesel Production from High FFA JatrophaCurcas Oil”. International Journal of Green Energy, Vol. 8, 2011, 607–617.
[21]A. Atmanlı, B. Yüksel, E. Ileri , A. D. Karaoglan, “Response surface methodology based optimization of diesel-n-butanol-cotton oil ternary blend ratios to improve engine performance and exhaust emission characteristics”. Energy Conversion and Management, Vol. 90, 2015, 383–394.
[image:12.612.39.576.254.748.2][23]S. Dhingra, G. Bhushan, K. K. Dubey, “Development of a combined approach for improvement and optimization of karanja biodiesel using response surface methodology and genetic algorithm”. Frontiers in Energy, Vol. 7, no. 4, 2013, 495–505.
[24]P. Liu, L. Fan, D. Xu, X. Ma, E. Song, “Multi-Objective Optimization of High-Speed Solenoid Valve Based on Response Surface and Genetic Algorithm”. SAE technical paper series, 2015-01-1350.
[25]E. Betiku, S. S. Okunsolawo, S. O. Ajala, O. S. Odedele, “Performance evaluation of artificial neural network coupled with generic algorithm and response surface methodology in modelling and optimization of biodiesel production process parameters from shea tree nut butter”. Renewable Energy, Vol. 76, 2015, 408-417.
[26]S. Dhingra, G. Bhushan, K. K. Dubey, “Multi-objective optimization of combustion, performance and emission parameters in a jatropha biodiesel engine using non-dominated sorting genetic algorithm-II”. Frontiers of Mechanical Engineering, Vol. 9, no. 1, 2014, 81-94.
[27]T. Hiroyasu, M. Miki, M. Kim, S. Watanabe, H. Hiroyasu, H. Miao, “Reduction of Heavy Duty Diesel Engine Emission and Fuel Economy with Multi-Objective Genetic Algorithm and Phenomenological Model”. SAE technical paper series, 2004-01-0531.
[28]S. Dhingra, K. K. Dubey, G. Bhushan, “A Polymath Approach for the Prediction of Optimized Transesterification Process Variables of Polanga Biodiesel”. Journal of the American Oil Chemists' Society, Vol. 91, no. 4, 2014, 641.
[29]S. D. Jadhav, M. S. Tandale, “Multi-objective Performance Optimization of Compression Ignition Engine Operated on MangiferaIndica Biodiesel by Applying Taguchi Grey Relational Analysis”. Waste and Biomass Valorization, Vol. 7, no. 5, 2016, 1309-1325.