ECONOMIES OF SCALE, DISTRIBUTION
COSTS AND DENSITY EFFECTS IN URBAN
WATER SUPPLY
A spatial analysis of the role of infrastructure in urban
agglomeration
Thesis submitted for the degree of Doctor of Philosophy
(Ph.D)
by
Hugh Boyd WENBAN-SMITH
Declaration
This thesis is my own work, apart from referenced quotations and
assistance specifically acknowledged.
(Signed): ……….
(H B WENBAN-SMITH)
ECONOMIES OF SCALE, DISTRIBUTION COSTS AND
DENSITY EFFECTS IN URBAN WATER SUPPLY:
A spatial analysis of the role of infrastructure in urban
agglomeration
Abstract
Economies of scale in infrastructure are a recognised factor in urban agglomeration. Less recognised is the effect of distribution or access costs. Infrastructure can be classified as: (a) Area-type (e.g. utilities); or (b) Point-type (e.g. hospitals). The former involves distribution costs, the latter access costs. Taking water supply as an example of Area-type infrastructure, the interaction between production costs and distribution costs at settlement level is investigated using data from England & Wales and the USA. Plant level economies of scale in water production are confirmed, and quantified. Water distribution costs are analysed using a new measure of water distribution output (which combines volume and distance), and modelling distribution areas as monocentric settlements. Unit distribution costs are shown to be characterised by scale economies with respect to volume but diseconomies with respect to average distance to properties. It follows that higher settlement densities reduce unit distribution costs, while lower densities raise them.
The interaction with production costs then means that (a) higher urban density (“Densification”) is characterised by economies of scale in both production and distribution; (b) more spread out settlement (“Dispersion”) leads to diseconomies in distribution; (c) “Suburbanisation” (expansion into lower density peripheral areas) lies in between, with roughly constant returns to scale, taking production and distribution together; and (d) “Constant density” expansion leads to small economies of scale. Keeping (per capita) water supply costs low thus appears to depend as much on density as size.
ECONOMIES OF SCALE, DISTRIBUTION COSTS AND
DENSITY EFFECTS IN URBAN WATER SUPPLY:
A spatial analysis of the role of infrastructure in urban
agglomeration
Contents
I. Overview: Motivation, methodology and key findings … p.11
1. Motivation
2. Research strategy
3. Methodology
4. Key findings
a. What is new in this thesis b. Water production
c. Water distribution
d. Production and distribution combined e. Wider implications of the research f. Limitations of the research
5. Outline of thesis
6. Acknowledgements
II. Infrastructure and the urban economy …
p.27
1. Defining infrastructure
2. Infrastructure and agglomeration
3. Sprawl and the cost of public services
4. Types of urban infrastructure
a. Supply characteristics b. Demand characteristics c. Network economics d. Summary
5. Water supply as a case study of urban infrastructure
6. Focus of this research
III. Methodological implications of the different characteristics of
water production and water distribution ...
p.54
1. Introduction
2. The quasi-fixity of capital
3. The (non-)separability of water production and water distribution
a. The trade-off between the costs of production and the costs of distribution
b. Separating distribution from production using production/cost functions
c. Proposed way forward
4. Defining distribution output
5. Assessing scale effects in water production and distribution
6. Treatment of leakage
8. Conclusions
IV. Economies of scale in water production: Empirical investigation
…
p.76
1. Framework for investigation
a. Cost functions: General considerations b. Cost function for water production c. Cost function for water distribution
d. Cost function for water production and distribution combined e. What about using a panel data approach?
2. Application to water production
a. Introduction b. Specification
3. Application to BWC data
a. Data issues
b. Specification and results
4. Application to AWWA data
a. Data issues
b. Specification and results
5. Using Ofwat data to differentiate between boreholes and WTWs
a. Data issues
b. Specification and results
6. Discussion of findings
V. Economies of scale and spatial costs in water distribution:
Empirical investigation
...
p.100
1. Introduction
2. Implementation of a Leontief-type production function for water
distribution
a. Measuring distribution output b. Cost function specification c. Estimating distribution elasticities
3. Application to BWC data
a. Data issues
b. Results for BWC’s 184 zones c. Results for 35 BWC “urban districts”
4. Application to Ofwat data for 11 WOCs
5. Application to AWWA data
a. Data issues b. Results
6. Implications of results
a. Basis for calculations
b. Calculations for 35 BWC urban districts c. Calculations for 11 WOCs
d. Calculations for 305 US retail only utilities e. Effect of multiple settlements
f. Derived elasticities
VI. Bringing together water production and distribution: The
volume/space trade-off in urban water supply …
p.130
1. Introduction
2. Bringing water production and distribution together: (i) BWC
a. 35 “urban districts” b. Water supply areas c. The 4 towns case
3. Bringing water production and distribution together: (ii) AWWA
a. Effect of analyzing production and distribution separately b. Comparison of results with Torres & Morrison Paul (2006)
4. Bringing water production and distribution together: (iii) WOCs
a. Water production costs for WOCs b. Water distribution costs for WOCs c. Combined costs for WOCs
d. Comparison with Stone & Webster Consultants (2004)
5. Conclusions
VII. Generalisation: Application to other urban infrastructure and
implications for urban economics
…
p.158
1. Focus of this research
2. Summary of water supply findings
3. Application to other Area-type infrastructure
a. Sewerage and sewage treatment b. Electricity supply
c. Telecommunications
4. Application to Point-type infrastructure
5. Application to transport
a. The role of density in urban transport
b. Assessing economies of scale in aviation services
6. Implications for urban economics
7. Conclusions
Appendices
…………
p.183
Appendices
A. Using the Ofwat data for water supply (England & Wales)
…
p.183
B. Estimating scale effects for utilities: A selective review of the
literature
…
p.190
1. Introduction
2. Schmalensee’s approach
3. Use of cost functions in analysis of electricity supply
4. Use of cost functions in analysis of water supply
5. Other approaches
6. Lessons from the literature surveyed
C. Asset values for water companies in England & Wales
…
p.238
D. Components of water delivered
…
p.243
E. Company level estimates of returns to scale in water production
…
p.244
F. Simplified models of water distribution
…
p.249
G. Alternative cost function estimation for water distribution (with
application to BWC zones)
…
p.263
H. Processing the BWC distribution data
…
p.269
List of Tables and Figures
Chapter I
Table 1.1: Estimated plant level returns to scale in water production
Table 1.2: Comparison of distribution cost elasticities across three data sets
Chapter II
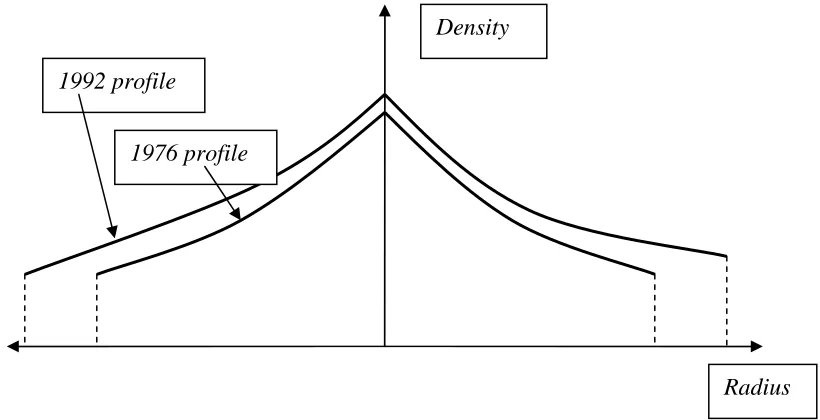
Figure 2.1: Changing profile of a typical US city (not to scale) Table 2.1: types of urban infrastructure
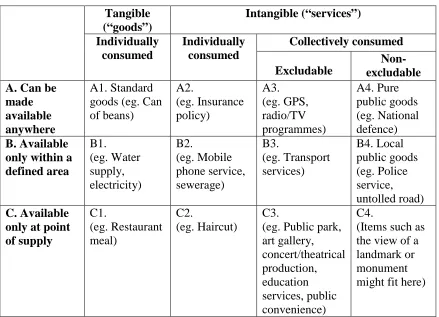
Table 2.2: A classification scheme for goods and services, based on degree of “publicness” and accessibility
Chapter III
Figure 3.1: Water supply: Should this area be served by (a) one treatment works or (b) two (or more) treatment works?
Figure 3.2: Production functions for water distribution Figure 3.3: Circular settlement
Table 3.1A: Water only companies (England & Wales, 2003)
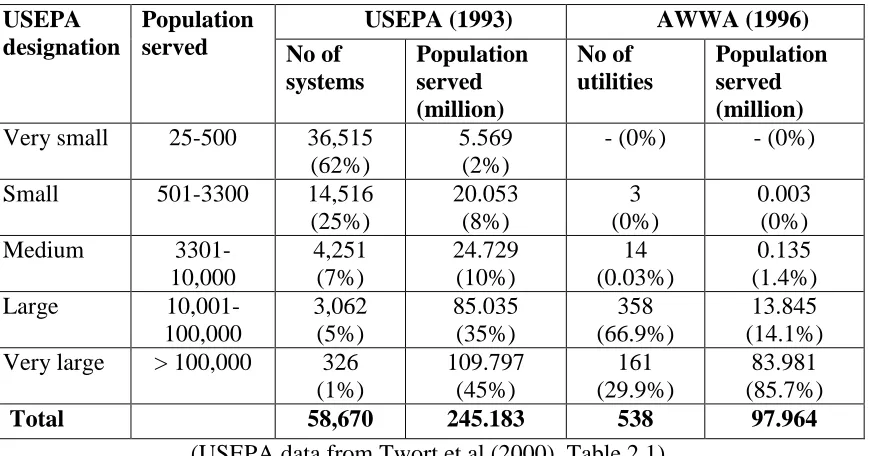
Table 3.1B: Water and Sewerage companies (England & Wales, 2003) Table 3.2: Comparison of size distribution of US water utilities
Chapter IV
Table 4.1: BWC water sources by type Table 4.2: BWC size of treatment plants
Table 4.3: BWC type of treatment and plant size Figure 4.1: BWC water treatment works average costs Table 4.4: Regression results for BWC’s WTWs using (4.10)
Figure 4.2: Sketch of relationship between average cost and size of works for boreholes and surface treatment works
Table 4.5: Selection of treatment cases from AWWA 96 data
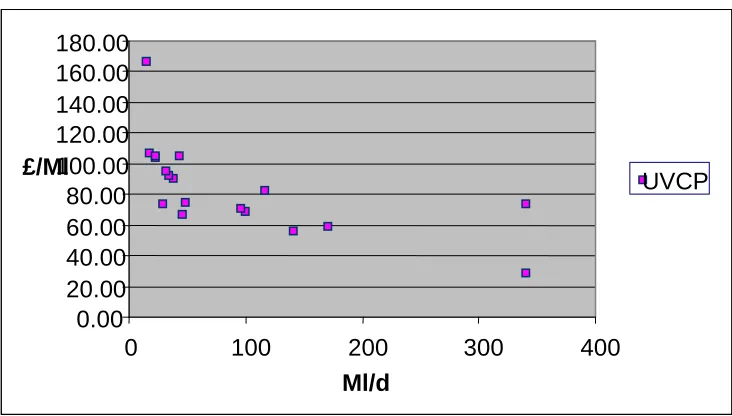
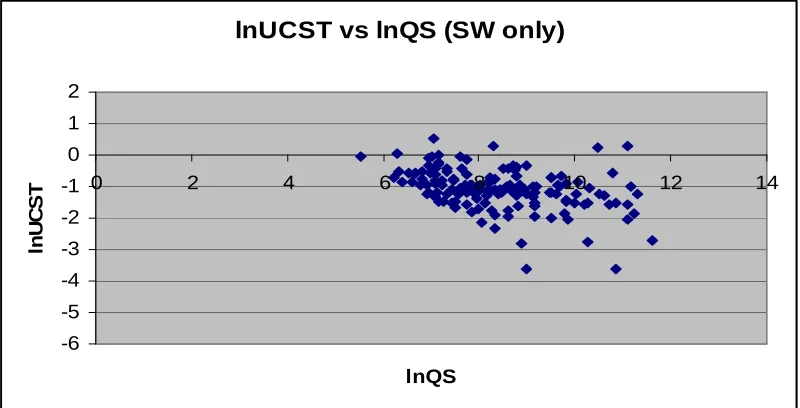
Figure 4.3: Log plot of unit water supply and treatment costs against volume supplied
Table 4.6: Regression results using (4.11), AWWA data
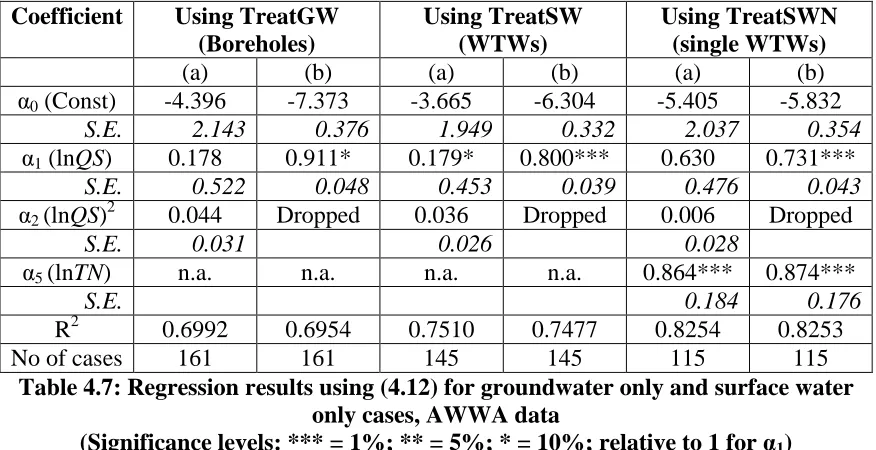
Table 4.7: Regression results using (4.12) for groundwater only and surface water only cases, AWWA data
Figure 4.4: Log plot of average operating costs against quantity produced for US boreholes
Figure 4.5: Log plot of average operating costs against quantity produced for US treatment works
Table 4.8A: Estimated data on boreholes and treatment works for WoCs Table 4.8B: Estimated data on boreholes and treatment works for WaSCs Table 4.9: Results of non-linear regressions using (4.17) and (4.20), Ofwat data Table 4.10: Estimated plant level returns to scale in water production
Chapter V
Figure 5.1: Relationship between density and settlement radius for different values of λ (not to scale)
Figure 5.3: Relationship between εA/λ and λ for 35 BWC urban districts Figure 5.4: Relationship between εN/λ and λ for 35 BWC urban districts Figure 5.5: Relationship between εA/λ, εN/λ and λ for 11 WOCs
Table 5.1: Selection of distribution cases from AWWA 96 data
Figure 5.6: Log plot of distribution output against distribution costs for 305 US retail only water utilities
Figure 5.7: Relationship between εA/λ, εN/λ and λ for 305 US retail only utilities Table 5.2: Illustrative calculations to show the effect of different values of λ and N on unit distribution costs for 35 BWC urban districts
Figure 5.8: Effect of increasing settlement size with constant λ (“suburbanisation”) (from section (c) of Table 5.2)
Table 5.3: Illustrative calculations to show the effect of different values of λ and N on unit distribution costs for 11 WOCs
Table 5.4: Illustrative calculations to show the effect of different values of λ and N on unit distribution costs for 305 US retail only utilities
Table 5.5: Calculations to show the effect of multiple settlements on unit distribution costs (using relationships estimated for BWC urban districts) Table 5.6: Spatial effect elasticities derived from calculated values in Tables 5.2, 5.3 and 5.4
Table 5.7: Comparison of distribution cost elasticities across three data sets
Chapter VI
Table 6.1: Size and density of urban areas, SE England 2001
Table 6.2: Size and density of “urban districts”, BWC supply area 2004
Table 6.3: Property densities for whole company areas, England & Wales, 2003 Table 6.4: Illustrative calculations to show the effect of different values of λ and N on water supply costs for 35 BWC urban districts, assuming a single WTW
Figure 6.1: Unit production cost (UTCP), distribution cost (UTCD) and total cost (UC(P+D)) from section (c) of Table 6.4
Figure 6.2: Unit costs of water production and distribution for 31 BWC water supply areas, plotted against number of properties
Figure 6.3: Unit costs of water production and distribution for 31 BWC distribution areas, plotted against density (properties/km mains)
Figure 6.4: Sketch of the 4 towns set-up Table 6.5: Basic data for the 4 Towns case
Table 6.6: Estimated costs for supplying different town configurations
Table 6.7: Estimates of scale and density economies for 255 US water systems (adapted from Torres & Morrison Paul (2006, p.115))
Table 6.8: Equivalence between Torres & Morrison Paul’s elasticities and those developed in Chapter V
Table 6.9: Comparison between Torres & Morrison Paul’s elasticities and those calculated from (6.10)
Table 6.10: Actual and calculated unit production costs for 10 WOCs Figure 6.5: Unit production costs, 10 WOCs (actual values)
Figure 6.6: Influence of proportion of borehole supplies on unit production costs for 10 WOCs (actual values)
Figure 6.9: Combined unit cost of water supply (production + distribution), Actuals for 10 WOCs
Figure 6.10: Combined unit cost of water supply (production + distribution), Calculated for 10 WOCs
I. OVERVIEW: MOTIVATION, METHODOLOGY AND
KEY FINDINGS
1. Motivation
Infrastructure is the Cinderella of urban economics. The accumulated investment in urban infrastructure is absolutely massive1; yet it is almost invisible in the literature. While the part played in urban agglomeration by thick labour markets, economies of scale in manufacturing, specialisation, technological spill-overs and consumption externalities have all recently attracted considerable attention, infrastructure has rather been taken for granted, providing a backdrop to the urban drama but not, seemingly, playing an active part.
Insofar as infrastructure has attracted attention, the predominant proposition is that it is characterised by economies of scale. Thus McDonald (1997), discussing urbanisation economies in his standard text remarks (pp.40-41): “Economies of scale exist in the provision of inputs that are not specific to a particular industry. An important example is the general urban infrastructure.” Similarly, Fujita (1989, p.135) observes that “… the provision of many public services and facilities (such as schools, hospitals, utilities, and highways) typically exhibits the characteristic of economies of scale.” If this is the case, one would expect infrastructure to make a large positive contribution to urban
agglomeration economies. However, the evidence for such an effect is not strong. Although some studies of urbanisation economies have found a positive effect, others have not (Eberts & McMillen (1999, pp.1460-1491) provide a review of the evidence) and there is a tendency in the theoretical literature to downplay the role of scale economies in agglomeration (Duranton & Puga (2004)).
The aim of this thesis then is to take a close look at the micro-economics of one example of urban infrastructure – water supply – with the aim of arriving at a better understanding of its contribution to agglomeration economies, and in the hope that this will throw some light on the role of infrastructure more generally. The core of the argument is that it is insufficient to focus just on economies of scale. Urban areas have a spatial aspect so that it is necessary also to take into account the costs of accessing facilities or distributing services, sometimes over considerable distances. As the analysis
of commuting costs by Arnott (1979) suggests2, these activities may well be
characterised by scale diseconomies. If then there is a trade-off between economies of scale in production and diseconomies in distribution (or access), this will weaken the influence of scale economies on agglomeration, perhaps helping to explain the
inconclusive evidence on this point. The results obtained lend some support to this line of argument but also, and perhaps more importantly, they draw attention to the role of density, with high densities reinforcing scale economies but low densities adding to costs. This suggests that the contribution of infrastructure to agglomeration, whether large or small, may be due as much to density effects as to scale effects.
2. Research strategy
Infrastructure, widely defined3, can be viewed as belonging to one of two categories: (a) Area-type, where the product of a facility needs to be distributed to consumers over a defined area (e.g. utilities); or (b) Point-type, where the services of a facility can only be consumed by users in its catchment area making their way to it (e.g. hospitals). The former involves, in addition to production costs, distribution costs; the latter, access costs. Whereas production can generally be expected to exhibit economies of scale, this is not necessarily the case for distribution (or access). There is a spatial aspect to
distribution (and access): more output means either larger service/catchment areas (with greater distances and so, potentially, higher costs) or higher densities (with savings, perhaps, from greater proximity but also the risk of higher congestion costs). There may in consequence be a trade-off between economies of scale in production and
diseconomies in distribution/access.
To investigate this question, urban water supply is taken as a case study. It is an example of Area-type infrastructure; the production technology is characterised by economies of scale and is not very complicated; and water distribution costs are high
2 He shows average commuting cost to be an increasing function of city size by considering a circular city of uniform population density, where all commuting is to a central business district and transport cost is proportional to distance. Total commuting costs are then given by:
2 3 3
0 3
2 .
3 2 . 2
. rdr R N
r TCC R
π
π
π
= ==
∫
Where R is the radius of the city and N is its population, i.e. aggregate commuting costs increase more than proportionately with population, and average commuting cost is an increasing function of N. 3
relative to production costs. The effects of interest should therefore be particularly evident in this case. The research question can then be summarised as:
The question is of interest in its own right as there is controversy about whether there really are economies of scale in this case4. But what is learnt about water supply should also shed light on the role of other types of infrastructure in urban agglomeration.
The availability of suitable data is often a critical factor in research which aims to quantify effects of this kind. In this case, use has been made of data from three primary sources:
a. Ofwat (2003a): The annual June Returns made to Ofwat by water companies in England & Wales. While there is a great deal of information in these returns, a difficulty is that the water companies are rather large, each serving numerous settlements. However, with some ingenuity, it has proved possible to use this data to infer some settlement level effects (particularly in water production);
b. AWWA (1996): A 1996 survey of its members by the American Water Works Association (AWWA). This is more suitable for our purposes in that most US water utilities are quite small, often serving a single community.
However, the information is less full than the Ofwat data (in particular, there is a lack of information on capital costs);
c. Not referenced: A large amount of highly disaggregated internal
information, provided for the purposes of this research by one of the larger companies reporting to Ofwat. This information has been particularly helpful in elucidating scale effects at local level in water distribution but has also provided corroboration for findings on water production from other sources. As the company does not wish to be publicly identified, it has been given the pseudonym Britannia Water Company (BWC) in this report.
4 An Ofwat Press Notice in 2004 was headlined “There is no evidence of general economies of scale in the water industry”. (Ofwat PN 01/04, 14 January 2004)
The Research Question
3. Methodology
The aim of the empirical work reported in Chapters IV, V and VI is to use data on water supply to throw light on the interaction between economies of scale, distribution costs and density effects at settlement level. The methodologies used, which are discussed in Chapter III, build on the approaches found in the utilities literature surveyed in Appendix B, which are mainly those of industrial economics. The topic however straddles a number of branches of economics. Initially interest was sparked by urban economics (e.g. Fujita (1989)). Other relevant fields include transport economics, the economics of public goods, the theory of public facility location (e.g. Love et al (1988)) and the urban planning literature on “sprawl”. More recently, the emergence of “The New Economic Geography” (e.g. Fujita et al (1999)) has given new life to the study of spatial economics, particularly the interaction between economies of scale and transport costs. Some of the literature in all these fields has been consulted in carrying out this research.
Generally, the utilities literature points to the use of cost functions as the way into assessing scale effects and this has been taken as a starting point. The objectives of this research however are different from those in the mainstream utilities literature in that the focus is on settlement (rather than company) level effects; and water supply is viewed as an example of urban infrastructure, rather than as a branch of manufacturing industry. Moreover, the aim is only to arrive at a reasonable characterisation of the main effects, rather than a precise estimate for any particular town or company.
The device of treating capital in the water industry as “quasi-fixed”, pioneered by Garcia & Thomas (2001), and since widely adopted, has been followed. This leads to the use of a “short term” cost function, in which operating costs are the independent variable while the fixed capital becomes in effect a control variable. In fact, in the case of water distribution, it has been taken a little further, with a Leontief-type production function for this activity postulated, when fixed capital can be dropped from the relationship.
been analysed separately (and this seems to be the case for electricity supply also). In Chapter III reasons why the methods currently in use may not fully expose distribution effects are put forward (these include non-separability, multi-collinearity and inadequate representation of the spatial aspect of distribution). In consequence, any trade-off
between economies of scale in production and diseconomies in distribution will remain obscure. Yet it is these effects that matter in the urban context. That is why it has been seen as necessary to look separately at the distribution side, which is where the spatial aspect comes into play.
In developing the analysis of water distribution, an important innovation is the introduction of a new measure of distribution output. This aims to reflect the distance over which water has been piped as well as its quantity, rather as tonne-kms or passenger-miles are used in transport studies. This measure is derived by modelling distribution areas as monocentric settlements, so as to approximate the average distance to properties (called φ) which is then multiplied by total consumption. The same output measure is appropriate when production and distribution are combined; and it would appear to be worthy of consideration, mutatis mutandis, in studies of other utilities when distribution as well as production costs are under consideration.
As other authors have noted (e.g. Stone & Webster Consultants (2004)), the inclusion of distribution means that there is more than one dimension of scale to consider. We draw particular attention to:
a. εW – the elasticity of distribution (or total) costs with respect to consumption per property;
b. εN – the elasticity of distribution (or total) costs with respect to numbers of properties;
c. εA – the elasticity of distribution (or total) costs with respect to area served.
A brief comment is appropriate here on why panel data have not been used (the point is more fully covered in Chapter IV, section 1 (e)). Although several years of Ofwat data are available, the companies reporting to Ofwat are mostly too large for present
are precisely what is of interest in this research. Therefore, the analysis has relied on cross-section analysis (for 2002/3 in the case of Ofwat data).
4. Key findings
Against this background, the ways in which this research has advanced knowledge can be summarised.
a. What is new in this thesis
• Previous work in urban economics has tended to assume economies of scale in urban infrastructure without considering the effect of distribution or access costs;
• Water supply has not previously been used as a model for urban infrastructure, despite the advantage of simple technology and reasonably accessible data; • Ofwat data for England & Wales does not seem to have been previously used to
examine the economics of water supply at settlement level, company level studies being the norm; but settlement level analysis helps understanding of what is intrinsically a spatial industry;
• There has been little previous recognition of the need to investigate water production and water distribution separately if their different characteristics are to be fully exposed;
• New estimates of plant level economies of scale in water production have been produced;
• An innovative non-linear specification has been developed to estimate scale economies for WTWs and boreholes separately by exploiting information on plant numbers and sizes in the Ofwat June Returns;
• A new measure of water distribution output has been developed which recognises the spatial dimension of water supply;
• The monocentric urban model has been adapted to capture in a compact way the different spatial characteristics of distribution areas;
• It has been found that there are scale economies in water distribution with respect to volume but diseconomies with respect to average distance to properties (and these effects have been quantified);
are (a) densification, (b) dispersion, (c) suburbanisation, and (d) constant
density);
• It is suggested that the ideas and methods developed in this thesis may be applicable, with due care, to a range of other types of infrastructure;
• An implication of the results is that density as well as size needs to be taken into account in studies of urbanisation economies: measuring city size by population alone risks missing density effects (unless density happens to be correlated with size)5.
b. Water production
It is conventional wisdom that there are economies of scale in water production. The evidence in Chapter IV confirms that this is indeed the case for water treatment works (WTWs), even when water acquisition is included. Here, by exploiting the Ofwat data on numbers and sizes of works for each company, it proved possible to develop a method to estimate plant level economies of scale for boreholes and WTWs
simultaneously, despite the absence of separate cost information on these two types of supply. The results obtained in Chapter IV for this and other cases are summarized in Table 1.1. Here the estimates are expressed as returns to scale so that a value greater than 1 indicates economies of scale. It may be seen that although the estimates vary, there is a consistent finding of economies of scale for WTWs; for boreholes however the values are not significantly greater than one.
WTWs Boreholes
Data source No of cases
Speci-fication Operating costs
Total costs
Operating costs
Total costs Ofwat companies (see Table 4.9)
All Cos 21 (4.20) 1.56** 1.28* 1.04 1.27
(S.E.) (0.16) (0.14) (0.16) (0.25)
AWWA (see Table 4.7)
TreatSW 145 (4.12) 1.25*** n.a. - -
(S.E.) (0.05)
TreatSWN 115 (4.12) 1.37*** n.a. - -
(S.E.) (0.06)
TreatGW 161 (4.12) - - 1.10* n.a.
(S.E.) (0.05)
BWC (see Table 4.4)
WTWs 15 (4.10) 1.28*** n.a. n.a. n.a.
[image:17.595.108.548.496.751.2](S.E.) (0.06)
Table 1.1: Estimated plant level returns to scale in water production (Significance levels, relative to 1: *** = 1%, ** = 5%, * = 10%)
It is important however to recognize that these are plant level findings. When two or more works are operated by a company (for example, because the size of works is limited by the capacity of the water sources; or because the communities it serves are small and/or widely separated), these scale economies will be less evident. The benefits of large scale production can therefore only be reaped where circumstances permit the operation of large WTWs, typically where there is a large population and access to high capacity water resources. Birmingham, for example, which has a population of over 1 million and access to water from the Elan Valley, is mostly supplied by a single large WTW (the Frankley works) leading to relatively low water supply costs for that city.
In Chapter VI, these estimates of returns to scale for WTWs and boreholes are
deployed in conjunction with estimates of scale effects in water distribution to explore the implications for various urban configurations. WTWs (for which economies of scale are quite large) allow a productive exploration of the trade-off between production economies and distribution diseconomies. This is not the case for borehole supplies, where the evidence for scale economies is weak (their costs apparently depending mainly on factors other than scale), serving as a reminder that even in the case of water supply, it cannot be taken for granted that there are always economies of scale in production.
c. Water distribution
Water distribution costs are at least as significant as water production costs. In the case of BWC for example, although distribution operating costs are about the same as production operating costs, distribution capital costs are about twice as large. Scale effects in distribution therefore merit careful attention.
It has already been noted that the concept of scale in water distribution has more than one dimension. As Schmalensee (1978, p.271) has remarked: “When services are delivered to customers located at many points, cost must in general depend on the entire distribution of demands over space.” The modeling and empirical estimation in
effect will be much the same whether volume or numbers of properties is used. For the service area measure, the more obvious possibilities include the actual area and length of mains. As the former will often include areas of unserviced land, the latter is preferable. However, better still would be a measure which can capture the spatial distribution of properties and this is what our measure φ aims to do. As explained earlier, it is derived by treating service areas as monocentric settlements of a size determined by the observed length of mains and property density for each area. This produces a measure of the average distance to properties, which can be applied flexibly to a wide range of actual situations. Although an approximation, it provides a versatile tool with which to represent the spatial aspect of distribution.
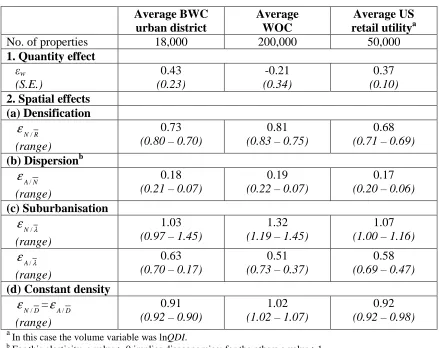
Armed with this tool, the reasonably clear results summarized in Table 1.2 below are obtained. Generally, it was found that there are scale economies in distribution with respect to volume consumed (with a coefficient of about 0.4 – a value less than 1 indicating volume scale economies) but diseconomies with respect to average distance to properties (with a coefficient of about 1 – a value greater than 0 indicating distance diseconomies) – see equation (5.19) in Chapter V. The implications for distribution costs then depend on how these influences balance out. However, as explained in Chapter V, section 2(c), the relevant elasticities cannot be directly inferred from these coefficients. Further analysis is required to separate the pure volume effect (due to variations in consumption per property) from spatial effects (due to variations in the number and location of properties).
A monocentric settlement can be approximately characterized by four parameters: d0, its density at the centre; λ, the rate at which density declines away from the centre; N, its population; and R, its radius. To assess distribution cost elasticites, four monocentric settlement scenarios with different spatial characteristics are set up6. These are:
(a) Densification7: Number of properties (N) varies, while settlement radius (R) is held constant (λ also therefore varying);
(b) Dispersion: Coefficient of dispersion (λ) varies, holding number of properties (N) constant (R also therefore varying);
(c) Suburbanisation: Number of properties (N) varies, holding λ constant (R also therefore varying);
6
Central density (d0) is taken to be 30 properties/Ha in all cases.
(d) Constant density: Number of properties (N) varies, holding density (N/A) constant (when both λ and R vary).
Distribution cost elasticities are then evaluated for an average BWC urban district (N = 18,000), an average WOC (N = 200,000) and an average US retail only water utility (N = 50,000). The outcome of this further analysis is summarised in Table 1.2, which brings together results for the quantity elasticity εw (elasticity of cost with respect to consumption per property) with the spatial elasticities from Table 5.6 in Chapter V. For εw, εN /R, εN/λ, and εN /D a value less than 1 indicates scale economies, a value greater than 1 scale diseconomies; for εA /N any value greater than 0 indicates
diseconomies. A standard error is only available for εw; in the other cases, the range of values obtained by calculation across the sample is indicated. For a fuller discussion, see Chapter V, section 6.
Average BWC urban district
Average WOC
Average US retail utilitya
No. of properties 18,000 200,000 50,000
1. Quantity effect εw (S.E.) 0.43 (0.23) -0.21 (0.34) 0.37 (0.10)
2. Spatial effects (a) Densification εN /R
(range)
0.73
(0.80 – 0.70)
0.81
(0.83 – 0.75)
0.68
(0.71 – 0.69)
(b) Dispersionb εA /N
(range)
0.18
(0.21 – 0.07)
0.19
(0.22 – 0.07)
0.17
(0.20 – 0.06)
(c) Suburbanisation εN/λ
(range)
1.03
(0.97 – 1.45)
1.32
(1.19 – 1.45)
1.07
(1.00 – 1.16)
εA/λ (range)
0.63
(0.70 – 0.17)
0.51
(0.73 – 0.37)
0.58
(0.69 – 0.47)
(d) Constant density εN /D=εA /D
(range)
0.91
(0.92 – 0.90)
1.02
(1.02 – 1.07)
0.92
(0.92 – 0.98)
a
In this case the volume variable was lnQDI.
[image:20.595.107.546.323.671.2]b For this elasticity, a value > 0 implies diseconomies; for the others a value >1.
Table 1.2: Comparison of distribution cost elasticities across three data sets
elasticities, densification and constant density expansion are also characterised by scale economies (returns to scale = 1/εN /R ≈ 1/0.7 = 1.4 and 1/εN /D ≈ 1/0.9 = 1.1
respectively). On the other hand there are diseconomies associated with dispersion and
suburbanisation. The WOC results are in reasonable agreement as regards densification
and dispersion but show higher diseconomies for suburbanisation and (small)
diseconomies for constant density – possibly a reflection of the relatively large size of the WOCs so that there are a number of subsidiary settlements around the main centre. (The reason for the negative value for εw for the WOCs, albeit with a large standard error, has not been determined8.)
d. Production and distribution combined
At the outset, it had been anticipated that while economies of scale in water production would be confirmed, diseconomies would be found in water distribution. It would follow that in urban water supply systems, a trade-off between these effects would be at work, qualifying the popular view that infrastructure services, such as water supply, are characterized only by economies of scale. In fact, a more complicated story has
emerged. Generally, it has been found that there are volume economies of scale in water distribution as well as in water production but that density effects also need to be taken into account, with low density adding substantially to distribution costs. An important feature of the situation, conditioning these results, is that water suppliers generally have to take the size and location of the settlements they serve as given. They are not able to pursue cost savings by organizing the merger or relocation of small towns or awkwardly located customers; and it is doubtful whether even in the longer term, differential water supply costs have much effect on the evolution of settlement patterns.
The results for water production and water distribution can be brought together using the same settlement scenarios: i.e (a) densification; (b) dispersion; (c) suburbanization; and (d) constant density, assuming a single large WTW of the appropriate size and constant consumption per property (see Table 6.4 in Chapter VI). Now, as numbers of properties are increased in each scenario (leading to higher volumes, given constant usage per property), the key difference is how density is affected.
• With (a) densification, because the urban boundary does not change as property numbers increase, density increases in parallel, so that volume economies
predominate in distribution as well as production. For example, unit water supply costs for a town doubled in size to 50,000 properties occupying 2,250 Ha (density 22.2 properties/Ha) will, according to these calculations, be 16.2% lower than for a town of 25,000 properties occupying the same area (density 11.1 properties/Ha), about half of the reduction coming from lower unit water production costs and half from lower unit distribution costs.
• With (b) dispersion, the number of properties does not increase, so that there is no volume effect, but the more dispersed pattern of settlement means lower density and an increasing average distance to properties, and hence higher distribution costs. For example, unit water supply costs for a town of 18,000 properties spread out over 2,090 Ha (density 8.6 properties/Ha) will be 10.8% higher than for a town of 18,000 properties occupying only 735 Ha (density 24.5 properties/Ha), all due to a 23.4% increase in unit distribution costs.
• With (c) suburbanization, the number of properties increases but because the increase is into less dense peripheral areas, average density falls and average distance to properties increases, albeit to a lesser extent than with (b). In this case, volume economies (in both production and distribution) are more or less balanced by average distance diseconomies. For example, unit supply costs for a town which has grown to 50,000 properties occupying over 20,000 Ha (density 2.4 properties/Ha) will be much the same as for the same town when it was only 15,000 properties occupying 985 Ha (density 15.2 properties/Ha) with the 25% reduction in unit production cost due to higher volume largely offset by a similar increase in unit distribution cost (the distance effect outweighing the volume effect in distribution here).
• With (d) constant density, the number of properties increases in line with the increase in area so that density is unchanged although the average distance to properties does increase. In this case, volume economies (in both production and distribution) outweigh the average distance effect. For example, unit supply costs for a town of 50,000 properties occupying 5,000 Ha (density 10 properties/Ha) will be 16.7% lower than for a town of 15,000 properties occupying 1,500 Ha (also 10 properties/Ha), about three-quarters of the
e. Wider implications of the research
These examples are enough to illustrate the range of effects that might be observed, but which are particularly relevant when thinking about urban infrastructure? In studies of agglomeration, it is common to use population as the measure of size9. One lesson from these examples is that it may not be sufficient to look at numbers alone. Whereas increase in size through densification would, it seems, bring economies of scale (in water supply at least), with a positive influence on agglomeration, as would (to a lesser extent) constant density increase, increase in size through suburbanization would be roughly neutral in cost terms. To get the full picture, it would appear necessary to take density explicitly into account as well as size. Moreover, it would be misleading to regard urban areas of similar size, as measured by population, as equivalent from an agglomeration perspective, if they have very different densities. As the ‘dispersion’ example suggests, lower density towns or cities are likely to have higher distribution (and access) costs. Put differently, agglomeration by densification would have real cost advantages (at least up to the point where congestion costs become appreciable)
whereas suburbanization would not.
Another way to look at the matter is to compare water supply costs as between a small town and a large one. Even if they have the same density, the ‘constant density’ calculations point to lower costs in the larger town. If this effect generalizes to other types of infrastructure, it suggests an important reason why large settlements might over time prosper more than small ones; and if the larger one is also denser, the advantage becomes greater still. A related point arises when an area is occupied by several small settlements rather than one large one. If each settlement operates its own water
production facilities, it risks a double cost penalty, on the production side from smaller plant size and on the distribution side from greater dispersion. Of course, infrastructure costs are not the only consideration but if, for example, people have a preference for suburban living, these calculations indicate that there is likely to be a cost penalty (whether or not this is visited on suburbanites through tariffs and connection charges).
It has not been possible in Chapter VII to go beyond some pointers to the application of our water supply findings to a wider range of urban infrastructure. It is likely that distribution costs are less significant in the case of other utilities, although capital
9
investment in distribution systems is important. While in general lower distribution costs can be expected to favour agglomeration by extending the area that can be economically served, high capital costs will still require that settlements be dense as well as relatively large if the necessary investments are to be viable. At the same time, we have pointed to some developments, such as small sewage treatment works and local power generation, which may help small settlements. The scope for application to Point-type infrastructure, such as hospitals, appears good. There has been a tendency to disregard access costs in these cases but the methods we have developed for water distribution costs could readily be applied – the effect, it appears, given that health authorities (like water companies) have to take the existing pattern of settlement as given, would probably be to moderate enthusiasm for over-large facilities.
Application to transport is less obvious. While there are some suggestive similarities, notably when the spatial aspect of transport networks is under consideration, transport also raises issues which go beyond those examined in this thesis. An important instance is congestion, which hardly arises in the case of water supply10 but is of considerable importance in transport. At the same time, the role of density in facilitating the provision of low cost, high capacity transit has parallels in water supply, as does the difficulty of maintaining viable public transport where density is low, for reasons entirely analogous to those applying to water distribution, i.e. higher infrastructure requirements and longer distances per unit of output.
What is clear is that economies of scale in production are not the only factor at work. The spatial aspect with its impact on distribution and access costs is also important. In this research, we have tried to bring this aspect into focus by considering four
contrasting urban growth scenarios, characterised as (a) densification, (b) dispersion, (c)
suburbanisation, and (d) constant density. The results have been discussed in Chapter
VI. The general conclusion emerging from this work is that scale effects in
infrastructure may depend as much on density as on size per se. High density settlement has the potential to permit both large scale production and low cost distribution; on the other hand, low density adds to distribution (or access) costs. It follows that the general presumption in urban economics that such services are always characterised by
economies of scale and therefore conducive to agglomeration may not be correct. This suggests that there should be more direct consideration of density effects in studies of
urbanisation economies (by including density as an independent variable, or both population and area, or by using some measure of sprawl as a proxy for density).
f. Limitations of the research
•••• The absence of any price effects in the cost functions used means that some effects may have been missed (e.g. greater use of more capital intensive or automated technologies in areas where labour costs are relatively high). However, this
limitation may not be too serious in an industry where technology is fairly standard and when the analysis is a single year cross section.
•••• Treatment of the demand for water has been largely by-passed in this thesis. In the case of water supply this can be defended on the grounds that there is a legal obligation to supply and that consumption is very insensitive to price effects, particularly where supply is unmetered. In effect demand has been assumed to be exogenous, both in its locational and its quantitative aspects. In extending the results to other infrastructure services, this stance would be less easy to defend.
•••• More generally, more case studies using actual costs for particular areas would also be desirable, to explore in more detail how the combined costs of production and distribution are optimised in practice (or how other factors, such as security of supply and water quality considerations, lead to arrangements that are not strictly cost-minimising).
•••• Although congestion is potentially an important negative factor in urban
agglomeration, little evidence of this has been found in the case of water supply. It is likely to be more significant in the case of other infrastructure, particularly transport.
•••• The consideration of the wider implications of this research in Chapter VII has only scratched the surface. There is much scope for further research, particularly into the part played by density in the economics of agglomeration.
5. Outline of thesis
empirical work described in Chapter IV (water production) and Chapter V (water distribution). Chapter VI then brings these results together showing how economies of volume scale in both production and distribution can be offset to a greater or lesser extent by spatial costs. Comparisons are made with results obtained by other researchers using other methods. Finally, Chapter VII draws together the conclusions on the interaction between economies of scale, distribution costs and density effects in urban water supply and then considers how far these conclusions may be generalisable to other types of infrastructure.
6. Acknowledgements
I would like to take this opportunity to acknowledge the support and encouragement of my supervisors at the London School of Economics, Prof. Paul Cheshire and Steve Gibbons; I have also benefited from the advice and teaching of other LSE staff, particularly Henry Overman, Christian Hilber and Christine Whitehead. At an early stage in the research, I had a most useful discussion with Scott Reid, then with Stone & Webster Consultants now at ICF Consulting, which helped me to identify much of the relevant literature and gain an appreciation of areas likely to be fruitful to research. At Ofwat, Mark Hann, Helen Twelves and Jackie Cranmer (Librarian) helped me to locate data and answered queries; and at AWWA, Kurt Keeley (Data Manager) kindly
provided me with a copy of their 1996 survey data on disk. I am particularly grateful to my contact at “BWC”, who wishes to remain anonymous, but without whose
cooperation in the form of large amounts of internal data it would not have been possible to obtain many of the results reported in this thesis. Finally, thanks to my wife for her discreet support and encouragement.
II. INFRASTRUCTURE AND THE URBAN ECONOMY
“Cities are the summation and densest expressions of infrastructure” Herman and Ausubel (1988, p.1).1. Defining infrastructure
While the importance of infrastructure in urban development is generally recognized, the treatment of infrastructure in texts on the economics of urbanization tends to be perfunctory and there is some fuzziness about what is actually meant by infrastructure. Recently, there has been a tendency for the term to be applied just to transport
infrastructure, particularly roads. However, if the aim is to understand the role of infrastructure in urban development, a wider definition is appropriate.
“Infrastructure is the term applied to large-scale engineering systems and includes a variety of public works, such as roads, bridges and sewer systems, as well as privately managed utilities such as electric power and telephone service” is Herman and
Ausubel’s attempt at a definition. Later in the same volume Beckmann (1988, p.98) offers “Infrastructures are basic to all economic life. The urban infrastructure is one of the most diverse and complex. To name only the most important components, it
includes streets and public transportation; water supply and sewage removal; police and fire protection; judicial, educational and health facilities; and parks and other
recreational facilities.” This is better in that it recognizes the variety of types of
infrastructure and it also distinguishes between urban and other infrastructure. However, the inclusion of “police and fire protection” apparently widens the scope of the term to include operational personnel as well as the buildings from which they operate.
sound foundations for buildings. This seems more straightforward than having a category of “natural infrastructure”, while recognizing that infrastructure costs may differ between sites because of such factors.
Bartik and Smith (1987, p.1210-11) widen the term amenity to include not only intangible features of a place such as air quality and “the charm of a historic
neighbourhood” but also at least some public services, such as education and police services; and this is the way the term is generally used in the hedonic pricing literature. In Cheshire & Sheppard’s 1995 article “On the price of land and the value of amenities” the term amenities embraces such characteristics as “the character of neighbouring houses and households, localized traffic effects and the quality of the
micro-environment and local public goods such as schools” (p.247). This extends the term to cover public and other services, which may or may not be associated with physical infrastructure.
In the end, there is probably no “right” definition for either infrastructure or amenities, much depending on the context in which the terms are being used11. In the present context, there is advantage in reserving the term infrastructure for structures and
facilities that are the result of human intervention, creating something physical that was not there before. This definition excludes amenities and services but is still wide enough to embrace the movement of soil to create embankments or cuttings as well as the erection of buildings and the laying of lines. This is similar to the position taken by Biehl (1986, p.87): “The difference between infrastructure and other potentiality factors, such as the location of the region or its natural resource endowment, is that the service bundles inherent in infrastructure have been ‘artificially’ created through investment, whereas location and natural resources are ‘naturally’ given.” It enables attention to be focused on specific well-defined facilities, with identifiable costs, whose existence is the result of deliberate decisions by public or private entities. Unlike (say) the weather, the amount of infrastructure of this kind is a matter of choice.
11
2. Infrastructure and agglomeration
It might be thought that something as basic as the economics of infrastructure would already have been thoroughly investigated and the results embodied in standard textbooks. However, this is far from being the case. One possible explanation is that it has not been regarded as something worthy of study in its own right. Thus, while
housing, transport, public goods and utilities, all in their different ways constituent parts of the urban infrastructure, have each generated a substantial literature, it has been somewhat compartmentalised and a unified treatment of the role of infrastructure in urban development has been lacking. In the case of utilities, in particular, the focus of research has been industrial organisation and (more recently) regulation, rather than the contribution of utilities to urban development or agglomeration economies.
However, awareness of the interaction between different elements of the urban infrastructure has increased in recent years. As evidence, one can cite the contents of successive volumes of the Handbooks of Regional and Urban Economics12: the juxtaposition of chapters on Housing, Urban Transportation and Public Facility Location in Vol 2, for example, must, one supposes, have prompted at least some readers to speculate about the relationship between these topics.
Nevertheless, in all four volumes, there is only one chapter which puts infrastructure centre stage. That is the contribution of Eberts & McMillen (1999) on “Agglomeration Economies and Urban Public Infrastructure” who summarise the position thus (p.1456):
“Theory links [agglomeration economies and urban public infrastructure] by positing that agglomeration economies exist when firms in an urban area share a public good as an input to production. One type of shareable input is the close proximity of businesses and labor that generates positive externalities … Another perhaps more tangible type of shareable input is urban public
infrastructure. Public capital stock, such as highways, water treatment facilities and communications systems, directly affect the efficient operation of cities by facilitating business activities and improving worker productivity. The literature has devoted considerable attention to both topics, but not together …Only a handful of studies have focused on the metropolitan level, and even fewer have estimated agglomeration economies and infrastructure effects simultaneously. Results from studies that include both types of shared inputs suggest that both spatial proximity and physical infrastructure contribute positively to the productivity of firms in urban areas.”
They conclude:
“More research is needed to explore the inter-relationships between urban size and urban public infrastructure and to open the ‘black box’ of agglomeration economies and estimate how the various other factors associated with urban size affect productivity.”
One reason identified in the urban economics literature why larger size may bring costs as well as benefits is commuting costs. As Fujita & Thisse (2002, pp.108-9) express it:
“Intuitively, the reason is that, because of an increase in travel distance, the total commuting costs within the city increase more than proportionately with the population size. In other words, given the monocentric structure, there are
diseconomies in urban transportation when the population rises. This result
coincides with another well-documented fact in economic history that high commuting costs placed an upper limit on the growth of cities for fairly long periods (see Bairoch (1985), chap. 12).”
An early statement of this result is provided by Arnott (1979). If it is assumed that all employment is concentrated in a central business district, population density is uniform over the city area and commuting cost is increasing in distance from the CBD, then it is not difficult to show that total commuting cost for the city is increasing in city size as measured by population13. (Note, however, that this result depends on each commuter traveling radially and individually to the CBD; it does not allow for the possibility that large dense populations will permit the development of collective means of transport, thereby greatly reducing the average cost of commuting; nor is constant density consistent with the standard monocentric urban model which implies that density declines away from the centre.)
It follows, as (Fujita (1989, p.134) puts it: “In order to have cities, therefore, we must have technological advantages in production or consumption that exceed the transport cost increase”. Developing the argument, Fujita continues:
“Perhaps the most fundamental reason for the existence of cities stems from
economies of scale in production and consumption, which are, in turn due
largely to the indivisibility of some commodities (such as persons, residences, plants, equipment, and public facilities). The indivisibility of persons leads to the specialization of labour, and some equipment can be effectively used only on a larger scale. Moreover, the efficient coordination of many specialized persons, equipment and production processes requires them to locate nearby – due partly
13
For a circular city of uniform population density, where all commuting is to a central business district and transport cost is proportional to distance, total commuting costs will be given by:
2 3 3
0 3
2 .
3 2 . 2
. rdr R N
r TCC R
π
π
π
= ==
∫
to the facility of communication and partly to transport cost savings in various production processes. Therefore, the average total cost of the production of a good will be smaller (to a certain extent) if it is performed at a larger scale and at a contiguous location. In addition, if the production of one firm uses an output of another firm, the two firms may find it economical to locate near each other. Hence, through input-output linkages, many large firms may find it economical to locate closely, and these firms will provide the basic sectors of a large city. Moreover, the provision of many public services and facilities (such as schools, hospitals, utilities, and highways) typically exhibits the characteristic of
economies of scale.”
This last sentence encapsulates the dominant view of the role of infrastructure in the urban economics literature. Its contribution comes from economies of scale. Indeed, in the model developed later in Fujita (1989), p.151-2, this becomes very explicit:
“We assume that the formation of a city requires a certain amount of fixed costs
K. For example, K may include construction costs of basic public facilities such
as transport and water systems. Since the per capita fixed costs become smaller as the population increases, the existence of fixed costs provides an incentive for city formation.”
In effect, infrastructure is treated here as a local public good, so that distribution or access costs are not considered, although some attention is later given to congestion costs and other externalities (positive as well as negative). It is one of the objectives of this thesis to bring out more clearly how distribution (or access) costs interact with economies of scale and urban density to complicate this picture of the role of infrastructure.
Duranton & Puga (2004), discussing the micro-foundations of urban agglomeration economies, suggest (p.2066) three types of micro-foundation, based on “sharing, matching and learning mechanisms”. Within the sharing type, they include “sharing indivisible facilities, sharing the gains from the wider variety of input suppliers that can be sustained by a larger final-goods industry, sharing the gains from the narrower specialization that can be sustained with larger production, and sharing risks”. It seems clear that sharing urban infrastructure must be included among “indivisible facilities”, to the extent that urban infrastructure is to be considered a source of urban agglomeration economies.
Duranton & Puga continue (p.2068):
enjoy this good consumers must commute between their residence and the facility. We can immediately see that there is a trade-off between the gains from sharing the fixed cost of the facility among a larger number of consumers and the costs of increasingly crowding the land around the facility (e.g. because of road congestion, small lot sizes, etc.). We may think of a city as the equilibrium outcome of such trade-off. In this context, cities would be no more than spatial clubs organized to share a common local public good or facility.”
However, the authors then make clear that they do not regard this line of argument as particularly compelling (p. 2069):
“ … the easiest route to take in justifying the existence of cities is to assume increasing returns at the city level by means of a large indivisibility. While large indivisibilities are useful modeling devices when the main object of interest is not the foundations of urban agglomeration economies, they side-step the issue of what gives rise to increasing returns at the level of cities. Cities facilitate sharing of many indivisible public goods, production facilities, and marketplaces. However, it would be unrealistic to justify cities on the basis of a single activity subject to extremely large indivisibilities. The challenge in urban modeling is to propose mechanisms whereby different activities subject to small non-convexities gather in the same location to form a city.”
These quotations can be read as casting doubt on the realism of the analysis developed in the Fujita passages just cited. However, they do not attempt to quantify the postulated trade-off, nor consider the point that higher density (here dismissed as “crowding”) might contribute positively to the outcome, and their comments would seem to apply only to what we have called Point Type infrastructure. In consequence, Duranton & Puga go on to give the bulk of their attention to other forms of sharing, and to matching and learning mechanisms, with the implication that infrastructure is of little relevance to agglomeration economies.
It seems intuitively obvious that density must play an important part in urban economics, yet this aspect of the urban scene is not often directly addressed14. As Ciccone & Hall (1996) remark (p.96):
“Although the idea that denser economic activity had advantages from
agglomeration was implicit in a large earlier literature, there does not appear to be any earlier work in which density was an explicit element of the theory, nor has there been empirical work based on density.”
The focus of their article is the benefit of density to productivity, which they find to explain more than half of the variance of output per worker across the states of the USA. They invoke three mechanisms to account for this (p.54):
“If technologies have constant returns themselves, but the transportation of products from one stage of production to the next involves costs that rise with distance, then the technology for the production of all goods within a particular geographical area will have increasing returns – the ratio of output to input will rise with density. If there are externalities associated with the physical proximity of production, then density will contribute to productivity for this reason as well. A third source of density effects is the higher degree of beneficial specialization possible in areas of dense activity.”
Ciccone & Hall thus do not include the favourable effect of density on the unit costs of infrastructure services, as found in this research, as a further possible influence.
Our results for water supply suggest that Duranton & Puga (2004) may be too
dismissive. In fact, there appear to be two kinds of sharing benefits at work in this case. An increase in city population will enable economies of scale in water production to be exploited; and if this increase takes the form of higher density settlement, there will be reductions in per capita distribution costs as well. However, if the increase takes the form of more dispersed settlement (expansion at lower density), the latter benefit may be reversed, perhaps even to the extent of outweighing the economies of scale in production. If similar conclusions hold for other infrastructure, such as sewerage, electricity supply and transport services, then, on the one hand, the cumulative
advantage of high density settlement may be considerable (although, as these and other authors point out, account will also need to be taken of congestion effects) and, on the other hand, low density expansion, through higher infrastructure costs, will act as a brake on city growth. So, while invoking a single large indivisibility to explain urban agglomeration economies may indeed be unconvincing, the cumulative benefit of lower production and distribution costs across the whole range of infrastructure services when density is high cannot so lightly be dismissed. More generally, it suggests that urban theory and urban modeling should recognise that agglomeration benefits may depend as much on density as size (something that may equally well be true for the other sharing, matching and learning mechanisms to which Duranton & Puga give attention).
3. Sprawl and the cost of public services
In Britain, Elis-Williams (1987) used cost functions estimated from expenditure data, together with population distribution from the 1981 Census to determine the optimal location of secondary schools in the County of Gwynedd in Wales, taking into account both school costs and pupil transport costs. He observes (p.153):
“Most local services are delivered from a number of identifiable service centres, each serving the population resident in the surrounding area. The population may travel to the service centre to receive the service e.g. hospitals, or the service centres may be bases from which the service is delivered to the
population at home e.g. fire stations … In either case, there are two influences which a sparse population may have on unit costs –
(a) it can force the operation of smaller and therefore less economic service centres;
(b) it can cause higher transport costs because of the larger distances between the population and the service centres …
… In the general case, it seems likely that there is a trade-off between economic operation of service centres and reducing transport costs, with authorities
seeking to locate service centres at some optimum which minimizes total costs given the spatial population distribution.”
Elis-Williams’ study found that the actual location of secondary schools in the 5 districts of Gwynedd was reasonably consistent with the computed optimum. He also found greater sparcity to be associated with higher unit costs.
In a more wide-ranging study of 247 large counties in the US, Ladd (1992) estimated the impact on local government spending of two dimensions of residential development, growth rate and density, controlling for other determinants of per capita spending. She concludes, in contrast to the engineering and planning view that greater population density lowers the cost of providing public services, that there is a U-shaped
relationship between spending and density: “Except in sparsely populated areas, higher density typically increases public sector spending”. This study is note-worthy, inter
alia, for its attempt to distinguish between costs and outputs. Its findings challenge the
conventional wisdom but it may be noted that only the costs borne by government are considered.
More recently, Ladd’s findings have been challenged by Carruthers & Ulfarsson (2003). They question the use of a simple density measure, particularly over areas as large as counties. Instead, they measure density as number of jobs and people per acre of
urbanized land, with the spatial extent of urbanized land in a county given by the total
found in an earlier report (p.506) that “per capita spending on infrastructure declines at greater densities but increases with the spatial extent of urbanized land area and
property values”. Developing this approach to a wider range of government expenditures reinforced this conclusion (p. 513, p.517):
“First, the parameter estimates for density are negative and significant in several of the models, suggesting that it creates economies of scale for: public spending on the whole (total direct expenditure), capital facilities, roadways, police prot