Performance Overhead Based Analysis of Container based Virtualization
with Type1, Type2 Hypervisor
Ms. Krishna Gupta
1Mr. Jagendra Chaudhary
2Mr. Subhash Chandra
31,3
Assistant Professor
2Research Scholar
1,2
YIT, Jaipur, India
3RCEW, Jaipur, India
Abstract— Virtualization is a rapidly growing advance technology in the present computer world to save the cost, efficiency and efforts. Instead on installing a new operating system Hypervisor based virtualization technique and container based technology is the primarily choice of researchers and developers. In the present era of cloud computing Container based virtualization is also become popular parallel with Hypervisor-based virtualization. In this paper we present a performance evaluation among type-1 hypervisor (KVM), type-2 hypervisor (VirtualBox) and Docker a container based virtualization technology. For performance evaluation we use Disk I/O benchmarking tool iozone and for CPU benchmarking we use sysbench. Our result from experiment represent that container based virtualization technique provides better performance in Disk I/O operations and CPU utilization compared to type-1 and type-2 hypervisor technology.
Keywords: Performance, VirtualBox, KVM, Docker, Containers
I. INTRODUCTION
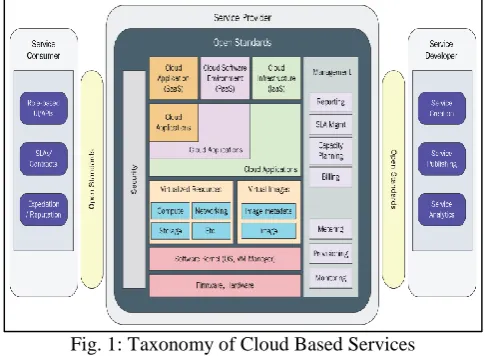
[image:1.595.45.288.542.720.2]Cloud computing based solution makes a remarkable change in the growing IT industry for empowering the performance of our services of Infrastructure and Software. Cloud computing working as a backbone to provide services which are required for your application and pay only for those services which are used by you without purchasing those services. Cloud Computing has some major benefits such as flexible infrastructure which is scalable at any time without delay, on demand access to server capabilities, and high cost software services with a minimal cost with a powerful availability for high performance applications [1]. Virtualization is a powerful technology to divide computer resources such as
Fig. 1: Taxonomy of Cloud Based Services
CPU, Memory among different operating system without creating another logical partition of the disk using hypervisor. Instead of installing a new OS, it install a new Virtual Machine (VM) on original OS by virtualizing
hardware of our system [2]. Most common virtualization methods are broadly categorized into four models like full virtualization, paravirtualization and hardware virtualization. A hypervisor [3] [4] could be a property which abstract (keep hidden), provide isolation (separate from main OS) with its running structure on the provided computer hardware. This abstraction permits the underlying host laptop computer hardware to severally operate one or larger virtual machines as guests, permitting quite one guest VMs to properly share the system's bodily reckon resources, like processor cycles, reminiscence house, network information measure then on. A hypervisor is also called a digital desktop monitor due to its power for providing better flexibility with the underlying hardware.
Hypervisors is having many advantages over an employer statistics center with a huge cost hardware. Primarily advantage is to increase the capacity of a host system to run multiple VMs can massively improve the utilization of the underlying hardware whereas a powerful server’s machine may only host one operating system and application. A hypervisor provide virtualization capability to the server, provide power to run multiple OS simultaneously. In a nutshell a hypervisor increase the availability of a machine or server machine to access or make it available for multiple users.
Virtual Machines (VMs) [5] [6] are a light weight application over an operating system. Hypervisor make a VM completely independent form the hardware of machine due to its generalization that takes location in the core operating system. A software which install on main OS will take long time for reinstallation, reconfiguration. By using a hypervisor makes the requirement of hardware details irrelevant to the VMs. This approach help to move any VMs to be moved or migrated between any neighborhood and any virtualized servers. Hypervisor will make the zero migration cost without disruption the configuration in VM.
II. RELATED WORK
Virtualization is dynamic and changing the work from physical to logical which means a new operating system now don’t need hardware(Physical) but now it’s need only software(logical). Virtualization suggest that create more logical resource than physical resources and we need only one physical resource among multiple logical resource. This technology is called system virtualization. Virtualization typically uses hypervisor to managing the resources on a virtual system. Hypervisor is a set of code, which will manage the hardware. In other words, we can say that our hardware are virtualized with the help of hypervisor.
applications running on system. Virtualization enable a scalable architecture of server and personal computer without increasing its cost and physical hardware.
Our survey on comparison of Hypervisors is having the following 3 major ways to examining its performance which are as follows:
1) Supported benchmarks: It compare the impact on memory, I/O operations and overheads on mainframe. 2) Supported small benchmarks: It focus on the comparison
on the impact on basic primitive operation, and using prediction.
3) Supported benchmarks: It compare the performance based on generating load.
This papers for the study is finalized on the basis of CPU performance benchmarking in which writer compare the effect on CPU performance, overhead, memory operations such as read and write, I/O based work, the following two survey papers come into our consideration.
In first paper titled as “Performance comparison of Hypervisors” by VMWare and “VMware vSphere 4 Performance with Extreme IO Workloads” by VMWare, measureable assessment of 2 Hypervisors particularly VMware‘s ESX particularly VMware‘s ESX and XenSource‘s Xen [9] [10] is finished.
Benchmark test selected for these experiment are as follows: 1) SPECcpu2000, Benchmark’s number element is suitable for the market performance analysis and CPU-intensive applications represented by it.
2) Passmark, is used to isolate various aspects of performance of digital computer is an artificial set of benchmarks. Workload of desktop-oriented system represented by it.
3) Netperf, is healthier choice in data centre to simulate the usages of network.
4) For Java application, SPECjbb2005, benchmark is used for evaluating it’s performance in datacenter.
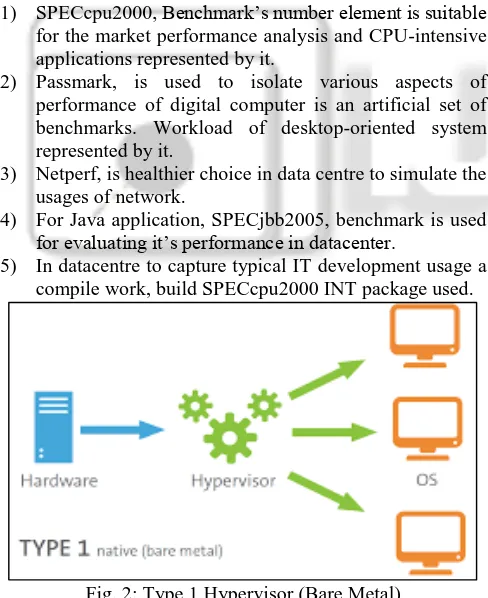
[image:2.595.307.547.174.313.2]5) In datacentre to capture typical IT development usage a compile work, build SPECcpu2000 INT package used.
Fig. 2: Type 1 Hypervisor (Bare Metal)
To check its performance and quantifiability of 2 virtualization Hypervisor VMware and Xen is the prime objective.
In our literature examination, our second paper titled as “Performance comparison of business Hypervisor" - A study by XENSOURCE [11] on the above mentioned hypervisors is based on quantitative analysis. In this paper, comparison performed on virtualization product, which is Hypervisor-based from VMware and XenSource
[image:2.595.45.289.354.653.2]organization. Study of this paper presents comparative results of performance and measurability between assessment of XenSource‘s XenServer [11][12]. Second paper represents the results for performance benchmarks between VMware, and Xen Source‘s Xen Enterprise 3.Study over Xen supply, Xen Enterprise shows in several cases it had performed higher than ESX server. During performance evaluation based on few tests, it performs not as much of sound than ESX. These shows an area of Xen in later releases [13] [14].
Fig. 3: Type 2 Hypervisor (Hosted)
Our survey on the following paper is rely within the class wherever for small benchmarks the benchmarking is centred and compare the effect on basic indigenous tasks and extension to realistic objects or things by expectation: We study a research paper which titled as “Virtual Machine Benchmarking”, by Kim Thomas Moller which provided a new horizon and introduce a new benchmark VMBench is expected. Three stage method is used by VMBench to define the enactment of a virtual machine environment. These 3 stages are depend on one another for more lasting complexness, and non-predictable for it’s environment.
A. Stage 1: Enactment of Hypervisor autograph
Hypervisor performance signature is settled in the primarily stage, by micro and Nano benchmarks. This used to find the best-case performance of a virtual machine for a given combination of hardware, Hypervisor, OS and workload [14]. Therefore, one virtual machine exercises well-defined operations, so the performance of virtualization-specific useful primitives often measured accurately. By minimizes the aspect effects and interprets the results optimistically we will get the best-case performance; VMBench minimizes the aspect effects and interprets the results optimistically.
B. Stage 2: Best case forecasts in realistic applications
Based on the result of the first stage, the second stage combines the result with its input and provide a linear model to predict best-case results for realistic applications [13][15].
C. Stage 3: VM Interference Examination
Fig. 4: Architecture of Docker
The following 2 papers were surveyed within its class wherever benchmarks were supported to predict or generating workloads: The primary paper titled as “VMmark: An ascendable Benchmark for Virtualized Systems” by Vikram Makhija and Bruce Herndon of VMware [15][17][18], offerings a new technique for benchmarking which is based on tile-based. In the separate virtual machines, it consists of many acquainted workloads death penalty at the same time. It focus on the full utilization by every work part relies on a single-system benchmark death penalty. A tile is a unit of labour spoken in different workloads is collective. A mixture score for the tile generated while the performance of every work is measured [13]. The scores generated once running multi-tiles at the same time is calculated by summation is treated as benchmark value.
III. PROPOSED METHODOLOGY
Based on our literature review third most technique is chosen as the best benchmarking technique among all. Utilization of virtualization is more in server link applications. Due to a high demand of IT infrastructure the demand for server virtualization is increased as the growth of IT industry. To finalize a technique it is required to check the performance and quality to compare various available virtualization techniques. We are performing benchmarking for the following Hypervisors:
1) Type-1 Hypervisor Kernal based Virtual Machine (KVM)
2) Type-2 Hypervisor VirtualBox 3) Docker container
A. 3Hardware Setup
All the experiments were performed on physical Machine with 4 cores (Intel i7, 8550U), 16 GB of DDR4 RAM, 1x1 TB NVME SSD disks, and a 1 GB network adapter. Fedora Workstation 28 is running on the machine as operating system and CentOS 7 is running inside all the VM i.e. in KVM, Oracle VirtualBox and Docker Container.
Both hypervisor i.e. KVM & VirtualBox and Docker Container is running one at a time. All the Virtual Machines have identical configuration while running on hypervisors or
as a container. Each configuration has 2 CPU, 8 GB RAM and 50 GB of SSD Disk.
Sysbech is used for the CPU benchmarking and installed from the official repository of CentOS and iozone is used for the Disk I/O performance. To perform the Disk I/O operations, iozone is performed 70 times for each file with total 7 files of size 1 MB 64 MB,128 MB,256 MB,512 MB & 1 GB respectively to get random results and Sysbech is performed on different prime number range from 10k 50k 100k 150k & 200k respectively. The base operating system (Fedora Workstation 28) is using 4.17 as the kernel.
On the KVM, virt-mamanger (Graphical Interface) and virsh (command line) are used to set up to create Virtual Machines using ISO image of CentOS 7 and container is created using docker pull command and downloaded the official CentOS 7 from the official repository called Docker Hub.
IV. RESULT AND ANALYSIS
In this section, we present the results of our experiments. All the experiments were performed on physical Machine with 4 cores (Intel i7, 8550U), 16 GB of DDR4 RAM, 1x1 TB NVME SSD disks, and a 1 GB network adapter. Fedora Workstation 28 is running on the machine as operating system and CentOS 7 is running inside all the VM i.e. in KVM, Oracle VirtualBox and Docker Container.
Both hypervisor i.e. KVM & VirtualBox and Docker Container is running one at a time. All the Virtual Machines have identical configuration while running on hypervisors or as a container. Each configuration has 2 CPU, 8 GB RAM and 50 GB of SSD Disk. Sysbech is used for the CPU benchmarking and installed from the official repository of CentOS and iozone is used for the Disk I/O performance.
To perform the Disk I/O operations, iozone is performed 70 times for each file with total 7 files of size 1 MB 64 MB,128 MB,256 MB,512 MB & 1 GB respectively to get random results and Sysbech is performed on different prime number range from 10k 50k 100k 150k & 200k respectively. The base operating system (Fedora Workstation 28) is using 4.17 as the kernel. On the KVM, virt-mamanger (Graphical Interface) and virsh (command line) are used to set up to create Virtual Machines using ISO image of CentOS 7 and container is created using docker pull command and downloaded the official CentOS 7 from the official repository called Docker Hub.
A. Read and Write Operations on Virtual Box, KVM and Docker
Our experiment represent the disk operation performed on 7 different size files on both hypervisor i.e. KVM & VirtualBox and Docker Container.
B. Performance Comparison among VirtualBox, KVM and Docker
Following result is compared on different size of file such as 1MB, 64MB, 128MB, 256 MB, 512 MB and 1GB using VirtualBox, KVM and Docker and we compare the result.
C. Disk-Read-Load
hypervisor and Docker container while running the read-load. By Analyzing the Figure, we can observe that the disk-read-performance of Docker is better as compared to the VirtualBox and KVM
Disk Read Performance
File Size VirtualBox KVM Docker
1 MB 4037 3772 2594
64 MB 3304 2605 2998
128 MB 3741 2991 2976
256 MB 3158 3287 3303
512 MB 3333 3568 3504
1 GB 2782 3700 3700
AVERAGE 3392.5 3320.5 3179.17
ROUND 3393 3321 3180
Disk Write Performance
File Size VirtualBox KVM Docker
1 MB 3359 2258 1331
64 MB 2637 2204 1855
128 MB 2947 2442 1907
256 MB 2524 2701 2042
512 MB 2658 2933 2229
1 GB 2225 2849 2386
AVERAGE 2725 2564.5 1958.33
ROUND 2725 2565 1958
D. Understanding Hyper-Visor CPU Performance
When running virtual servers in Hyper-V, there is sometimes, some confusion once deciding what proportion mainframe is actually being utilized. The everyday initial approach is to log into the Hyper-V host and open up task manager. Here the bulk unit surprised to ascertain that their mainframe usage is lowest, this despite the indication that the VM’s CPU’s [19] unit 100 percent used. Actually understanding Hyper-V virtual and physical mainframe Usage initial desires US to dive into barely bit of theory.
Virtual CPU’s [20][21]are typically assigned to a virtual machine. The quantity of virtual processors available unit of measurement determined by the number of cores available on the hardware. So as associate example, if you have a four socket server where each processor has eight cores, this will gift thirty 2 logical processors. As a result you will be ready to apportion a most of thirty 2 virtual CPUs to a virtual server. Each virtual CPU maps right down to a physical core.
[image:4.595.309.549.68.270.2]E. CPU Execution Performance Result
Figure shows the results of the sysbench Benchmarking tool inside VirtualBox hosted hypervisor, KVM baremetal hypervisor and Docker container. By Analyzing the Figure 4 we can observe that the CPU[22] execution time decreases in case of Docker as compared to the VirtualBox and KVM.
CPU Performance Prime
Number Limit VirtualBox KVM Docker
10k 10.0005 10.0008 10.0002
50k 10.0117 10.0005 10.0012
100k 10.0337 10.0071 10.0107
150k 10.041 10.0283 10.0079
200k 10.0169 10.0451 10.0341
AVERAGE 10.02076 10.0163 10.0108
V. CONCLUSION & FUTURE WORK:
In this paper, we try to address the solution of the problem which virtualization is better for production workloads, Type-1 BareMetal KVM, Type-2 Hosted VirtualBox or Docker as Containers. The overall result showed that Docker Container has better performance in disk-read/write operations as well as CPU utilization over the other two hypervisor-based virtualizations.
However, comparing the architecture of containers like Docker with the virtual machines, the fact cannot be neglected that Dockers are less secure that hypervisor-based virtualization because all the containers share same kernel and hence containers are less isolated as compared to hypervisor based virtualizations. On the other hand hypervisor based virtualization is a secure and mature technology as they can divide and partition resources viably in the hypervisor without depending on separate hardware or kernel support but it is also beneficial regarding containers that they can take very less time to boot in compare to Virtual Machines and no need to setup a whole operating system like Virtual Machines.
However, according to our results, Docker Container has better performance in disk-read/write operations as well as CPU performance over the VirtualBox and KVM. Since both containers and virtual machines have their set of drawbacks and benefits, both two technologies can be combined.
Our paper targeted and known the most-used virtualization code packages with few blessings and downsides. The online service performances of those code packages square measure disbursed supported accessing the online servers from virtual machines, we tend to noted down the parameters that we obtained from the experimental results.
To continue this work more, they'll perform the network tests in these code packages and analyses their performance by varied the information measure capability of the network. Another continuity work from this thesis is, they'll implement the Para virtualization platform for virtualization code packages and analyses internet services in those software’s.
In the future, we will set up notice another resolution by running instrumentation within virtual machines in order that the advantages of each i.e. the swiftness of containers and security of virtual machines are often achieved.
REFERENCES
[1] J. Li, Q. Wang, D. Jayasinghe, J. Park, T. Zhu, and C. Pu, “Performance overhead among three hypervisors: An experimental study using hadoop benchmarks,” in 2013 IEEE International Congress on Big Data, June 2013, pp. 9–16
[2] S. G. Soriga and M. Barbulescu, “A Comparison of Performance and Scalability of Xen and KVM Hypervisors,” Published in RoEduNet international conference 12th edition, 2013.
[3] Hwang J, Zeng S, Wu F, Wood T. A component-based performance comparison of four hypervisors. 2013 IFIP/ IEEE International Symposium on Integrated Network Management; 2013.
[4] J. Che, Q. He, Q. Gao, D. Huang, “Performance Measuring and Comparing of Virtual Machine Monitors,” Published in EUC interational conference, 2008.
[5] Sogand Shirinbab, Lars Lundberg, Dragos Ilie, “Performance Comparison of KVM, VMware and XenServer using a Large Telecommunication Application”, Published in 5th international conference on Cloud Computing (Volume: 2 , Issue: 3), 2015. [6] Shivananda R. Poojara*, N. V. Dharwadkar and Vishal
Ghule, “Performance Benchmarking of Hypervisors”, Published in Indian Journal of Science and Technology, 2017.
[7] Wireless Networks and Information Systems, LNEE 143, pp. 305–312, Springer-Verlag Berlin Heidelberg 2012.
[8] Qi Zhang1, Ling Liu2, A Comparative Study of Containers and Virtual Machines in Big Data Environment arXiv:1807.01842v1 [cs.DS] 5 jul 2018. [9] C. Pahl, “Containerization and the PaaS Cloud,” IEEE
Cloud Comput., vol. 2, no. 3, pp. 24–31, May/Jun. 2014. [10]B. I. Ismail et al. “Evaluation of Docker as Edge Computing Platform”, Published in ICOS conference, 2015.
[11]Docker, “Docker”, 2016, https://www.docker.com/: Software Engineering”, Software IEEE, (Volume:32, Issue: 3), 2015.
[12]Reddy PVV, Rajamani L. “Evaluation of different hypervisors performance in the private cloud with SIGAR framework.”, published in International Journal of Advanced Computer Science and Applications. 2014. [13]W. Felter, A. Ferreira, R. Rajamony, J. Rubio [18] in 2015 compared the performance of KVM hypervisor and Docker container using the MySQL database.
[14]Sogand Shirinbab, Lars Lundberg, Emiano Casalicchio “Performance evaluation of container and virtual machine running Cassandra workload”, published in IEEE, 2017.
[15]R. R. Yadav, E. T. G. Sousa, and G. R. A. Callou “Performance Comparison between Virtual Machines and Docker Containers” published in IEEE Latin America Transactions, vol. 16, no. 8, Aug. 2018. [16]B. Russell, KVM and Docker LXC benchmarking with
Open- Stack, 1 May 2014. [Online]. Available: http://bodenr.blogspot.com/2014/05/kvm-and-docker- lxc-benchmarking-with.html (visited on 01/06/2015). [17]L. Lamers and H. Shah, “Open virtualization format
specification”, Distributed Management Task Force, DMTF Standard, version 2.1.0, 12 Dec. 2013.
[18]R. Morabito, J. Kjallman and M. Komu, “Hypervisors vs. lightweight virtualization: A performance comparison”, in 2015 IEEE International Conference on Cloud Engineering (IC2E), Mar. 2015, pp. 386–393. DOI: 10.1109/IC2E.2015.74.
[19]C. Anderson, “Docker, Software engineering”, IEEE Software, no. 3, pp. 102–105, May/June 2015. DOI: 10.1109/MS.2015. 62.
[21]A. Kivity et al., “Kvm: The Linux virtual machine monitor”, in Proceedings of the Linux Symposium, vol. 1, 2007, pp. 225– 230.