i
DETERMINATION OF A TOTAL BODY MODEL OF EFFICIENCY APPLIED TO
A ROWING MOVEMENT IN HUMANS
GARY ANDREW DOYLE
A thesis submitted in partial fulfilment of the requirement of the University of East London for the degree of Doctor of Philosophy
ii ABSTRACT
Efficiency represents the ratio of work done to energy expended. In human movement, it is desirable to maximise the work done or minimise the energy expenditure. Whilst research has examined the efficiency of human movement for the lower and upper body, there is a paucity of research which considers the efficiency of a total body movement. Rowing is a movement which encompasses all parts of the body to generate locomotion and is a useful modality to measure total body efficiency. It was the aim of this research to develop a total body model of efficiency and explore how skill level of participants and assumptions of the modelling process affected the efficiency estimates
Three studies were used to develop and evaluate the efficiency model. Firstly, the efficiency of ten healthy males was established using rowing, cycling and arm cranking. The model included internal work from motion capture and efficiency estimates were comparable to published literature, indicating the suitability of the model to estimate efficiency. Secondly, the model was developed to include a multi-segmented trunk and twelve novice and twelve skilled participants were assessed for efficiency. Whilst the efficiency estimates were similar to published results, novice participants were assessed as more efficient. Issues such as the unique physiology of trained rowers and a lack of energy transfers in the model were considered contributing factors. Finally the model was redeveloped to account for energy transfers, where skilled participants had higher efficiency at large workloads.
This work presents a novel model for estimating efficiency during a rowing motion. The specific inclusion of energy transfers expands previous knowledge of internal work and efficiency, demonstrating a need to include energy transfers in the assessment of efficiency of a total body action.
iii ACKNOWLEDGEMENTS
I would like to thank many people for their help and assistance in this study. I would like to thank all the volunteers who took part within the protocols, as this work would not have happened without you. To my supervisory team, Dr Ryan Mahaffey, Prof. Wendy Drechsler and especially Dr Mary Cramp, for guidance, advice encouragement and the occasional reality checks. I would also like to thank friends, students and colleagues for their support and encouragement.
I would like to dedicate this work to my dad, whose unique philosophy still is with me today.
Most of all, to Mel, Connor and Aidan. You are my 0,0,0.
iv
Contents
CHAPTER 1: INTRODUCTION ... 1
CHAPTER 2: LITERATURE REVIEW ... 5
2.1 Introduction ... 5
2.2 Mechanical work, energy and power ... 6
2.2.1 Introduction ... 6
2.2.2 Work Done ... 7
2.2.3 External work ... 7
2.2.4 Internal work ... 9
2.2.4.1 Use of motion capture to determine internal work ... 11
2.2.5 Positive and negative work ... 12
2.2.6 Total work done ... 13
2.2.7 Summary of Mechanical work ... 14
2.3.Mechanical Energy transfer and work done ... 15
2.3.1 Introduction ... 15
2.3.2 Measures of internal work done ... 16
2.3.3 Internal work and energy transfer ... 17
2.3.4 Work done assuming no energy transfers (Wn) ... 17
2.3.5 Work done assuming transfers within segments (Ww) ... 18
2.3.6Work done assuming transfers within and between segments (Wwb) ... 18
2.3.7 Studies that have included energy transfer in calculation of internal work ... 19
2.3.8 Quantifying energy transfers ... 20
2.3.9 Positive and negative work ... 22
2.3.10 Total Work... 22
2.3.11 Energy transfer and calculations of efficiency ... 23
2.4 Body segment parameters ... 23
2.4.1 Introduction ... 23
2.4.2 Cadaveric methods ... 24
2.4.3 In vivo estimations ... 25
2.4.4 Cohort ... 26
2.4.5 The Trunk ... 26
2.4.6 Summary ... 28
2.5 Energy Expenditure ... 28
v
2.5.2 Basal/resting energy consumption ... 29
2.5.3 Measuring energy expenditure ... 29
2.5.4 Total body physiology ... 31
2.6 Biomechanical Determination of energy consumption ... 32
2.6.1 Introduction ... 32
2.6.2 Summary ... 34
2.7 The role of musculotendonous unit ... 34
2.7.1 The function of muscle ... 34
2.7.2 Types of muscle action ... 35
2.7.3 Length-tension relationship ... 35
2.7.4 Force-velocity relationship ... 35
2.7.5 Excitation-coupling mechanism ... 36
2.7.6 Efficiency of muscular actions ... 36
2.7.7 Muscular efficiency vs mechanical efficiency ... 37
2.7.8 Summary of musculotendonous unit... 38
2.8 Estimating efficiency ... 38
2.8.1 Introduction ... 38
2.8.2 Gross, net, work and delta efficiency ... 39
2.8.2.1 Gross efficiency ... 40
2.8.2.2 Net Efficiency ... 41
2.8.2.3 Work Efficiency ... 41
2.8.2.4 Delta efficiency ... 42
2.9 Results of efficiency studies ... 43
2.10 Work done and calculating efficiency ... 45
2.10.1 Calculating Efficiency ... 45
2.11 Factors affecting efficiency ... 46
2.11.1 Effects of training ... 46
2.11.2 Technique ... 47
2.12 Total body models of efficiency ... 48
2.13 Efficiency of rowing ... 50
2.14 The Role of the Trunk ... 54
2.15 Summary ... 56
CHAPTER 3 DEVELOPMENT OF TOTAL BODY MODEL ... 57
3.1 Introduction. ... 57
vi
3.2.1 Participant Recruitment ... 58
3.2.2 Equipment and setup ... 58
3.2.3 Participant preparation ... 59
3.2.4 Procedure ... 61
3.2.5 Data Processing ... 62
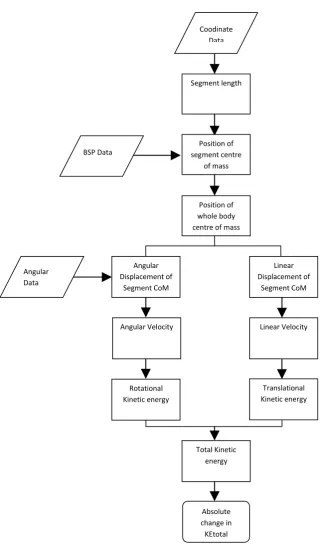
3.2.6 Calculation of internal work ... 62
3.2.6.1 Joint centre identification ... 65
3.2.6.2 Segmental length ... 65
3.2.6.3 Position of segmental centre of mass ... 66
3.2.6.4 Position of whole body centre of mass ... 66
3.2.6.5 Linear displacement and velocity of segmental CoM ... 67
3.2.6.6 Translation kinetic energy ... 67
3.2.6.7 Angular displacement and velocity of segmental CoM ... 68
3.2.6.8 Rotational kinetic energy ... 68
3.2.6.9 Total body kinetic energy ... 68
3.2.7 External work ... 69
3.2.8 Energy expenditure ... 69
3.2.9 Gross efficiency ... 69
3.2.10 Net efficiency ... 69
3.2.11 Specific modelling methodology ... 70
3.2.13 Drive duration ... 70
3.2.14 Data management ... 70
3.2.14.1 Determination of normality ... 70
3.2.14.2 Statistical differences ... 71
3.2.14.3 Effect size ... 71
3.2.14.4 Measures of Reliability ... 72
3.2.14.5 Intraclass correlation coefficients ... 73
3.2.14.6 Standard error of the measurement ... 73
3.2.15 Data Analysis ... 74
3.3 RESULTS... 75
3.3.1 Reliability of internal work during rowing ... 75
3.3.2 Reliability of drive duration during rowing ... 75
3.3.3 Reliability of internal work during cycling ... 76
3.3.4 Reliability of internal work during arm cranking ... 77
vii
3.3.6 Gross efficiency for cycling and arm cranking ... 79
3.3.7 Total work done ... 80
3.3.8 Energy Expenditure ... 82
3.4 Discussion ... 84
3.4.1 Reliability of internal work ... 85
3.4.2 Comparison of gross and net efficiency for rowing ... 86
3.4.3 Comparison of gross efficiency for rowing, cycling, and arm cranking ... 88
3.4.4 The effect of work intensity on work done, energy expenditure and efficiency ... 89
3.4.5 Validation of the model of efficiency. ... 96
3.4.6 Further work ... 97
3.4.6.1 Changes with exercise intensity ... 97
3.4.6.2 Participant skill level ... 97
3.4.6.3 Trunk segmentation ... 98
3.4.6.4 Body segment parameter data ... 98
3.5 Summary ... 99
CHAPTER 4 GROSS AND NET EFFICIENCY OF NOVICE AND SKILLED PARTICIPANTS ... 100
4.1 Introduction ... 100
4.2 Method ... 101
4.2.1 Participant Recruitment ... 101
4.2.2 Equipment and setup ... 102
4.2.3 Participant preparation ... 102
4.2.4 Procedure ... 103
4.2.5 Data Processing ... 104
4.2.6 Calculating internal work ... 104
4.2.7 Data analysis ... 107
4.3 Results ... 108
4.3.1 Participants ... 108
4.3.2 Rowing Performance ... 108
4.3.3 Internal work ... 111
4.3.4 Comparison of gross and net efficiency ... 113
4.3.5 Total Work ... 115
4.3.6 Energy Expenditure ... 116
4.4 Discussion ... 121
4.4.1 Rowing performance ... 121
viii
4.4.3 Efficiency ... 126
4.4.4 Total work ... 130
4.4.5 Energy expenditure ... 131
4.5 Summary ... 135
4.5.1 Examining intermediate intensities ... 136
4.5.2 Efficiency estimates ... 137
4.5.3 Novice vs Skilled participants ... 138
CHAPTER 5 ENERGY TRANSFER AND EFFICIENCY ESTIMATES ... 139
5.1 Introduction ... 139
5.2 Method ... 140
5.2.1. Participants ... 140
5.2.2 Procedure ... 140
5.2.3 Modification of mechanical work calculations ... 140
5.2.4 Internal work ... 141
5.2.5 External work ... 143
5.2.6 Energy transfer ... 144
5.2.7 Data Management ... 144
5.2.8 Data analysis ... 145
5.3 Results ... 146
5.3.1. Calculation of internal work ... 146
5.3.1.1 Method of calculation ... 146
5.3.1.2 Exercise Intensity ... 149
5.3.2 External work ... 152
5.3.3 Total work ... 153
5.3.4 Efficiency - method of calculation... 153
5.3.4.1 Gross efficiency ... 153
5.3.4.2 Net Efficiency ... 156
5.3.5 Efficiency and exercise intensity ... 161
5.3.5.1 Gross efficiency ... 161
5.3.5.2 Net efficiency ... 164
5.3.6 Energy transfer ... 167
5.4 Discussion ... 170
5.4.1 Internal work ... 170
5.4.2 Changes in work ... 171
ix
5.4.4 External work ... 178
5.4.5 Total Work ... 180
5.4.6 Transfer of energy ... 180
5.5 Summary ... 182
CHAPTER SIX THESIS SUMMARY ... 183
6.1 Introduction ... 183
6.2 Original Contribution To Knowledge... 184
6.2.1 Development of total body internal work model ... 184
6.2.2 Total body efficiency estimates ... 184
6.2.3 Energy transfer ... 185
6.2.4 Body segment parameters and multi-segmented trunk... 186
6.3 Limitations ... 187
6.3.1 Drive phase only ... 187
6.3.2 Symmetry of movement ... 187
6.3.3 Application to on-water rowing ... 188
6.4 Future directions ... 188
6.4.1 Positive and negative work estimations ... 188
6.4.2 Development of three-dimensional analysis ... 188
6.4.3 Rowing specific exercise intensities ... 189
6.5 Practical applications ... 189
6.6 Conclusion ... 190
References ... 191
Appendix 1: Ethical Approval ... 205
Appendix 2: Information and Consent forms ... 207
Appendix 3: Normality tests for Chapter 3, 4 and 5 ... 218
Appendix 4: Efficiency values with and without internal work from Chapter 3. ... 226
x
List of Tables
Table 3.1 Anthropometric data (Mean±SD, 95%CI) for age, mass and height. ... 58
Table 3.2 Joint centres used in model ... 65
Table 3.3 Segment determined from joint centres ... 65
Table 3.4 Mean±SD, 95%CI, ICC and SEM for internal work during rowing ... 75
Table 3.5 Mean±SD, 95%CI, ICC and SEM for drive duration (s) during rowing ... 76
Table 3.6 Mean±SD, 95%CI, ICC and SEM for internal work during cycling... 77
Table 3.7 Mean±SD, 95%CI, ICC and SEM for internal work during arm-cranking ... 77
Table 3.8 Mean±SD, internal (Wint), External (Wext) and Total (Wtot) work during rowing ... 81
Table 3.9 Mean±SD, internal (Wint), External (Wext) and Total (Wtot) work during cycling ... 81
Table 3.10 Mean±SD, internal (Wint), External (Wext) and Total (Wtot) work during arm-cranking ... 82
Table 3.11 Metabolic energy expenditure during rowing ... 82
Table 3.12 Metabolic energy expenditure during cycling... 84
Table 3.13 Metabolic energy expenditure during arm-cranking ... 84
Table 4.1 Anthropometric data (Mean±SD, 95%CI) for age, mass and stature. ... 102
Table 4.2 BSP for trunk segments (de Leva, 1996) ... 105
Table 4.3 Inferential & effect size statistics for anthropometric parameters between novice and skilled participants ... 108
Table 4.4 Inferential & effect size statistics for anthropometric parameters between novice and skilled participants ... 108
Table 4.5 Intraclass correlation coefficients and SEM for drive length for novice and skilled participants. ... 109
Table 4.6 Inferential and effect size statistics for difference in drive duration between novice and skilled participants ... 110
Table 4.7 Intraclass correlation coefficients for drive duration for novice and skilled participants. ... 111
Table 4.8 Inferential and effect size statistics for difference in drive duration between novice and skilled participants ... 111
Table 4.9 Intraclass correlation coefficients for internal work for novice and skilled participants ... 112
Table 4.10 Independent T test results and Effect size statistics for total internal work between novice and skilled participants ... 113
Table 4.11 Mann-Whitney and Effect size statistics for total internal work between novice and skilled participants ... 113
Table 4.12 Inferential and effect size statistics for differences gross efficiency between novice and skilled participants ... 114
Table 4.13 Inferential and effect size statistics for difference between net efficiency between novice and skilled participants ... 115
Table 4.14 Conversion of power output to work ... 115
Table 4.15 Independent T test results and Effect size statistics for total work between novice and skilled participants ... 116
Table 4.16 Mean (±SD) Expired gas data and gross energy expenditure for novice and skilled participants. ... 119
xi Table 4.18 Inferential and effect size statistics for differences in net energy expenditure
between novice and skilled participants ... 119 Table 4.19 Inferential and effect size statistics for heart rate between novice and skilled
participants ... 120 Table 5.1 Post-hoc comparison and effect size for internal work by method of calculation for novice participants (Wn= no energy transfers, Ww = energy transfer within segments, Wwb = Energy transfers within and between segments) ... 149 Table 5.2 Post-hoc comparison and effect size for Internal work by method of calculation for skilled participants (Wn= no energy transfers, Ww = energy transfer within segments, Wwb = Energy transfers within and between segments) ... 149 Table 5.3 Post-hoc comparison and effect size for internal work by exercise intensity for novice participants (Wn= no energy transfers, Ww = energy transfer within segments, Wwb = Energy transfers within and between segments) ... 151 Table 5.4 Post-hoc comparison and effect size for Internal work by exercise intensity for skilled participants (Wn= no energy transfers, Ww = energy transfer within segments, Wwb = Energy transfers within and between segments) ... 152 Table 5.5 Mean (± SD) External work (J) for novice and skilled participants ... 153 Table 5.6 Mean (± SD) total work (kJ) for novice and skilled participants (Wn= no energy transfers, Ww = energy transfer within segments, Wwb = Energy transfers within and between segments) ... 153 Table 5.7 Post-hoc comparison and effect size for gross efficiency (%) by method of calculation for novice participants (Wn= no energy transfers, Ww = energy transfer within segments, Wwb = Energy transfers within and between segments) ... 159 Table 5.8 Post-hoc comparison and effect size for gross efficiency (%) by method of calculation for skilled participants (Wn= no energy transfers, Ww = energy transfer within segments, Wwb = Energy transfers within and between segments) ... 160 Table 5.9 Post-hoc comparison and effect size for net efficiency (%) by method of calculation for novice participants (Wn= no energy transfers, Ww = energy transfer within segments, Wwb = Energy transfers within and between segments) ... 160 Table 5.10 Post-hoc comparison and effect size for net efficiency (%) by method of calculation for skilled participants (Wn= no energy transfers, Ww = energy transfer within segments, Wwb = Energy transfers within and between segments) ... 160 Table 5.11 Post-hoc comparison and effect size for gross efficiency for novice
xii Table 5.16 Independent samples difference test effect size for energy transfer between novice and skilled participants. (Tw= transfers within segments, Tb = transfer between segments, TWb
= transfers within and between segments) ... 169
Table A3.1. Shapiro-Wilk test for internal work ... 218
Table A3.2. Shapiro-Wilk test for normality of gross efficiency ... 218
Table A3.3. Shapiro-Wilk test for total work done ... 218
Table A3.4. Shapiro-Wilk test for normality of energy expenditure (n=10). ... 219
Table A3.5 Shapiro-Wilk test for Drive duration during rowing (n=10). ... 219
Table A3.6 Shapiro-Wilk test for Novice participant anthropometrics (n=12). ... 220
Table A3.7 Shapiro-Wilk test for normality of drive length for novice participants (n=12). .... 220
Table A3.8 Shapiro-Wilk test for normality of drive duration for novice participants (n=12) .. 220
Table A3.9 Shapiro-Wilk test for normality of internal work for novice participants ... 221
Table A3.10 Shapiro-Wilk test for normality of total work for Novice participants ... 221
Table A3.11 Shapiro-Wilk test for normality for gross energy expenditure (GEE) for novice participants ... 221
Table A3.12 Shapiro-Wilk test for normality for net energy expenditure (NEE) for novice participants ... 222
Table A3.13 Shapiro-Wilk test for normality of gross efficiency (%) for Novice participants... 222
Table A3.14 Shapiro-Wilk test for normality of net efficiency (%) for Novice participants ... 222
Table A3.15 Shapiro-Wilk test for normality of internal work for novice participants (n=12). 223 Table A3.16 Shapiro-Wilk test for normality of internal work for Skilled participants (n=12). 223 Table A3.17 Shapiro-Wilk test for normality of gross efficiency for novice participants (n=12). ... 223
Table A3.18 Shapiro-Wilk test for normality of gross efficiency for skilled participants (n=12). ... 224
Table A3.19 Shapiro-Wilk test for normality of net efficiency for novice participants (n=12). 224 Table A3.20 Shapiro-Wilk test for normality of net efficiency for skilled participants (n=12). 224 Table A3.21 Shapiro-Wilk test for normality of transfer for novice participants. ... 225
xiii
List of Figures
Figure 2.1a The start of the drive phase of ergometer rowing (From ‘The perfect stroke’ British
Rowing.) ... 51
Figure 2.1b The middle of the drive phase of ergometer rowing (From ‘The perfect stroke’ British Rowing.) ... 51
Figure 2.1c The finish of the drive phase of ergometer rowing (From ‘The perfect stroke’ British Rowing.) ... 51
Figure 3.1 L-Frame and T-wand used for static and dynamic calibration of the Vicon 612 system ... 59
Figure 3.1.2 Plug-in-gait marker placement (Vicon, OMG, Oxford) ... 60
Figure 3.2 Schematic of workflow for estimates of internal work ... 64
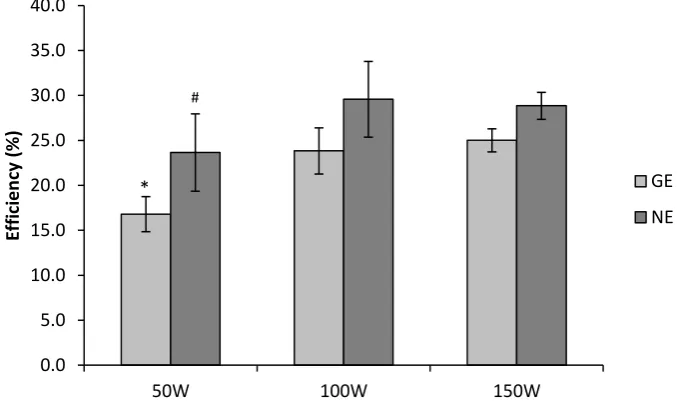
Figure 3.3 Mean (±95%CI) gross and net efficiency during rowing at 50, 100 and 150 W ... 78
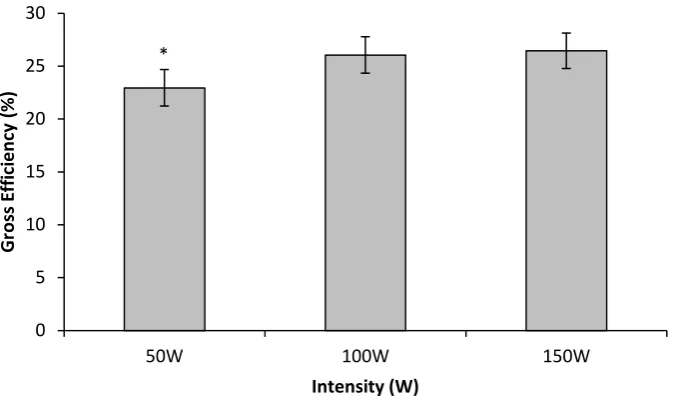
Figure 3.4 Mean (±95%CI) Gross efficiency during cycling at 50, 100 and 150 W ... 79
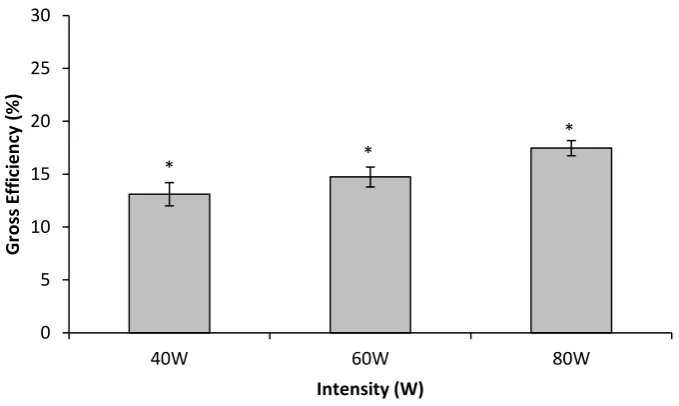
Figure 3.5 Gross efficiency during arm-cranking at 40, 60 and 80 W ... 80
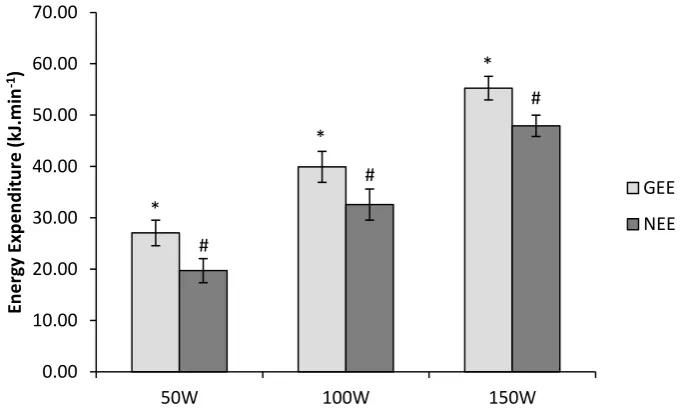
Figure 3.6 Mean (±95%CI) gross and net energy expenditure (kJ.min-1) during rowing at 50, 100 and 150 W ... 82
Figure 4.1 Five marker wand and L-Frame ... 102
Figure 4.2 60 cm Digitizing Pointer (C-Motion)... 103
Figure 4.3a, 4.3b and 4.3c Calculation of trunk segment displacement ... 106
Figure 4.4 The cosine rule triangle ... 106
Figure 4.5 Mean (±95%CI) drive length (m) against intensity for novice and skilled participants ... 109
Figure 4.6 Mean (±95%CI) drive duration (s) against intensity for novice and skilled participants ... 111
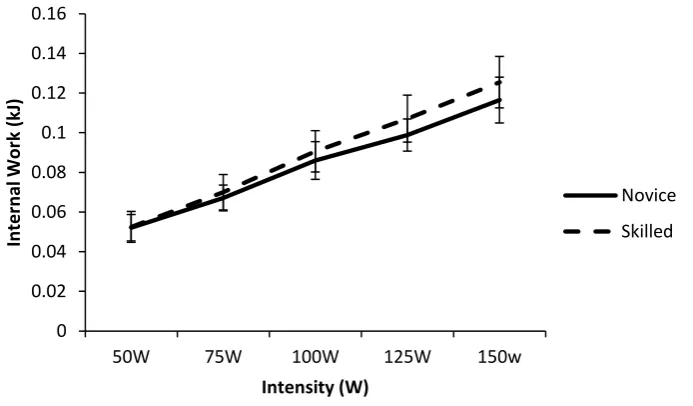
Figure 4.7 Mean (±95%CI) internal work (kJ) against intensity for novice and skilled participants ... 112
Figure 4.8 Mean (±95%CI) gross efficiency (%) against intensity for novice and skilled participants ... 114
Figure 4.9 Mean (±95%CI) net efficiency (%) against intensity for novice and skilled participants ... 115
Figure 4.10 Mean (±95%CI) total work (kJ) against intensity novice and skilled participants .. 116
Figure 4.11 Mean (±95%CI) gross energy expenditure (kJ.min-1) against intensity for novice and skilled participants ... 118
Figure 4.12 Mean (±95%CI) net energy expenditure (kJ.min-1) against intensity for novice and skilled participants ... 118
Figure 5.1 Mean (±95%CI) internal work at 50W for novice and skilled participants (Wn= no energy transfers, Ww = energy transfer within segments, Wwb = Energy transfers within and between segments) ... 147
Figure 5.2 Mean (±95%CI) internal work at 100W for novice and skilled participants ... 148
xiv Figure 5.6 Mean (±95%CI) Gross efficiency at 50W for novice and skilled participants (Wn= no energy transfers, Ww = energy transfer within segments, Wwb = Energy transfers within and between segments) ... 154 Figure 5.7 Mean (±95%CI) Gross efficiency at 100W for novice and skilled participants (Wn= no energy transfers, Ww = energy transfer within segments, Wwb = Energy transfers within and between segments) ... 154 Figure 5.8 Mean (±95%CI) Gross efficiency at 150W for novice and skilled participants (Wn= no energy transfers, Ww = energy transfer within segments, Wwb = Energy transfers within and between segments) ... 155 Figure 5.9 Mean (±95%CI) Gross and net efficiency at 50W for novice and skilled participants (Wn= no energy transfers, Ww = energy transfer within segments, Wwb = Energy transfers within and between segments) ... 157 Figure 5.10 Mean (±95%CI) Gross and net efficiency at 100W for novice and skilled participants (Wn= no energy transfers, Ww = energy transfer within segments, Wwb = Energy transfers within and between segments) ... 158 Figure 5.11 Mean (±95%CI) Gross and net efficiency at 150W for novice and skilled participants (Wn= no energy transfers, Ww = energy transfer within segments, Wwb = Energy transfers within and between segments) ... 158 Figure 5.12 Mean (±95%CI) gross efficiency (%) for novice participants (Wn= no energy
transfers, Ww = energy transfer within segments, Wwb = Energy transfers within and between segments) ... 162 Figure 5.13 Mean (±95%CI) gross efficiency (%) for skilled participants (Wn= no energy
transfers, Ww = energy transfer within segments, Wwb = Energy transfers within and between segments) ... 163 Figure 5.14 Mean (±95%CI) Net efficiency (%) for novice participants (Wn= no energy transfers, Ww = energy transfer within segments, Wwb = Energy transfers within and between
segments) ... 166 Figure 5.15 Mean (±95%CI) Net efficiency (%) for skilled participants (Wn= no energy transfers, Ww = energy transfer within segments, Wwb = Energy transfers within and between
1
CHAPTER 1: INTRODUCTION
Sport performance, physical activity and activities of daily living all require muscular force in order to achieve a specific outcome. The muscular activity required has an energetic cost for the work done, and it is often desirable to improve movement efficiency; that is to minimise the cost of a task or to achieve more work for the same energetic cost (Zelik and Kuo, 2012). Mechanical efficiency is the ratio of work accomplished for the amount of energy expended (Equation 1.1, Winter, 2005).
(1.1) Efficiency can be used to evaluate how well movements are carried out and assess the effect of changes to movement patterns, for example performing more work or greater speed (de Groot et al., 2002). Improvements in technique or physical fitness will potentially enhance efficiency and improve performance (Cavanagh and Kram, 1985b; Purkiss and Robertson, 2003). For example, a small change in efficiency (≈1%) during a modelled 40km cycling time trial caused a large change (≈60seconds) in performance (Moseley and Jeukendrup, 2001).
2 straightforward to assess, work done is more complex. Work done is considered as the sum of external work; that is, the work done by the centre of mass on the environment, and internal work, the movement of the limbs relative to the centre of mass (Saibene and Minetti, 2003). Total work has been assessed via force plates, but this approach is limited to activities with ground contact (Zastsiorsky, 2000). Alternative measures of work have included ergometers (Ettema and Loras, 2009) and the use of 3D motion capture (Saibene and Minetti, 2003). Energy expenditure has been used as an indicator of movement skill and coordination (Lay et al., 2002), but Purkiss and Robertson (2003) suggested internal work is the main biomechanical discriminator of performance, indicating the importance of assessing this quantity. It is unclear whether biomechanics alter energy cost or energy cost alters biomechanics (Kram, 2011).
Whilst there is general agreement that efficiency is as represented in equation 1.1, what specifically constitutes work done and energy expenditure has been viewed in different ways and resulted in varied calculations of efficiency such as gross, net, work and delta efficiency (Cavanagh and Kram, 1985a). Some of these approaches have received criticism for not considering the mechanical basis of internal work (Kram, 2011), ignoring the possibility of energy transfer (Caldwell and Forrester, 1992) or inappropriate energy estimations (Ettema and Loras, 2009). Modifications have been made to energy expenditure including subtracting resting energy expenditure (net efficiency) and energy expenditure during an unloaded action (work efficiency), as well as delta efficiency (Gasser and Brooks, 1975; Stainsby et al., 1980). Furthermore, it is suggested that many calculations of internal work do not allow for transfer of energy within or between segments, questioning the biomechanical and physiological specificity of the calculation (Caldwell and Forrester, 1992; Martindale and Robertson, 1984). This assumes that all work has a metabolic cost, which erroneously influences the data (Williams and Cavanagh, 1985).
3 the body working as a total body, such as rowing (Fukunaga et al., 1986) or cross country skiing (Nakai and Ito, 2011). Gross and net efficiency have been suggested to increase with respect to exercise (Cavanagh and Kram, 1985a) or to be and inverted ‘u’ shaped (Zelik and Kuo, 2012), although there is little consensus. There is equivocal research indicating no change in efficiency with increased skill levels (Moseley et al., 2004) or increase due to training (Hopker et al ., 2009). However, there is a paucity of studies that have considered these issues using a total body action.
Rowing is considered an activity that incorporates the total body (trunk, upper and lower limbs) in a coordinated action (Shephard, 1998; Soper and Hume, 2004). Commonly, an on-water rowing competition occurs over 2000m, where participants could be rowing with a single oar (sweep rowing) in a crew of 2, 4 or 8, or 2 oars (sculling) individually, or in a crew of 2 or 4 (Soper and Hume, 2004). High level performance requires appropriate physiological conditioning to generate the required force output for the duration of the event, as well as, effective technique to transfer the efforts of the rower to propulsion of the boat (Baudouin and Hawkins, 2002).
The force applied to oar by the rower is developed during a cyclical rowing technique, which has periods of high intensity activity (i.e. the drive phase) interspersed by relatively low levels of activity (i.e. the recovery), repeated throughout the event (Soper and Hume, 2004). The effort made by the rower has to overcome the resistant drag of the boat, whilst attempting to maximise the lift mechanics of the oar (Baudouin and Hawkins, 2002). The efficiency of rowing will be determined by the rower, the oar, the water and the boat (Nozaki et al., 1993). Each of these points represents a potential loss of efficiency, similar to the description of the efficiency cascade described by Minetti (2004) for swimming. To examine the efficiency of rowing is a complex task due to the many aspects which contribute to performance. Previous research has simplified the process by focussing upon specific elements of total rowing performance.
4 popular within laboratory settings as the environment can be controlled and procedures such as motion capture and electromyography can be applied to gain further understanding of the mechanics of the rowing stroke (Sforza et al., 2012; Cerne et al., 2013; Ng et al., 2013). Application to on-water rowing performance from the results of ergometer based inquiry will have implicit limitations, as issues such as water density and drag (Baudouin and Hawkins, 2002), the interaction of the oar and water (Caplan and Gardner, 2007) and the effective application of effort by the rower (i.e. transmission efficiency, Minetti, 2004), would need to be considered. However the use of an ergometer allows for the simplification of the complete on-water rowing action, providing qualification of actions and subsequent changes of the rower (i.e. the participant) and is the approach used within this thesis.
The overreaching aim of this thesis was to develop a total body model of efficiency to examine a rowing action. Rowing motion requires extension and flexion of the legs, trunk and arms in sequenced action (Shiang and Tsai, 1998). As such, a large muscle mass is active and there are several physiological challenges, particularly in sending enough blood to the work muscles, which is indicative a high physiological demand on the body (Volianitis and Secher, 2009; Kram, 2011) and reflects the demands of whole body movement. To achieve the overarching aims of the programme, the following research objectives were undertaken:
1. Develop an initial total body model of efficiency that incorporated internal work, external work and energy expenditure and test the model by
(a) examining efficiency for established actions such as cycling and arm-cranking as well as rowing; and
(b) examining efficiency at different exercise intensities
2. Apply the model to healthy novice and skilled rowers, across increasing exercise intensities
5
CHAPTER 2: LITERATURE REVIEW
2.1 Introduction
The ratio of mechanical work and energy required is known as mechanical efficiency Winter, 1979). There is evidence to suggest that humans instinctively attempt to minimise the energetic cost of an activity, maximising efficiency (Zelik and Kuo, 2012). In the run-walk transition, it is demonstrated that an individual’s choice to walk or run is influenced by the lowest energy cost (Hreljac et al., 2007). This questions whether the mechanical activity dictates the energy cost or whether the energy cost dictates the mechanical activity. Put another way, does technique alter energy cost or does energy cost alter technique (Kram, 2011)?
A greater knowledge of how metabolic energy and muscle activity are linked will increase understanding of executing movement patterns (Umberger and Rubenson, 2011). It is not possible to measure the energetic cost and muscular output of a single muscle in vivo, hence human movement is commonly considered as a total system (Kram, 2011). Whilst changes due to increasing exercise intensity are identifiable at the total body level, it is difficult to link to a specific muscle (Umberger and Rubenson, 2011; Kram, 2011). Furthermore, only the work done on an object or body can be measured with a great degree of certainty, as it is impossible to determine the role of a single muscle in the work done by the body, to move an external load (Bartlett and Bussey, 2011). However, the net forces used to achieve the result can be estimated using inverse dynamics.
6 consider efficiency generally, i.e. the definition used in previous literature and the results and gaps identified from previous studies.
2.2 Mechanical work, energy and power
2.2.1 IntroductionClassically, work is defined as the distance through which a force is applied or as the measure of energy flow from one body to another (Winter, 2005). Mechanical energy is the ability to do work (i.e. cause motion) at a given instant of time. Work is the energy flow from one body to another. Both of these are measured in joules. Power is the rate of energy flow (i.e. work) and is measured in joules per second (Winter, 2005).
Human movement is achieved through the work done by muscles, against external resistance. The magnitude of work must be equal to or greater than the energy of the object (Winter, 2005). In moving the object the body performs external work against the external resistance (mass of object, fluids, etc.) and internal work must be expended to move individual body segments. Hence, total work done is the sum of external and internal work done.
In muscle, chemical energy is converted to mechanical energy, which is transferred to heat and work, in line with the first and second laws of thermodynamics (Robertson, 2014). Entropy is the energy which is transferred into forms that cannot be used to do work (i.e. heat) hence minimising entropy should lead to performance enhancement. There are implications for work done, as this may signify poor technique, injury or pathology.
7 To assess efficiency, appropriate measures of work are required; however, this is not straight forward, as work can be considered internal work or external work and there is disagreement in the literature on what constitutes total work (Zatsiorsky, 1998). By calculating the mechanical work done, greater insight into movement patterns can be obtained as this would potentially explain why and how a movement occurred (Purkiss and Robertson, 2003). This would enhance the understanding of the work to cost ratio. Actions and impairments of a segment of the body could be assessed and modified to reduce the total work done through training and rehabilitation (Detrembleur et al., 2003).
2.2.2 Work Done
Mechanical energy at a given point in time is sum of potential (PE), translational (TKE) and rotational energy (RKE) which are determined by position, velocity and mass (Zatsiorsky, 2002). To assess the work done it is necessary to obtain measures of PE, TKE and RKE of the body (internal work) and include any relevant external resistance (external work) such as power output on an ergometer or fluid resistance.
The work of a muscle is used to overcome external resistance (external work) and to move the body segments (internal work). As work done is the product of force and distance, it implies that in order for work to be done there must be displacement, hence isometric muscle actions do not produce work, although they do have an associated energetic cost (Zatsiorsky, 2002). Additionally, if a muscle was passively extended, for example by gravity, then no work is done by the muscle. This highlights the difficulty in assessing work done that includes isometric, eccentric or passive muscular actions (Zatsiorsky 2002; Winter, 2005). Although controversial, mechanical work (total work) is commonly partitioned into external work and internal work. These will now be considered.
2.2.3 External work
8 considered as work done to objects outside of the body, such as lifting a weight and working against an ergometer (Zatsiorsky, 2002).
The absolute change of energy is considered as external positive work (Willems et al., 1995) as an external force is necessary to increase the mechanical energy of body centre of mass, relative to the surrounding environment. To measure external work, the potential energy and the kinetic energy of the body centre of mass is required (Nardello et al., 2011) and calculated over a given time period. This results in the movement of the body centre of mass relative to the environment (Thys et al., 1996).
The accurate measure of external work is major challenge in assessing efficiency (Ettema and Loras, 2009). External work is regarded as a reliable measure of work done by muscle in activities such as level walking. However due to the storage and reuse of elastic energy in the tendons, the change in energy during activities such as running and downhill walking is not due to the work done by muscles but elastic energy and gravity, respectively (Sabine and Minetti, 2003). Also the roles of positive and negative external work need to be considered. Winter (2005) considered positive work of a muscle as work done during a concentric action, increasing the energy level, whereas negative work of a muscle as work done during an eccentric action opposing movement, decreasing the energy level. Total external work of the centre of mass is the sum of positive and negative external work (Minetti et al., 1993).
9 was not responsible for the increased metabolic cost of walking. Studies that have only quantified external work may miss the mechanisms that influence an increase in metabolic cost.
Much of the literature has examined the external work of walking, which has a clear displacement relative to the environment (Willems, et al., 1995). In situations where an ergometer, such as a treadmill, stationary cycle or rowing machine is used, no appreciable displacement occurs and as such measuring external work needs to be approached from a different perspective. A number of papers have considered external work to be the power output from an ergometer such as cycling (Widrick et al., 1992). The use of ergometers, particularly cycle ergometers, has been recommended as one of the more effective options, due to high reliability, explaining the popularity of this methodology (Ettema and Loras, 2009). In activities such as walking and cycling there are reciprocal movements of the limbs (i.e. as one arm is raised the other is lowered) hence this does not affect the trajectory of the body centre of mass (Nardello et al., 2011). This would not be true for activities that are symmetrical in nature such as ergometer rowing (Hofmijster et al., 2009). In absence of force plates, ergometer power output or work done is an acceptable alternative for assessing external work (Ettema and Loras, 2009). External work, particularly when considered as ergometer power output, can be analogous to walking, running, cycling or rowing velocity. In sport, the aim would often be to maximise the velocity, hence the higher the external work the more beneficial the action would be.
2.2.4 Internal work
10
(2.1) Where, m= mass of segment, g= acceleration due to gravity, h= height, v=linear velocity of CoM, I=moment of inertia and ω= angular velocity.
The energy of the body at a point in time would be calculated by summing the values for potential and kinetic energy for each segment included in the body. The internal work done would then be calculated from the change in segment energy over the time period of interest (Caldwell and Forrester, 1992).
Measuring internal work is methodologically more challenging than measuring of external work. From equation 2.1, the change of position and velocity of the centre of mass throughout the motion, needs to be measured. In absence of force plate measurements the use of motion capture technology has been advocated (Nardello et al., 2011). This may suggest threats to ecological validity as it would be laboratory based and often requires the use of an ergometer, but does allow for the control of the data collection. Additionally, an appropriate data set for distributions of segmental mass and rotational characteristics are required (Nardello et al., 2011).
11 There are limited studies that report values of internal work for total body actions. This can be further limited as studies will tend to report the kinetic energy only. Bechard et al., (2009) examined the total kinetic energy (translational and rotational) of 28 elite Olympic rowers. Five on-water strokes were video captured (60FPS) at both a low (18-22) and fast (32-40) strokes per minute. The joint landmarks were manually digitised by a single analyst and the anthropometric data were based on de Leva (1996). The peak kinetic energy was 35.3± 17.8 J and 74.3±36.7 J for low and high stroke rate during the drive phase respectively, which gives some indication of the peak internal work during a total body action during a rowing action.
Slawinski et al. (2010) examined the segmental kinetic energy of eight elite sprinters executing a sprint start, using a 16 segment body model, 4 x 10 metre sprint starts within a three-dimensional (3D) motion capture volume. The translational and rotation kinetic energy for each segment was calculated using the segmental inertial data set of Dumas et al., (2007). The maximum kinetic energy for each segment was; Thigh=91.4 J, Shank=69.1 J, foot = 25.3 J, upper arm=23.3 J, forearm=32.2 J, hand=22.2 J and trunk=258.3 J. Although a different and more explosive movement pattern, compared to rowing, it gives indications of the range of segmental kinetic energy.
Many studies that purport to measure efficiency do not include measures of internal work, instead looking at the ratio of external work to energy expenditure (Goosey-Tolfrey and Sindall, 2007, Lucia et al., 2004). Studies that have included internal work often assume that there is no energy transfer either within or between segments. There are a limited number of studies that have considered energy transfers when determining internal work (Caldwell and Forrester, 1992; Martindale and Robertson, 1984). Appropriate quantification of internal work would give information of mechanical differences between performers (Purkiss and Robertson, 2003), developing insight to suggest modifications to movement performance (Cavanagh and Kram, 1985b).
2.2.4.1 Use of motion capture to determine internal work
12 movement, suggesting their use is less suitable (Elliot and Alderson, 2007). Most three-dimensional motion analysis systems track the position of reflective markers, which are placed on the body of the subject, as they move through time and space. The accuracy of the three-dimensional motion analysis systems has been assessed (Ehara et al., 1995; Richards, 1999). These studies generally show that the ability to measure the position of a marker in time and space is very accurate (<1mm) providing they are correctly calibrated and used (McGinley et al., 2009).
The data on position and time can be used to calculate the position of joint centres and derive further information such as displacements, velocities, accelerations and angles of segments. Minimising errors is a requirement for accurate data and understanding the movement pattern. The use of marker-based three-dimensional motion analysis has been extensively carried out for the lower-body, particularly gait analysis (Rau et al., 2000). Many researchers have taken the approaches used in the lower body and used these as the basis for methods and processes to understand the motion of the upper-body (Hill et al., 2008). Commonly, the marker set is linked to the manufacturer of the motion capture system. In the absence of force plates, or during actions without ground contact, motion capture is a suitable method to determine internal work done (Aissaoui et al., 1996; Saibene and Minetti, 2003). Limitations to marker based protocols can include marker occlusion. Specifically, in actions such as rowing where there is a large degree of trunk flexion and extension, whilst in a sitting position, the anterior pelvic markers can be occluded. Protocols including placing additional markers on the hips (McCelland et al., 2010) and the use of a pointer (Cappozzo et al., 2005) have been successfully used to limit such issues.
2.2.5 Positive and negative work
13 (2007) suggested that positive work can be considered to be generating mechanical energy whilst negative work was the dissipation of mechanical energy. If the change in segmental energy is calculated from the positional data of a segment, there is no definitive way of knowing if muscles are working concentrically or eccentrically.
Positive work is considered to have a greater energetic cost than negative work, hence some studies have attempted to compensate for this by adjusting for energy expenditure 3:1, for positive and negative work respectively (Frost et al., 2002). Additionally assumptions of the same cost for positive and negative work have been made (Winter, 1979), it has been ignored (Martin et al., 1993) or mitigated from adjustment due to the nature of the movement (Martindale and Robertson, 1984).
2.2.6 Total work done
The total work done is considered the sum of external and internal work (Minetti, 1993; Willems et al., 1995; Thys et al., 1996). Total work is the net work done by all the muscles acting upon the system (Zatsiorsky and Gregor, 2000). Co-contractions, isometric actions and absorption of energy in joints and muscle are not accounted for, hence the actual work done may be higher than estimated (Winter, 2005). It is difficult to account for losses of work due to such forces as friction and degradation of energy to heat (Zatsiorsky and Gregor, 2000). As this is not the actual muscle work, it is recommended that this is termed ‘apparent work’ (Zatsiorsky and Gregor, 2000).
14 between the work performed by the body and the work done on the body. Thys et al. (1996) countered by suggesting that work of the joints is the sum of internal and external work. They suggested that the issues of energy transfer between segments, co-contractions, the role of stored elastic energy and multi-articular muscle were of greater interest especially as they were common to all approaches. van Ingen Schenau (1998) raised concerns on the use of only using positive work as the mechanical power output as this ignores the contribution of elastic sources to the mechanical work output. van Ingen Schenau (1998) suggested that the negative work done should be included in the denominator of the efficiency equation. It is suggested that there are other sources that are not being considered such as the role of elastic energy as well as the use of positive work only (van Ingen Schenau, 1998; Zatsiorsky, 1998).
Furthermore, Kautz and Neptune (2002) have argued that internal and external work are not independent quantities. By examining cycling they argued that the decreases in energy are not solely due to the negative work of the leg muscles, due to energy being transferred to the cranks.
2.2.7 Summary of Mechanical work
15
2.3 Mechanical energy transfer and work done
2.3.1 Introduction
The quantification of internal work is suggested as a tool to evaluate the proficiency of a movement (Caldwell and Forrester, 1992), to quantify the mechanical work done, to assess the metabolic cost and to estimate the efficiency of the movement (Norman et al., 1985), as a metric to assess technique and examine skill differences (Norman and Komi, 1987; Purkiss and Roberstson, 2003), to determine the contributions of body segments to the motion and estimate the degree of energy transfer within and between segments (Norman and Komi, 1987). In order to achieve this, accurate measures of all elements of efficiency are needed, specifically internal work. Accurate measures of internal work done must include all potential and kinetic energy components, all energy transfers within and between segments and account for positive and negative work by muscle (Winter, 1979, Willems et al., 1995).
16 that have used these types of internal work measures to examine efficiency. These studies and approaches will be detailed below.
2.3.2 Measures of internal work done
Studies where the motion of the body’s centre of mass was used as a measure of work done have been criticised as that approach ignored the internal work of limb movement, underestimating the work done (Williams, 1985). This is commonplace in studies that have used force plate as a single source of work done (Cavagna, 1977). Ettema and Loras (2009) have indicated that using an ergometer is appropriate as a source of external work. Minetti (1993) indicated that ergometer output included potential energy components of work hence only translation and rotational kinetic energy are collected as internal work, as per Konig Theorem, to avoid double counting potential energy. It has been suggested that the external work, and by extension potential energy, can be underestimated from ergometers (Ettema and Loras, 2009).
17
2.3.3 Internal work and energy transfer
A number of studies that quantified internal work have not accounted for energy transfer within their calculations, assuming all work done has a metabolic cost (Caldwell and Forrester, 1992). Without accounting for energy transfers, the total work done and efficiency estimations are overestimated. The ability of an individual to transfer energy between segments may be used as an indicator of the quality of technique, suggesting that changes (specifically increases) in segmental energy not being supported by new metabolic energy are a cost saving mechanism of good technique (Norman and Komi, 1987). This indicated that part of an ‘efficient’ technique is one that transfers energy in order to have a low metabolic cost (Norman and Komi, 1987).
The following section will review the three methods of calculating internal work that include the different assumptions of energy transfer from the literature and will use the nomenclature and equations of Caldwell and Forrester (1992). The methods essentially use the same source data but differ as to when summations of energies occur and the degree of energy transfer they permit.
2.3.4 Work done assuming no energy transfers (Wn)
The absolute change in potential energy (PE), translational kinetic energy (TKE) and rotational kinetic energy (RKE) are calculated separately for each segment from start to finish of the motion of interest. The absolute changes in PE, TKE and RKE are summed for each segment and all segments of interest are then summed together. This typically derives the largest value for internal work of the three methods.
18
2.3.5 Work done assuming transfers within segments (Ww)
At each time period during the action, the PE, TKE and RKE are summed and the change in segmental energy (SE) is calculated over the time period for all segments of interest. The absolute change in each segment is calculated and summed with the absolute change of all segments. The instantaneous energy of a segment (PE+TKE+RKE) is calculated and the change over the time period of interest is summed. The change in all segments of interest is summed.
Segment energy is calculated from the instantaneous values of PE, TKE and RKE and allows for exchanges of PE, TKE and RKE within the segment without contribution from muscular activity. There is little debate about this method in the literature, seemingly gaining agreement from authors about what it represents, its limitations and how it is calculated. However, it is not used for estimating efficiency nor is work done assuming transfers within segments (Ww) reported as ‘internal work’ as the assumptions overestimate the muscular cost of the activity (Williams and Cavanagh, 1983). However, Ww is important in estimating the transfer of energy (Norman and Komi, 1987).
2.3.6 Work done assuming transfers within and between segments (Wwb)
At each time period during the action, the PE, TKE and RKE of a segment are summed. The sum of the total energy of all segments of interest forms the instantaneous total body energy. The absolute change in total body energy across the motion of interest (time) is then calculated.
19 quite different to a total body closed kinetic chain activity such as rowing. This will be explored later.
All methods of internal work start with the same kinematic data but differ in their method of calculation as to when summing and changes are calculated. These different procedures can produce very different estimates of internal work, where Wn produces the largest estimate of internal work and Wwb the smallest, as shown later, and can influence efficiency estimates (Williams and Cavanagh, 1983).
2.3.7 Studies that have included energy transfer in calculation of internal work
Work done assuming no energy transfers (Wn) has been quantified larger than Wwb for walking and running (Caldwell and Forrester, 1992) in a single participant (68 J vs 37 J, 260 J vs 100 J Wn vs Wwb, walking and running respectively). Although not explicitly reported in rowing, Martindale and Robertson (1984) stated the calculated values for Wn were larger than Wwb, specifically Wwb approximated 26 % of the Wn value. Norman et al., (1985) reported Wn=1269 J, Ww=998 J, Wwb=383 J for expert skiers and Wn=898 J, Ww=761 J, Wwb=286 J for novice skiers.
In its original conception, Winter (1979) allowed transfers between all segments, regardless of their location to the primary muscles responsible for the action. This received some criticism as to the validity of transfer between non-contiguous segments. Frost et al. (1997) used an approach only allowing transfer to adjacent segments of the same limb but not between trunk and limb. Results indicated Wn was greater than Wwb (e.g. 3.95 and 2.14 W.kg-1 at 1.34 m.s-1 and 11.85 and 8.07 W.kg-1 at 2.46 m.s-1 for 10-12 year olds). Unfortunately no data were presented comparing the all segment vs restricted segment transfer.
20 speed), where as WwbLT (54 J and 555 J at heel strike and forefoot strike, respectively at ‘fast’ speed) and Wwb (450 J and 484 J at heel strike and forefoot strike, respectively at ‘fast’ speed) were similar and interchanged positions between conditions.
Whilst there may be an argument for considering the extent of energy transfers between segments, especially non-contiguous segments (i.e. left hand-right foot) there is argument provided that these assumptions might be limited. Winter and Robertson (1978) demonstrated that some of the energy generated at the ankle was transferred to the thigh and trunk during walking. Wells (1988) further demonstrated transfers to non-contiguous segments, when considering bi-articular muscles. Furthermore, it was demonstrated that vertical jump performance improved due to the use of an arm action, where energy generated at the shoulders was transferred to the rest of the body (Lees et al., 2004). However, Lees et al. (2004) were unable to explain how this energy was used. Although in a vertical direction, a jump is not dissimilar in movement pattern to the drive phase of a rowing action. Lees et al. (2004) highlighted the role that the trunk must play in transferring the energy from the arms to the legs.
The assumptions of transfer between non-contiguous segments has argued against transfers between all segments but these studies are limited to running and walking (Williams and Cavanagh, 1983, Slavin et al., 1993; Frost et al., 1997; Frost et al., 2002). However, other research has demonstrated transfer to non-contiguous segments (Winter and Robertson, 1978; Wells, 1988; Lees et al., 2004). If a limited model of transfer were used, then it would only be possible to compare to other such models. By using an unrestricted, all-segment transfer method, no assumptions are made and comparison to more research is possible. Specifically, the model used in Martindale and Robertson (1984) used Wwb. Based on the above Wwb without restriction will be adopted as the model for transfer within and between segments. The method of calculation affects the values of mechanical work done. However, it is common to calculated Wn, Wb and Wwb as they can be used to quantify the energy transfer within a motion.
2.3.8 Quantifying energy transfers
21 considered an indicator of efficient/effective technique as mechanical work is being done without the need for additional metabolic energy (Norman et al., 1985; Norman and Komi 1987). In order to estimate the energy transfer, different methodologies have been adopted but that have a common basis; that is, internal work is calculated with no transfers, calculated allowing transfers within a segment and calculated assuming transfers within and between segments (Winter, 1979; Williams, 1983; Norman et al., 1985; Norman and Komi 1987; Caldwell and Forrester, 1992; Willems et al., 1995). Using these three measures it is possible to calculate the transfer within and between segments, (Winter, 1979; Norman et al., 1985; Norman and Komi, 1987).
To quantify the energy transfer within a model, Norman et al. (1985) used the commonly calculated levels of mechanical work Wn, Ww and Wwb. These are used to estimate the transfer within (Tw), between (Tb) and total transfer (Twb) and are commonly reported as a percentage of Wn.
Tw=Wn-Ww
(2.2) Tb=Ww-Wwb
(2.3) Twb=Tw+Tb
(2.4)
Where Tw = transfer within segments, Tb = transfer between segments and Twb = total transfer within and between, Wn = work done assuming no transfer, Ww = work done assuming energy transfer within segments, Wwb = work done assuming energy transfer within and between segments.
22 championship race. This indicated that differences in performance may have been attributable to the level of transfer and this indicated that skill level may be evaluated by the ability to transfer energy, as this would have a lower metabolic cost.
2.3.9 Positive and negative work
Whether work done is considered positive or negative can have an impact on the metabolic cost of the activity. In its simplest form positive work increases the energy levels and can be analogous to a concentric muscle action whereas negative work decreases the energy levels and can be considered similar to eccentric muscle actions (Willems et al., 1995). In gait, where the contralateral limbs (if assumed to be symmetrical) cancel out any changes in work done (Willems et al., 1995), it is suggested that the cost of the concentric actions is three times more than the eccentric actions (Frost et al., 2002). Difficulties in assessing positive and negative work have been avoided by assuming that the cost is the same (Winter, 1979) or not including this issue (Martin et al., 1993). Robertson and Winter (1980) suggested that the magnitude and type of transfer was dependent on segment velocity, type of contraction and changes in joint angles. Furthermore, this requires quantification of joint powers, which is complex unless using a force plate. When considering the drive phase of a rowing action, Martindale and Robertson (1984) indicated that concentric muscle actions would be the main contributor and hence negative work would be minimised. They did not include the assessment of positive and negative work within their study.
2.3.10 Total Work
23 indicated that this may underestimate the work done by active muscle against gravity. Martindale and Robertson (1984) calculated the change in energy of the centre of mass between the start and finish position of the rowing cycle and this was added to the values for internal work. Any intermediate values would cancel out (Robertson, 2014). By inclusion of external work total work can be ascertained.
2.3.11 Energy transfer and calculations of efficiency
There is little research that has attempted to calculate efficiency using the Wwb model of internal work. Willems et al. (1995) reported net muscular efficiency of positive work for a range of walking and running speeds accounting from transfer within the lower body. Their efficiency range, interpreted from a graph, was approximately 17 % to 60 %, commenting that this was much higher than the maximum muscular efficiency of 25 %, but argued that their values were enhanced by elastic energy. Frost et al. (2002) reported net efficiency range of 40 % to 75 % for 30 children walking and running. Both of these studies examined walking and running but did use internal work that assumed transfers within and between segments, but limited to the lower body. The higher values of efficiency were seen in the running trials, where the displacement of the whole body centre of mass was greater than walking, causing a greater increase in potential energy. Williams and Cavanagh (1983) indicated a range of net efficiency from 35-92 dependant on the assumptions of the calculation model used, concurring with the findings above.
There does not appear to be any data for total body models that have incorporated energy transfer within a total body model. Norman and Komi (1987) collected Wwb and applied the reported metabolic cost for a similar cohort during cross-country skiing to estimate efficiency at 38 %. This is considerably higher than the efficiencies reported by Sandbakk et al. (2012) of up to 20 %. However, Sandbakk et al. (2012) did not account for energy transfers. There does not appear to be data for the efficiency of rowing using internal work accounting for energy transfers.
2.4 Body segment parameters
2.4.1 Introduction24 required (Cheng et al., 2000; Zatsiorsky, 2002; Rao et al., 2003). To estimate the amount of internal work done, the energy of a segment (between potential energy, transitional kinetic energy and rotational kinetic energy) is measured and converted to work. To calculate the three different energies of a segment the displacement, time, mass, position of centre of mass and moment of inertia is required. Body segment parameters (BSP) data for living participants are estimations hence the minimisation of errors is required. Estimations of error have been made (Pearsall and Costigan, 1999; Durkin and Dowling, 2003; Rao et al., 2006; Damavandi et al., 2009). These studies suggest the need for the most accurate and appropriate BSP estimation. As body mass and moment of inertia approximate the third and fifth power of height respectively, small errors can indicate large changes in BSP (Zatsiorsky, 2002). A number of methods have been used to establish BSP. This section will address the use of data obtained from cadaveric and in vivo populations, the cohort the sample is drawn from, and how the body has been segmented. The broadest distinctions between obtaining BSP are direct measurements from cadavers and indirect methods such as in vivo and modelling approaches.
2.4.2 Cadaveric methods
25 developed into regression equations allowing this to be applied to current cohorts. Dempster’s data are routinely used as a comparator to other methodologies and has been shown to give reasonably accurate predictions (Winter, 2005). However these regressions need to be carefully considered and matched to the cohort sample.
2.4.3 In vivo estimations
26 Dumas et al. (2007) suggested that many of the regression equations developed are linear in nature, which are more expedient to use as they rely upon total body mass and segment length. Dumas et al. (2007) suggested that non-linear regression equations, such as Zatsiorsky and Seluyanov (1983) and Yeadon and Morlock (1989), are preferred to linear regression, as they are more individualised being based on a greater number of subject specific measurements (Zatsiorsky, 2002). Standard errors of 21 % of linear regression and 13 % for non-linear regression of the arm of a single subject were reported (Yeadon and Morlock, 1989). There is some suggestion that models should be based on geometric models as this reduces the errors (Pavol et al., 2002). The accuracy is further increased if density can be non-uniform (Nigg, 2007). This has to be tempered against the time and difficulty of obtaining the measurements needed for such geometric models (Pavol et al., 2002)
2.4.4 Cohort
Predictive equations are only valid on the population on which they were developed. Cheng et al., (2000) obtained BSP data for Chinese adults as this was not previously available. For instance, the data of Dempster has been used in many studies such as Minetti (1998) and Nelson and Widule (1983). Dempster’s data were derived from eight, Caucasian males aged 52-83, which means some of the participants were born in the nineteenth century, where lifestyles, health, nutrition and training knowledge was limited by today’s standards, yet the data set has still been used. Data such as Zatsiorsky and Seluyanov (1983) and Durkin et al., (2002) used young subjects and hence may be a more appropriate database to model predictions upon. However, neither Zatsiorsky and Seluyanov (1983) nor Durkin et al., (2002) reported the specific ages of the populations.
2.4.5 The Trunk
27 segment (Caplan and Gardner, 2007). Particularly in gait studies, the trunk has been considered a single segment, from the hip joint to the shoulder or head (Richards, 2008) although this is considered oversimplification (Erdmann 1997). Plagenhoef et al. (1983) described the trunk as being very large and mobile and, as such, complex to deal with, as parts of the trunk can move relative to each other and thus cannot be considered as rigid (Zatsiorsky, 2002). The density of the trunk is not constant. Fully inflated lungs reduce the density of the upper trunk, and this will change through the breathing cycle (Wicke et al., 2008).
The segmentation of the trunk is an important issue. Clear segmentation is also difficult, as muscles from more distal segments cross the trunk (Zatsiorsky, 2002). Whilst researchers tend to agree that C7 is the most superior point of the whole trunk and of the upper trunk or thorax segment (Plagenhoef et al., 1983; de Leva, 1996; Pavol et al., 2002; Holt et al., 2003; Fowler et al., 2006), there is little consensus beyond this. Some studies have considered the trunk as one section (Cheng et al., 2000), divided the trunk into three parts, upper, middle and lower or Thorax, abdomen and pelvis (Plagenhoef et al., 1983; Erdmann, 1997; Wicke et al., 2009), where others have used 5 sections (Pavol et al., 1992). The division of the trunk segments appears to be arbitrary and lacks justification for the segmentation. de Leva (1996) gives data for the whole trunk, the upper part of the trunk and the lower part of the trunk, which correspond to markers used in common motion analysis models (Plug-in-Gait, Vicon).
28
2.4.6 Summary
Due to the time and cost of in vivo estimations, standard tables are commonly used to estimate BSP (Plagenhoef et al., 1983; Winter, 2005). Specifically, the tables of Plagenhoef et al. (1983) and Winter (2005) are often used but have their origins in the work of Dempster (1955). Within the differences in the source population and any application to modern-day athletes, the use of these data should be applied with caution. Zatsiorsky and Seluyanov’s (1983) data incorporated a more modern population, from a sport college, hence, is likely to have a greater number of active individuals, as well as a much larger sample size. However these data were segmented by landmarks making it difficult to apply with modern 3D motion capture data which focuses around joint centres. As the focus of this thesis looks at a rowing motion, where spinal movement is occurring, a BSP data set that accounts for the variation in density of the trunk and segmentation of sections needs to be utilised. de Leva’s (1996) reworking of Zatsiorsky and Seluyanov (1983) data resolved most of these issues and is suggested as the most appropriate data set for this thesis.