MODIFIED AGGLOMERATIVE CLUSTERING WITH
LOCATION QUOTIENT FOR IDENTIFICATION OF
REGIONAL POTENTIAL SECTOR
1TB AI MUNANDAR, 2AZHARI, 3AINA MUSDHOLIFAH, 4LINCOLIN ARSYAD
1
Doctoral Student of Computer Sc. and Electronic Dept., Faculty of Math. And Natural Science Faculty,
Universitas Gadjah Mada, Yogyakarta, INDONESIA 2,3
Faculty of Math. And Natural Science Faculty, Universitas Gadjah Mada, Yogyakarta, INDONESIA 4
Economics Department, Faculty of Economics and Business,
Universitas Gadjah Mada, Yogyakarta, INDONESIA
E-mail :[email protected], [email protected], [email protected], [email protected]
ABSTRACT
Clustering studies, especially on the hierarchical agglomerative cluster (HAC) have proliferated over the recent years. Many studies used several HAC techniques to identify the proximity of one object of a data with another objects to find correlations between both for specific needs. Some studies in regional economics field utilizied this technique for to identify gaps of development by observing the proximity of achievements of development among regions. But there have been a few discussion related to identifying potential sectors owned in certain regions regarding using this technique. This research was conducted to develop a hybrid algorithm between HAC with Location Quotient (LQ) for potential sectors owned by a certain region. Data on sector of PDRB / GDRP in 31 regencies in Central Java province in 2012 are used to test the developed algorithms. The result showed that 279 of Sector Data of PDRB / GDRP were divided into two main group, i.e. the cluster LQ > 1 reaches as many as 125 Sector data from different regencies (as a potential sectors of a region). The remaining 154 sector data were classified into into cluster LQ <1(as a non-potential sectors of a region).
Keywords: GDRP, HAC, LQ, MACLoQ, Potential Sector
1. INTRODUCTION
Regional economic development should be performed in accordance with the regional condition, whether in terms of problem, needs or potential [1]. Every region must have different economic potential. This influences regional economic development policy of every region. The economic sector in question is the sector's gross regional domestic income (GDRP).
Today there are many approaches used to identify potential sectors of a certain region. However, most of these approaches tend to merely classify potential sectors into specific groups, for instance, the Location Quotient (LQ) method. In principle, LQ classified GRDP sectorS INTO into three main groups namely the basic sector (LQ> 1), non-base with a competitive advantage (LQ = 1) and non-base non competitive advantage (LQ <1).
they rarely use it to identify potential sectors owned by a certain region.
In theory, HAC classifies data object based on their proximity. The resulted clusters were in dendrogram form that visualizes the cluster in the form of hierarchy. It is this principle which later became an important foundation why it has to be combined with LQ. LQ classified GRDP sector data into three groups of data, while HAC classified each member of the three groups produced by LQ to see the proximity of potential sectors’ achievement of a certain region. Therefore, this research is to develop new algorithms as a result of hybridization of HAC and LQ techniques. The result of this hybrid technique later is called Modified Agglomerative Cluster with Location Quotient (MACLoQ). The output of MACLoQ not only is able to classify sectors into three main clusters as do LQ, but also able to classify the cluster members on each of the main clusters to ensure the proximity of a achievement of the development in potential sectors owned by a certain region.
Clustering result by MACLoQ is also expected to provide illustration of which sectors should be the priority of stakeholders for future development. Moreover, cluster result by MACLoQ is also expected to show comparison of GRDP sectors between regions, making it easy to interpret which sector should be the priority for future development or improvement.
2. LITERATURE REVIEW
There are many methods which can be used to identify potential economic sector of a region, including Location Quotient (LQ). LQ uses the data of gross regional domestic revenue (PDRB) as source for classifying every economic sector of a region. Every sector is classified into three value categories ranging from 0 to 1 [2]. The three main
groups are basic sector with comparative
advantage, non-basic non-comparative advantage sector, and non-basic sector. In some countries, this method is used to identify basic and leading economic sectors of a region, such as in [3],[4],[5],[6],[7],[8], and [9]. Similarly, Indonesia uses this method to identify basic and leading sectors in its regions [2],[10],[11],[12],[13].
In practice, classifying potential sector using LQ has some disadvantages, especially in handling LQ value data where the intervals of the sectors aren’t significantly different from each other. It’s because
strict classification based on LQ > 1, LQ = 1 and LQ < 1. Therefore, two sectors with LQ values which aren’t too different can be classified into different groups. It’s not fair if, for example, there are two PDRB sectors with respective values of 0.9899 and 1.002 being classified into different groups, while the LQ values aren’t too different. Moreover, if two similar LQ values are studied further, they can produce new information related with closeness of development gains of PDRB sectors based on the closeness of two LQ values.
Studies on correlation of two data objects which can provide new information have been performed by many researchers, especially to identify development gap. One of the common approaches is hierarchical agglomerative clustering (HAC) method [14],[15],[16],[17].
HAC technique is often used in previous studies to assume regional gap based on formed group(s), without being supported by other regional classification concepts, such as Klassen, Shiff-share
and Location Quotient (LQ)
[18],[19],[20],[21],[22],[23]. So people who aren’t used to HAC technique will have difficulty interpreting cluster result because total formed cluster is uncertain and neither is the cluster label.
HAC algorithm was used because of its ability to classify two data objects into a single cluster based on their distance [13],[14],[15]. It then visualized into dendogram hierarchically, so every interpreter can observe classification result by depth-first-search or breadth-first-depth-first-search [16]. The ability of HAC in classifying data into hierarchy was the basic idea in combining LQ into HAC.
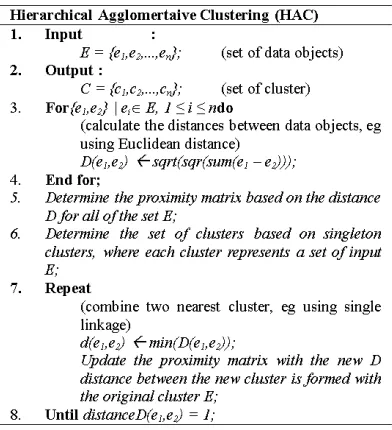
3. HIERARCHICAL AGGLOMERATIVE
CLUSTERING (HAC) METHOD
Hierarchical cluster techniques are generally classified into two types, which are agglomerative and divisive clusterings [24],[25]. These cluster methods form a dendrogram, which represents nested grouping pattern and similarity level in classification process. At certain group level, dendrogam will break into another group level, thus producing a different data group. HAC method algorithm in general is illustrated in Figure 1.
HAC method classifies data by similarity of distance between two data. Distance is calculated by Eucledian Distance equation as shown in equation (1).
Where Deuc is eucledian distance between data x
and y, n is total data vector dimension, while x and
y are the first and second object data, respectively,
[image:3.612.98.294.145.360.2]whose distance will be calculated.
Figure 1: Hierarchical agglomerative cluster algorithm
4. LOCATION QUOTIENT (LQ) METHOD
Location Quotient (LQ) is a method commonly used to determine leading sector of a region
[2],[8],[11],[12]. There are two approaches
commonly used to determine the basic sector of a region, i.e. 1) Static Location Quotient (SLQ) or Location Quotient (LQ) and, 2) Dynamic Location Quotion (DLQ). DLQ is a modification of SLQ to accommodate the growth of sector/sub-sector from time to time. This technique emerges because basic economy theory states that a basic industry produces goods and services for market in the region or markets in other regions. Therefore, result of sales to other regions will bring revenue for the
region. So, income stream will increase
consumption and investment, as well as increasing regional revenue and creating job opportunities. In this paper, the value of LQ was calculated by Static Location Quotient (SLQ) approach as shown in equation (2).
Where LQ is Location Quotient (LQ) index, Si is added value of the ith PDRB sector of a regency, S is added value of the ith PDRB sector of province,
Yj is total PDRB of the jth regency and Y is total PDRB of province. The range of LQ value is classified into three groups, i.e. LQ > 1 which is the basic sector of source of growth which has comparative advantage. The outcome of the sector doesn’t only fulfill the needs of the regency, but can also be exported to other regions. LQ = 1 is non-basic sector and doesn’t have comparative advantage. The outcome of the sector is only enough to fulfill the needs of the region and can’t be exported. Meanwhile, LQ < 1 shows non-basic sector where the outcome of the sector can’t fulfill the needs of the regency so import from other regency is required.
5. MODIFIED AGGLOMERATIVE
CLUSTER WITH LOCATION QUOTIENT (MACLOQ)
Modified agglomerative cluster with location quotient (MACLoQ) is a method developed in the discussion of this paper. This method is a combination of agglomerative cluster and location quotient (LQ) techniques. The agglomerative klaster method is the main algorithm of cluster formation, while LQ is inserted into it. An overview of MACLoQ is shown in Figure 2.
The difference of the results of classification of potential PDRB sectors LQ and MACLoQ is in the re-clustering process of MACLoQ on the group result using LQ. Figure 3 shows the difference of visualizations of group results of LQ and MACLoQ.
Figure 2: Graph of MACLoQ algorithm
b
Figure 3: Visualization of MACLoQ
Figure 3a shows visualization of data of PDRB sectors which are classified by LQ method to form three main clusters, showing potential economic sectors of a region. Meanwhile, Figure 3b shows the classification result of MACLoQ algorithm. Every data in each main cluster is reclassified hierarchically to see the link and closeness of relation between two economic sectors in each main cluster.
6. RESEARCH METHODOLOGY
This research was conducted based on the steps that had been predetermined. GRDP sector data collection is done as an initial stage of research. The next step is to develop a MACLoQ method with a hybridization of LQ techniques into the HAC. The analysis of potential sectors in a certain area is performed to compare the identification
result with MACLoQ. The identification process of GRDP sector of a certain area is then performed with MACLoQ approach to obtain the outcome of hierarchal clusters of potential sector groups and the achievement proximity between each sector. The last step is the test the MACLoQ result by comparing MACLoQ outcomes against LQ.
7. COMPARISON OF LQ, HAC AND
MACLOQ METHODS
In this section, MACLoQ method is compared with LQ and HAC in the process of classification of regional PDRB sector data. PDRB sector data in 2012 from 31 regencies across Central Java was used to be tested in the three methods. The data was obtained from Statistics Indonesia and statistics of Central Java. MATLAB software was used to test PDRB sector data into the three methods. The 31 data of the regencies was tested by LQ, HAC and MACLoQ methods.
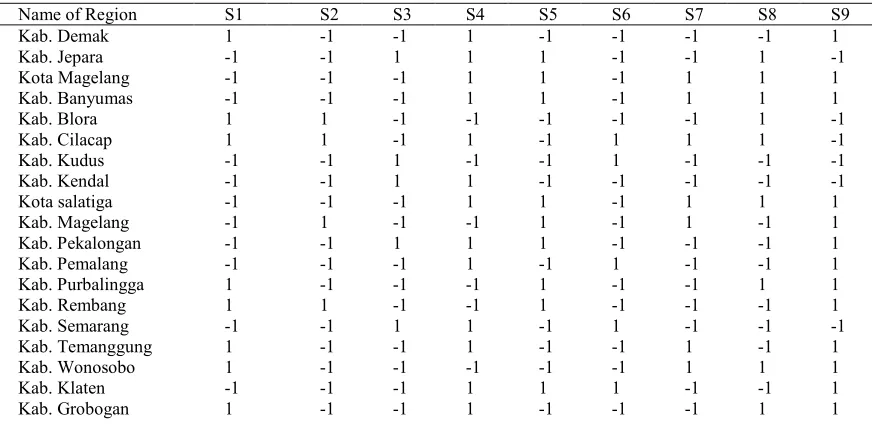
Table 4 is the result of classification of PDRB sectors of 31 regencies across Central Java. The classification result using this method doesn’t have cluster visualization as in HAC and MACLoQ. The result of LQ is classified by the LQ value of every sector. To help describing classification result in this analysis, group LQ > 1 was is as 1, LQ = 1 as 0 and LQ < 1 as -1.
[image:4.612.91.527.517.739.2]The distribution of classification results by LQ of all sectors of all regencies is shown in Figure 5.
Table 3: The result of classification of PDRB sectors of every region using
Name of Region S1 S2 S3 S4 S5 S6 S7 S8 S9
Kab. Demak 1 -1 -1 1 -1 -1 -1 -1 1
Kab. Jepara -1 -1 1 1 1 -1 -1 1 -1
Kota Magelang -1 -1 -1 1 1 -1 1 1 1
Kab. Banyumas -1 -1 -1 1 1 -1 1 1 1
Kab. Blora 1 1 -1 -1 -1 -1 -1 1 -1
Kab. Cilacap 1 1 -1 1 -1 1 1 1 -1
Kab. Kudus -1 -1 1 -1 -1 1 -1 -1 -1
Kab. Kendal -1 -1 1 1 -1 -1 -1 -1 -1
Kota salatiga -1 -1 -1 1 1 -1 1 1 1
Kab. Magelang -1 1 -1 -1 1 -1 1 -1 1
Kab. Pekalongan -1 -1 1 1 1 -1 -1 -1 1
Kab. Pemalang -1 -1 -1 1 -1 1 -1 -1 1
Kab. Purbalingga 1 -1 -1 -1 1 -1 -1 1 1
Kab. Rembang 1 1 -1 -1 1 -1 -1 -1 1
Kab. Semarang -1 -1 1 1 -1 1 -1 -1 -1
Kab. Temanggung 1 -1 -1 1 -1 -1 1 -1 1
Kab. Wonosobo 1 -1 -1 -1 -1 -1 1 1 1
Kab. Klaten -1 -1 -1 1 1 1 -1 -1 1
Kab. Tegal -1 1 1 -1 -1 1 -1 1 -1
Kota pekalongan -1 -1 -1 1 1 1 1 1 1
Kota tegal -1 -1 -1 1 1 1 1 1 -1
Kab. Banjarnegara 1 -1 -1 -1 1 -1 -1 1 1
Kab. Boyolali -1 1 1 -1 1 -1 1 -1 -1
Kab. Brebes 1 1 -1 -1 -1 1 1 -1 -1
Kota surakarta -1 -1 1 1 1 1 1 1 1
Kab. Pati 1 -1 -1 1 1 -1 -1 1 -1
Kab. Sukoharjo -1 -1 1 1 -1 1 -1 -1 -1
Kab. Wonogiri 1 1 -1 -1 1 -1 1 -1 -1
Kab. Batang -1 1 1 -1 -1 -1 -1 -1 -1
Kab. Purworejo 1 1 -1 -1 -1 -1 1 1 1
Figure 5: Graph of distribution of PDRB sector groups using LQ
The next test was performed using HAC method. To test the data of regional PDRB sectors in HAC method, each PDRB sector of regency is divided into 9 data records, so that the total dataset is 31 x 9 or 279 datasets. Every line of data is given a code after the sector name, followed by the name of the region, so that it’s easy to be recognized when hierarchical cluster is formed.
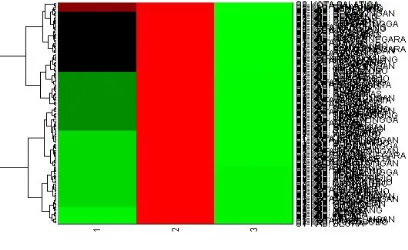
[image:5.612.316.522.324.464.2]The result of classification of PDRB sectors using HAC method by visual dendrogram is quite complex and even make cluster labels group together as shown in Figure 6. This makes interpretation difficult. This happens because all data (279 datasets) are immediately grouped hierarchically.
Figure 6 : Some results of PDRB sector clusters by HAC method
Testing regional PDRB sector data using HAC method produces hierarchical cluster output, but it’s difficult to be interpreted further. Cluster result has to be broken down again to see the closeness between PDRB sectors, whether in the same regency or not. Figure 7 shows a small part of sub cluster broken from overall HAC cluster result.
Figure 7: Some cluster result of PDRB sectors by HAC method
In cluster result using HAC method, it is difficult to determine which was the potential PDRB sector (basic sector with LQ > 1 or LQ = 1) and which is the non-potential PDRB sector (non-basic sector with LQ < 1), because data classification is performed by greedy. One thing found in classification result by HAC is the closeness of development gains between PDRB gains, whether in the same regency or not.
[image:5.612.89.293.577.702.2]respectively.
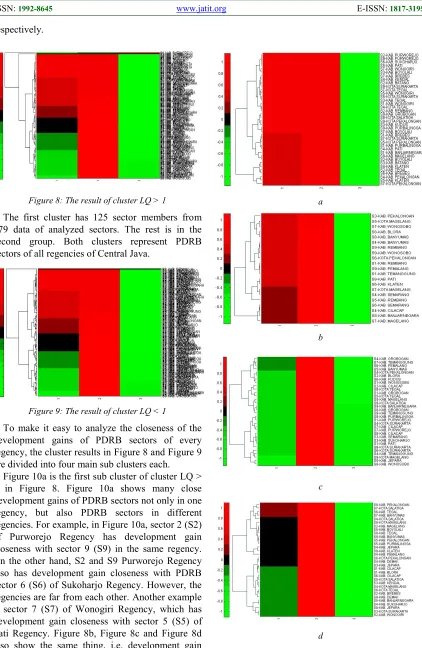
Figure 8: The result of cluster LQ > 1
The first cluster has 125 sector members from 279 data of analyzed sectors. The rest is in the second group. Both clusters represent PDRB sectors of all regencies of Central Java.
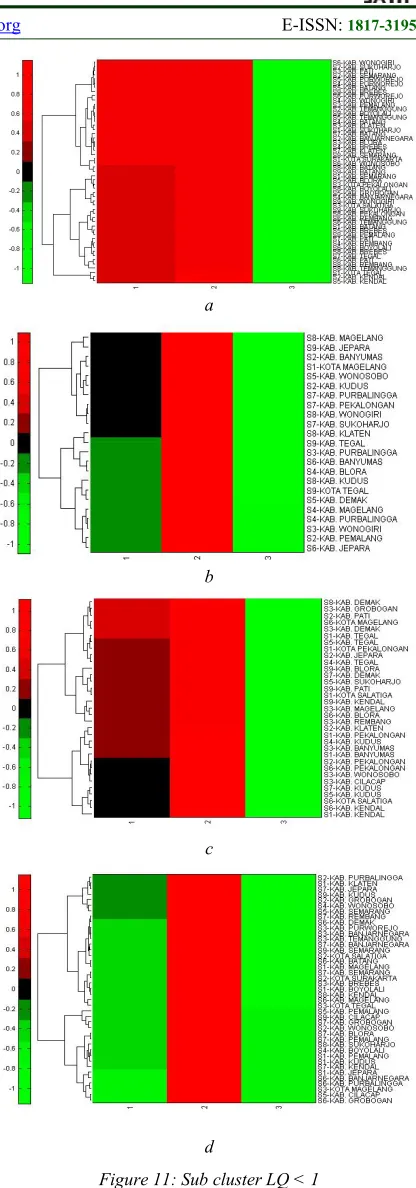
Figure 9: The result of cluster LQ < 1
To make it easy to analyze the closeness of the development gains of PDRB sectors of every regency, the cluster results in Figure 8 and Figure 9 are divided into four main sub clusters each.
Figure 10a is the first sub cluster of cluster LQ > 1 in Figure 8. Figure 10a shows many close development gains of PDRB sectors not only in one regency, but also PDRB sectors in different regencies. For example, in Figure 10a, sector 2 (S2) of Purworejo Regency has development gain closeness with sector 9 (S9) in the same regency. On the other hand, S2 and S9 Purworejo Regency also has development gain closeness with PDRB sector 6 (S6) of Sukoharjo Regency. However, the regencies are far from each other. Another example if sector 7 (S7) of Wonogiri Regency, which has development gain closeness with sector 5 (S5) of Pati Regency. Figure 8b, Figure 8c and Figure 8d also show the same thing, i.e. development gain closeness of PDRB sectors among regencies.
a
b
c
[image:6.612.97.519.70.718.2]d
Other regencies which have development gain closeness of PDRB sectors can be found in Fig. 10a, Figure 10b, Figure 10c and Figure 10d. The rightmost label axis y shows the nth sector (Sn) followed by the name of the regency which has the sector.
The first cluster result (LQ > 1) is the basic sector group and is the growth sector which can be used by regency to support future development. By considering the closeness of the gains of the basic sectors, policy makers can easily determine which PDRB sectors are in line with regency. Sectors in this cluster can be said to be potential sectors of every regency.
Analysis of the first cluster result will be complete if other PDRB sector clusters are formed. In cluster process, three main clusters are expected to emerge based on Location Quotient. However based on existing rule, only two cluster outputs are created based on LQ value. The second cluster is PDRB sector group with LQ < 1 as shown in Figure 9.
Figures 11a to 11d show sub clusters of LQ < 1 which is broken down to make further analysis of cluster results easier. Figure 11a also shows how three regencies with different sectors have close development gains. They are Wonogiri Regency with sector 6 (S6), Sukoharjo with sector 2 (S2) and Pati with sector 3 (S3). The regencies form hierarchical cluster with other regencies for different sectors, i.e. Semarang Regency for sector 2 (S2), Purworejo Regency for sector 5 (S5) and sector 4 (S4), Batang Regency for sector 5 (S5) and Brebes Regency for sector 9 (S9).
The closeness of development gains for other sectors of every regency is shown in Figure 11b, Figure 11c and Figure 11d. In the second cluster result, every cluster member is categorized as a non-basic sector without any competitive advantage at all. It means sectors in cluster LQ < 1 are non-potential sectors, so they should receive serious attention from policy makers to develop them in the
future. The information of closeness of
development gains of non-potential development based of hierarchy formed from this cluster also shows that several sectors in certain regencies have good non-potential level in the regency or compared with other regency. It also shows sector of a regency which has similar gain with other regency.
a
b
c
[image:7.612.313.521.66.660.2]d
Figure 11: Sub cluster LQ < 1
show that cophenet coefficient value for the first group (basic sector with LQ > 1) is 0.9634, while for the second group (non basic sector with LQ < 1) is 0.8025. It means the hierarchical clusters formed in both main groups are very good.
The result of classification by MACLoQ can visualize the comparison between sectors, not only in the same region but also sectors in different regions. Conventional LQ analysis doesn’t have this visualization. Existing hierarchical form also shows how one sector has development gain closeness with another sector based on the distance value of each sector.
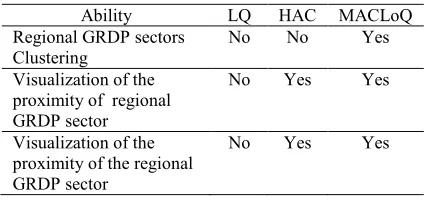
[image:8.612.88.303.420.520.2]Based on the test on all four approaches to identify the potensial of GRDP sectors, it is known that the MAQLoQ method is able to cover some of the functions that are not able to conduct by LQ and HAC. In addition to identify the potensial of GRDP sectors through the results of the clusters, MACLoQ is also able to cluster the potensial of GRDP sectors on the LQ value. Moreover, it is also added by the ability to visualize the proximity of potential sectors possessed by every District. Table 4 shows the differences in the ability of the four methods.
Table 4. Differences between LQ, HAC, and MACLoQ
Ability LQ HAC MACLoQ
Regional GRDP sectors Clustering
No No Yes
Visualization of the proximity of regional GRDP sector
No Yes Yes
Visualization of the proximity of the regional GRDP sector
No Yes Yes
8. CONCLUSION
Classification of PDRB sectors using LQ can only classify sectors into potential and non-potential sectors, but unable to show the closeness of development gains of the sectors, whether in one regencies or not. Meanwhile, classification of PDRB sectors using HAC is the opposite of LQ. Classification of PDRB sectors of regency by HAC can show the closeness of development gain of every sector, but can’t show the potential and non-potential PDRB sectors. Meanwhile, classification of PDRB sectors using MACLoQ generally can show which one is the potential sector and which one isn’t. Moreover, cluster result by MACLoQ can show comparison of development gains among sectors, whether in the same region or not. The
result of classification by MACLoQ in this paper forms two main clusters. The result of both main clusters are reclassified to see the closeness of development gains among PDRB sectors and regencies. The classification result shows that the first cluster (LQ > 1) has many PDRB sectors in a single regency or between regencies which have sector potentials close to each other and form higher hierarchical cluster to further see the relation and closeness of development gains of PDRB sectors. Meanwhile, the second cluster (LQ < 1) also shows the same visualization as the first fluster but shows opposite gains. The second cluster shows how the sectors of a regency aren’t potential sectors, so they should be prioritized in future development.
Cluster result by seeing visualization of closeness of development gains of every sector in regency, whether potential category (the first cluster with LQ >1) or non potential (the second cluster with LQ < 1) can be used as consideration for policy makers to decide the direction of future development.
REFRENCES:
[1] L. Arsyad, Pengantar Peencanaan dan
Pembangunan Ekonomi Daerah, Edisi Pertama, BPFE, Yogyakarta., 1999, in bahasa [2] M. Kuncoro, and A.N. Idris, “Mengapa
Terjadi Growth Without Development Di Provinsi Kalimantan Timur?”, Jurnal Ekonomi Pembangunan, Volume 11, Nomor 2, 172-190, 1999, in bahasa
[3] D. Kiser, A Location Quotient And Shift Share Analysis Of Regional Economies In Texas, Theses Masters Of Public Administration, The Department Of Political Science Southwest Texas State University, 1992
[4] R.S. Mack, and D.S. Jacobson, “Core Periphery Analysis of the European Union : a Location Quotient Approach”, The Journal of Regional Analysis and Policy, Vol. 26 (1), 3 – 21, 1996
[5] R. Champion, and A. Wein, ShakeOut
Scenario Appendix I: Characterizing a
Geological Survey Preliminary Report 25I, 16, 2008
[6] A. Rupasingha, and J.M. Patrick, “Tools for
Understanding Economic Change in
Communities: Economic Base Analysis and Shift-Share Analysis”, College of Agricultural, Consumer and Environmental Sciences, New Mexico State University, 2009
[7] Purdue Center for Regional Development, South Central Illinois Regional Industry Cluster Analysis - Industry Cluster Structure and Trends 2001 – 2010, South Central Illinois
Regional Planning and Development
Commission., 2011
[8] Z. Tian, “Measuring Agglomeration Using the
Standardized Location Quotient with a
Bootstrap Method”, The Journal of Regional Analysis and Policy, Vol. 43(2), 186-197, 2013 [9] P. Thulin, Local multiplier and economic base analysis, Handbook of Research Methods and Applications in Economic Geography, Edward Elgar Publishing, 2014
[10] I.R. Bakaric, “Uncovering Regional Disparities – the Use of Factor and Cluster Analysis”, Economic Trends and Economic Policy, No. 105, 52-77, 2005
[11] D. Sinaga, “DeterminationAnalysis of Leading Economic Sector Against Forming Region GDP in Simalungun”, International journal of Innovative Research in Management, issue 4 volume 3, 2015
[12] S. Fattah, and A. Rahman, “Analysis of Regional Economic Development in the
Regency/Municipality at South Sulawesi
Province In Indonesia”, Journal of Economics and Sustainable Development, Vol.4, No.1, 2013
[13] T. Endaryanto, M. Firdaus, H. Siregar, and D.B, Hakim, “The Impact of Regional Expansion on Economic Structure: A Case Study in Lampung Province, Indonesia”, International Journal of Sciences: Basic and Applied Research (IJSBAR), Volume 23, No 2, 1-18, 2015
[14] F.H. Saad, O.I.E. Mohamed, and R.E.
Al-Qutaish,, “Comparison Of Hierarchical
Agglomerative Algorithms For Clustering Medical Documents”, International Journal of Software Engineering & Applications (IJSEA), Vol.3, No.3, May, 2012
[15] R.W. Sembiring, J.M. Zain, and A. Embong, “A Comparative Agglomerative Hierarchical Clustering Method to Cluster Implemented
Course”, Journal Of Computing, Volume 2, Issue 12, December. (2010)
[16] V. Marinova-Boncheva, “Using The
Agglomerative Method of Hierarchical
Clustering As A Data Mining Tool In Capital Market”, International Journal "Information Theories & Applications", Vol.15, 2008 [17] Y. Gu, and C. Wang, “A Study of Hierarchical
Correlation Clustering for Scientific Volume
Data”, Proceedings 6th International
Symposium Advances in Visual Computing, Las Vegas, NV, USA, 2010
[18] F. Kronthaler, A Study of the Competitiveness of Regions based on a Cluster Analysis: The Example of East Germany, Paper Report Institute for Economic Research Halle (IWH)., 2003
[19] E. Jaba, A.M. Ionescu, C. Iatu, and C.B. Balan, “The Evaluation Of The Regional Profile Of The Economic Development In Romania.”,
Analele Ştiintifice Ale Universitătii
„Alexandru Ioan Cuza” Din Iaşi. Tomul LVI ŞtiinŃe Economice, 2009
[20] M. Vincze, and E. Mezei, “The increase of rural development measures efficiency at the micro-regions level by cluster analysis: A Romanian case study”, Eastern Journal Of European Studies, Volume 2, Issue 1, June, 2011
[21] H. V. Vydrová, and Z. Novotná, “Evaluation Of Disparities In Living Standards Of Regions Of The Czech Republic”, Acta Universitatis Agriculturae Et Silviculturae Mendelianae Brunensis, Volume LX 42 Number 4, 2012 [22] O. Nosova, “The Innovation Development in
Ukraine: Problems and Development
Perspectives”, International Journal Of
Innovation And Business Strategy, Vol. 02/August., 2013
[23] E. Poledníková, “Comparing Regions´ Ranking by MCDM methods: the Case of Visegrad Countries”, WSEAS TRANSACTIONS on BUSINESS and ECONOMICS, Volume 11, 496 – 507, 2014
[24] P. Berkhin, Survey of Clustering Data Mining Techniques, Pavel Berkhin, Accrue Software, 1045 Forest Knoll Dr., San Jose, CA, 2006 [25] A.K. Jain, M.N. Murty, and Flynn, P.J, “Data