STEM CELLS AND REGENERATION RESEARCH ARTICLE
OCT4 activity during conversion of human intermediately
reprogrammed stem cells to iPSCs through
mesenchymal-epithelial transition
Rika Teshigawara1, Kunio Hirano1, Shogo Nagata1, Justin Ainscough2and Takashi Tada1,*
ABSTRACT
To facilitate understanding the mechanisms of somatic reprogramming to human induced pluripotent stem cells (iPSCs), we have established intermediately reprogrammed stem cells (iRSCs), human mesenchymal cells that express exogenous Oct4, Sox2, Klf4 and c-Myc (OSKM) and endogenous SOX2 and NANOG. iRSCs can be stably maintained at low density. At high density, however, they are induced to enter mesenchymal-epithelial transition (MET), resulting in reprogramming to an iPSC state. Morphological changes through MET correlate with silencing of exogenous OSKM, and upregulation of endogenousOCT4. A CRISPR/Cas9-mediated GFP knock-in visualized the temporal regulation of endogenous OCT4in cells converting from iRSC to iPSC state.OCT4activation coincident with silencing of OSKM occurred prior to entering MET. Notably, OCT4 instability was frequently observed in cells of developing post-MET colonies until a late stage (>200 cells), demonstrating that OCT4-activated post-MET cells switched from asymmetric to symmetric cell division in late stage reprogramming.
KEY WORDS: CRISPR, Human, MET, OCT4, Reprogramming, IPS
INTRODUCTION
Human induced pluripotent stem cells (iPSCs), first generated by the ectopic co-expression of four reprogramming factors, octamer-binding protein 4 (Oct4also known asPou5f1), SRY-box containing gene 2 (Sox2), Kruppel-like factor 4 (Klf4) and c-myelocytomatosis oncogene (c-Myc also known as Myc) (collectively known as OSKM) in dermal fibroblasts (Takahashi et al., 2007), hold great potential for application in autologous cell therapy, disease modeling and drug discovery. Crucial steps that currently hinder realization of this potential include low efficiency of somatic cell reprogramming and poor reproducibility of high-quality iPSC generation. To help overcome these issues, novel approaches for iPSC production have been developed; however, the efficiency of reprogramming human cells remains less than 0.1% (Stadtfeld and Hochedlinger, 2010). Thus, generation of iPSCs is still an extremely time-consuming process. Thorough understanding of the mechanisms that modulate epigenetic reprogramming of somatic to pluripotent cells has important implications for downstream iPSC applications. However, the low efficiency and stochastic nature of reprogramming make dissecting the underlying mechanisms extremely difficult.
Success in this area has been largely restricted to investigations using mouse cells. In mice, it has been proposed that extinction of the somatic program and subsequent activation of endogenous pluripotency genes are key roadblocks in the process of reprogramming to iPSCs (Stadtfeld and Hochedlinger, 2010). Somatic reprogramming to iPSCs can be considered a gradual process with intermediate cell populations. Notably, somatic cell conversion to iPSCs is accompanied by striking morphological changes as the cells transit from a mono-layer of adherent cells to multilayered epithelial cells, a process reminiscent of mesenchymal-epithelial transition (MET). This early step is crucial for successful reprogramming in the mouse (Li et al., 2010; Samavarchi-Tehrani et al., 2010). FACS-sorted intermediately reprogrammed cells, generated from doxycycline-inducible OSKM-expressing somatic cells, were used for single-cell gene expression analysis (Polo et al., 2012). This indicated that transcription factor-induced pluripotency elicited two waves of transcription, driven byc-MycandKlf4(first wave) andOct4,Sox2, Klf4(second wave). In the first wave, Ssea1+(also known as Fut4), Thy1− cells entered into MET, evidenced by downregulation of Snai1and upregulation ofE-cadherin(also known asCdh1) at day 3 after OSKM induction. Subsequently, anOct4-GFPreporter was upregulated in the second wave at day 8-10 prior to formation of stable iPSC colonies. In addition to Ssea1, three genes, Epcam, c-Kit(also known asKit) andPecam1were identified as markers for enrichment of reprogrammable cells at early (0-3 days) and late (day 9 onward) time points. Other detailed analyses in single cells at various stages during somatic reprogramming to iPSCs demonstrated that expression ofEsrrb,Utf1,Lin28aandDppa2 were better predictors for enrichment of cells progressing into iPSCs (Buganim et al., 2012).
In human, iPSCs have several distinct features that are different from mouse iPSCs. Human iPSCs form characteristic flat-shaped colonies, in contrast to bowl-shaped colonies formed by mouse iPSCs. The gene expression profile of human iPSCs resembles that of mouse epiblast stem cells in a primed state of pluripotency rather than that of mouse iPSCs in a naive state of pluripotency. Notably, human iPSCs are distinct from mouse iPSCs in their response to two kinase inhibitors (MAP/ERK inhibitor and GSK3 inhibitor) (Hirano et al., 2012). Furthermore, human somatic cells can be conventionally reprogrammed using human embryonic stem cell medium supplemented with knockout serum replacement and basic fibroblast growth factor (bFGF) but not using mouse embryonic stem cell medium supplemented with fetal bovine serum (FBS) and leukemia inhibitory factor (LIF), which is widely used in mouse iPSC generation. Collectively, these differences between human and mouse iPSCs indicate distinct processes of somatic cell reprogramming, even where the same transcription factor-induced reprogramming system is utilized.
Received 1 September 2015; Accepted 24 November 2015
1
Department of Stem Cell Engineering, Institute for Frontier Medical Sciences, Kyoto University, 53 Kawahara-cho, Shogo-in, Sakyo-ku, Kyoto 606-8507, Japan.
2
Department of Biology, University of York, York YO10 5DD, UK.
*Author for correspondence ([email protected])
DEVEL
O
Several types of mouse pre-iPSC lines, which were endogenous Oct4−, have been isolated (Chen et al., 2013; Theunissen et al., 2011). In human, partially reprogrammed iPSCs resumed reprogramming by upregulation ofKLF4(Nishimura et al., 2014), and pre-iPSC-like cell lines were established as cancer stem cell lines (Nagata et al., 2012). However, no intermediately reprogrammed stem cells (iRSCs) capable of restarting reprogramming into iPSCs, have been established as stable cell lines. Recently, in mouse, global gene expression analyses of reprogramming colonies demonstrated that the pluripotent spectrum of somatic reprogramming encompasses multiple states (Tonge et al., 2014). Compact colony forming class (C-class) cells were Nanog−, whereas alternative fuzzy colony forming class (F-class) cells were Nanog+. It is therefore possible that somatic reprogramming encompasses an alternative intermediate pathway (Nanog+F-class), in addition to Nanog−C-class, even in human reprogramming.
Here, we describe the isolation and characterization of clonally expandable, human iRSCs, capable of resuming reprogramming to iPSC stage. GFP knock-in to the endogenous OCT4 locus by CRISPR/Cas9-mediated genome editing enabled investigation of OCT4-GFPactivation kinetics as the cells transit from iRSCs to iPSCs.
RESULTS
Establishment of iRSC lines
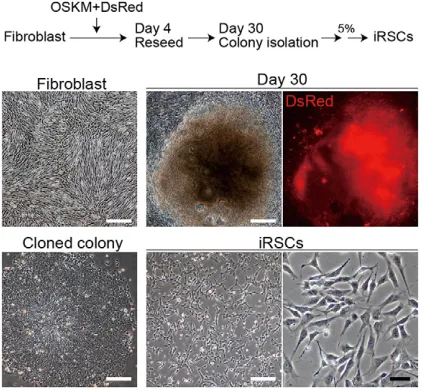
To explore whether stable intermediately reprogrammed human cells could be isolated and maintained, DsRed+ colonies were isolated 20-30 days after retroviral transduction ofOct4,Sox2,Klf4, c-Myc and DsRed into Slc7a1-expressing human fetal lung fibroblasts (Takahashi et al., 2007), TIG1 and TIG3. These colonies were dissociated into single cells and expanded on Matrigel-coated culture dishes in MEF-conditioned medium in the absence of a feeder cell layer (Fig. 1). Approximately 100 colonies were generated per 10 cm culture dish. Two types of cells self-renewed and formed stable colonies, whereas the majority of cells appeared differentiated and/or disappeared following subculture. One type of colony closely resembled cancer stem cells (Nagata et al., 2012), the other retained phenotypic characteristics similar to
those of mesenchymal cells, with large nuclei. These colonies were established at a frequency of∼5% of picked colonies and could be stably maintained as scattered cells through subculture in MEF-conditioned medium for more than 40 passages. Eleven such iRSC lines were independently established. Importantly, the cells retained normal karyotype through repeated passage (Fig. S1). More importantly, the cells were observed to spontaneously progress into iPSCs at high frequency, when cultured for 3 or more days without subculture. Thus, reprogramming of the ‘mesenchymal’ cells into iPSCs was induced by simple change in culture condition to high density. These pre-iPSC mesenchymal cells are hereafter referred to as ‘intermediately reprogrammed stem cells’(iRSCs) and have been stably maintained as established cell lines. Reprogramming of iRSCs to iPSCs was observed even after iRSCs were maintained for more than 40 passages. These cells therefore appear to represent a stage in the somatic-to-iPSC reprogramming process at which the cells are paused in an intermediately reprogrammed state, awaiting further external cues.
Characterization of iRSCs
To characterize the properties of iRSCs, we first analyzed gene expression by RT-PCR and gene expression microarray. In iRSCs, exogenous Oct4, Sox2, Klf4 and c-Myc were expressed but endogenous OCT4 was silenced (Fig. 2A). Pluripotent marker genes, TDGF1 and REX1 were repressed, whereasNANOG and endogenousSOX2were expressed.NANOGexpression is likely to be driven by exogenous Oct4 and Sox2 (Kuroda et al., 2005). Gene expression microarray analyses demonstrated that the global gene expression profile of iRSCs is intermediate between TIG1 cells and iPSCs (Fig. 2B). The intermediate state was confirmed by comparative scatter plot analyses between iRSCs and TIG1 cells, and iRSCs and iPSCs (Fig. 2C). Independently isolated iRSC lines showed a similar global gene expression profile (Fig. S2). Endogenous NANOG and SOX2 were activated, whereas OCT4 and c-MYC remained repressed. Somatic markers FOXC1 and MEIS2were expressed in iRSCs. To verify the intermediate state of iRSCs, gene expression was analyzed (Fig. 2D). No expression of the pluripotent marker proteins SSEA4, TRA1-60 (also known as HSP90B1) and ECAD (E-cadherin, also known as CDH1) was observed, but NANOG was readily detectable (Fig. 2E). Consistent with the RT-PCR expression analysis, the OCT4 promoter was found to be hypermethylated in iRSC and TIG1 cells, and hypomethylated in iPSCs (Fig. 2F). These data support the notion that iRSCs are stably arrested in an intermediate state, between somatic cells and iPSCs during the reprogramming process.
Reprogramming of iRSCs to iPSCs
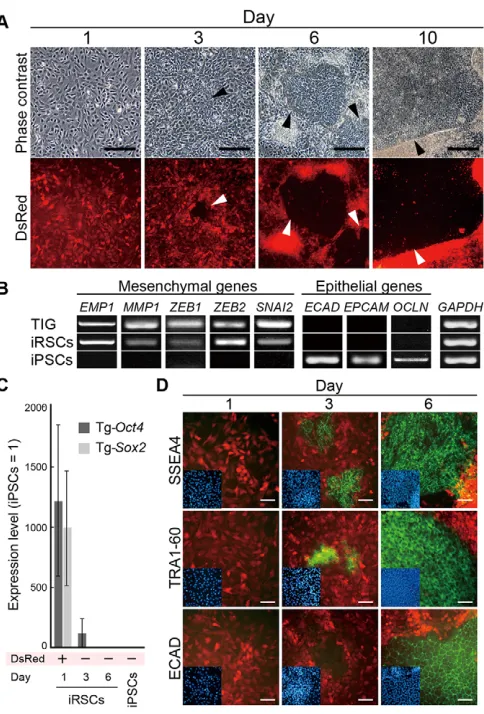
[image:2.612.69.280.489.684.2]To confirm that iRSCs are indeed intermediately reprogrammed cells capable of continued reprogramming into iPSCs at high frequency, DsRed+ iRSCs were plated at high cell density (1.0×10⁶) on Matrigel-coated 3.5 cm wells (day 0) and maintained in MEF-conditioned human iPSC medium for 3 days. DsRed− flat-shaped colonies consisting of 8-16 cells could be readily detected by day 3, with approximately 50-80 distinct colonies forming in each well by day 6 (Fig. 3A). All of the colonies grew rapidly and developed as tightly connecting cells by day 6. At day 10, colony morphology closely resembled that of human iPSCs. Notably, because of the high frequency of colony formation, we were able to efficiently track, for the first time, reprogramming of iRSCs to iPSCs by time-lapse imaging. This clearly showed that reprogramming of iRSCs repressed DsRed marker gene expression at a very early stage, and cells then Fig. 1. Method for establishment of intermediately reprogrammed stem
cells (iRSCs).Human iRSCs are derived from TIG1 fibroblasts by retroviral transduction of OSKM (Oct4, Sox2, Klf4 and c-Myc). DsRed is the reporter gene of exogenous OSKM. White scale bars: 300 µm; black scale bar: 50 µm.
See also Fig. S1.
DEVEL
O
promptly divided into two flat cells with characteristic epithelial morphology (Movies 1-3). The epithelial cells exhibited a cycling time of approximately 10 h and rapidly expanded to form packed iPSC colonies. To verify the observed switch from mesenchymal iRSCs to iPSCs, expression of mesenchymal and epithelial marker genes was analyzed by RT-PCR. Mesenchymal genes including ZEB1andSNAI2were expressed in iRSCs, but epithelial genes such as ECAD and EPCAM were not expressed (Fig. 3B). Conversely, epithelial genes but not mesenchymal genes were expressed in samples derived from iPSCs. These data demonstrate that MET occurred during iRSC to iPSC reprogramming. iPSCs generated from iRSCs had similar properties to iPSCs generated using conventional protocols, evidenced by expression of
pluripotency marker proteins, OCT4, NANOG and ECAD, retention of normal karyotype and retention of widespread differentiation potential to form various cell types in teratomas (Fig. S3).
[image:3.612.90.522.57.518.2]To investigate the switch in expression from the exogenous to endogenous (Oct4-OCT4andSox2-SOX2) genes, expression was analyzed by quantitative (Q-)PCR in MET. Following the observed downregulation of DsRed reporter expression immediately prior to transformation from mesenchymal to epithelial cells (Movies 1 and 3), exogenousOct4andSox2were silenced by day 3 (Fig. 3C). No expression of exogenous reprogramming genes was detected in iRSCs at day 6, or in established iPSCs. In addition to silencing of the exogenous genes, expression of pluripotent marker proteins, Fig. 2. Characterization of human iRSCs.(A) Expression of pluripotency-associated genes. Endo, endogenous genes; Tg, transgenic genes.NANOG,TDGF1 andREX1are pluripotency genes.GAPDHis positive control. (B) Hierarchical clustering (top) and heat map (bottom) of global gene expression. (C) Scatter plot of gene expression in TIG1 fibroblasts, iRSCs and iPSCs. Red lines indicate fourfold change in signal intensity. Blue circle, somatic genes; red circle, pluripotency genes with greater than fourfold change; green circle, pluripotency genes with less than fourfold change. (D) Expression of pluripotency-associated genes in iRSCs. Error bars represent the s.e.m. of triplicate samples. (E) Immunocytochemistry of pluripotency-associated (NANOG, SSEA4, TRA1-60) and epithelial marker (ECAD) proteins. Immunopositive cells are green. Scale bars: 100 µm. (F) DNA methylation in promoter region ofOCT4gene. See also Fig. S2.
DEVEL
O
SSEA4 and TRA1-60 at day 3, and ECAD at day 6 was observed by immunocytochemistry (Fig. 3D). In conclusion, onset of MET in iRSCs is induced by culture at high cell density, coupled with silencing of exogenous reprogramming genes and continued progression toward generation of iPSCs.
Visualization of endogenous OCT4 in reprogramming
To monitor endogenous OCT4 expression in living cells, OCT4-2A-GFP-PGK-Puro was integrated at the end of the exon 5 ofOCT4 using CRISPR/Cas9 (Fig. 4). Two of 60 puromycin-selected clones expressed GFP after complete reprogramming to iPSCs. No DNA mutations were detected at the GFP-integrated allele of two clones. One iRSC clone had an eight-base deletion at the counterpart of the GFP-integrated allele, whereas another clone was intact. Therefore, the OCT4-GFP iRSC (OG-iRSC) clone heterozygous for GFP with an intact wild-type allele was used for the following experiments. To prevent any potential negative influence of the PGK promoter-driven puromycin resistance gene in OCT4 expression, PGK -Puromycinwas eliminated from the clone by transient expression of Cre recombinase (Fig. 4). Finally, strong GFP expression was
detected in iRSC-derived iPSC cytoplasm in two out of eight clones picked. The GFP integration site was again verified by genomic PCR with two independent clones (Fig. 4). The 1071 bp PCR product of OCT4 (lane 1, pink) contains the junction between the left arm and intron 3, whereas the 498 bp product (lane 3, green) shows integration of 2A-GFP. Heterozygous OCT4 in lane 2 (blue) demonstrates integration of GFP as a 1764 bp product for the targeted allele and a 921 bp product for the wild-type allele. To validate the integration site more precisely, DNA sequence analysis was performed around intron 3 and exon 5 ofOCT4(Fig. S4).
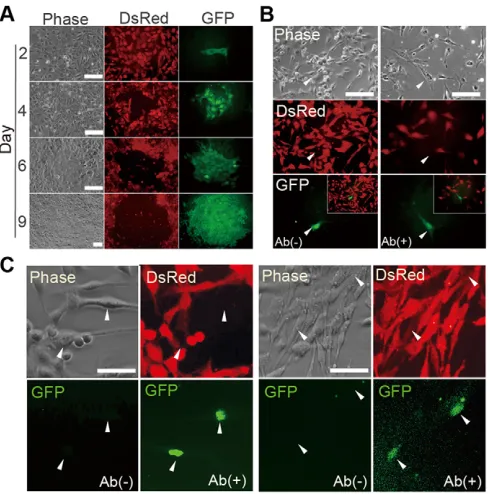
To report on endogenous OCT4 activity in iPSCs, GFP expression was assessed at days 2, 4, 6 and 9 following resumption of reprogramming of OG-iRSC culture at high density (Fig. 5A). MET, exogenous DsRed silencing and GFP activation were coincident, suggesting that endogenous OCT4 activation can be appropriately reported through tagged GFP. Importantly, this provides a sensitive marker for reprogramming of OG-iRSCs into iPSCs.
Endogenous OCT4 activation prior to entry into MET
[image:4.612.314.561.54.240.2]To explore activation timing of endogenous OCT4 in reprogramming of iRSCs into iPSCs, GFP expression was observed 2 days after iRSC culture at high density. GFP expression was frequently detected in isolated DsRed− cells that retained mesenchymal cell phenotype (Fig. 5B). GFP expression was also assessed by immunocytochemistry using anti-GFP antibody 24 h after high-density culture, prior to build up of sufficient observable GFP protein (Fig. 5B). DsRed−mesenchymal iRSCs were antibody positive at this early time point, indicating that activation of endogenous OCT4 occurs before entry into MET during iRSC to iPSC reprogramming. To further assess the reciprocity of GFP and DsRed expression, we performed detailed microscopic observation using the anti-GFP antibody. Thirty-eight (88%) of forty-three GFP+iRSCs were negative for DsRed, whereas five (12%) were faintly positive (Fig. 5C). No DsRed−and GFP− cell was detected at pre-MET. In general, DsRed expression was rapidly replaced by GFP, suggesting that exogenous OSKM Fig. 3. Conversion of iRSCs to iPSCs through mesenchymal-epithelial
transition (MET).(A) Sequential change of iRSCs to iPSCs at day 1, 3, 6 and 10. Arrowheads, DsRed−iPSC colonies. Scale bars: 200 µm. (B) Expression switches from mesenchymal to epithelial profile in MET. (C) Transcriptional silencing of exogenousOct4andSox2. All reactions were performed in duplicate. Error bars represent s.e.m. of triplicates. (D) Immunocytochemistry of pluripotency-associated (SSEA4, TRA1-60) and epithelial marker (ECAD) proteins. Immunopositive cells are green. Scale bars: 50 µm. Red, DsRed; blue (inset), DNA. See also Fig. S3 and Movies 1-3.
Fig. 4. Genome editing for OCT4-GFP iRSCs.Homologous recombination between the humanOCT4and OCT4-2A-GFP-LoxP-PGK-Puro-LoxP was promoted by CRISPR/Cas9 with a 20 base pair target sequence (5′ -TCTCCCATGCATTCAAACTG-3′), including stop codon on exon 5. The PGK-Puro cassette was eliminated after targeting byCre-LoxP deletion. Genomic PCR of OG-iRSC is shown on bottom right. The location of each PCR product is represented by the same color bar in the diagram of OCT-2A-GFP. E, exon; Puro, puromycin; p.c., positive control; n.c., negative control. See also Fig. S4.
DEVEL
O
[image:4.612.54.296.55.412.2]silencing and endogenous OCT4 activation are tightly linked events that precede or are concurrent with initiation of MET.
Instability of OCT4 in post-MET reprogramming
To explore whether iRSCs can be reprogrammed into iPSCs as elite cells following endogenous OCT4 activation, GFP expression was closely monitored in early post-MET colonies (Fig. 6A). Cells in colonies were DsRed−and GFP+1-2 days after entry into MET. Remarkably, a proportion of the DsRed− cells within post-MET colonies became GFP− (endogenous OCT4−) 3-9 days after MET (Fig. 6A,B). Time-lapse imaging demonstrated reversion of some GFP+post-MET cells to GFP−after cell division, indicating that OCT4 silencing may be a cell cycle dependent event (Movie 4). Consistent with this, it has been suggested that cell cycle dependent gene regulation might occur late in reprogramming (Tanaka et al., 2015). Emergence of GFP−post-MET cells was clearly detectable within colonies consisting of 25-200 cells. To verify the apparent instability of OCT4 during this crucial early stage of the reprogramming process, post-MET colonies were immunostained with anti-GFP antibody (Fig. S5). Some cells became detectable as GFP+, suggesting low-level expression below the sensitivity of GFP protein alone. Other cells, however, remained clearly GFP−. Both GFP+ and GFP− cells showed DsRed− epithelial morphology, indicating that MET had occurred. The emergence frequency of GFP−, DsRed−cells over the time course of early reprogramming is summarized in Fig. 6B. GFP−, DsRed− cells were frequently detected within colonies composed of 8-200 cells (day 3-10). By
contrast, colonies of more than 200 cells contained fewer GFP−, DsRed− cells, suggesting stabilization of endogenous OCT4 expression. The differential of GFP intensity between GFP−and GFP+ cells at day 3 was striking, with little evidence of cells expressing intermediate levels (Fig. 6C).
To determine whether exogenous OSKM was silenced in GFP− cells as well as GFP+ cells in post-MET colonies, total RNA of 10-100 cells micro-dissected from colonies were amplified by Q-PCR with exogenous OSKM- and DsRed-specific primer sets. All genes were found to be silenced to the same extent in GFP−and GFP+ cells (Fig. S6A). Lack of ectopic expression of OSKM in post-MET GFP− and GFP+ cells suggests that the observed instability of endogenous OCT4 is a characteristic and possibly regulated phenomenon in early post-MET colonies. This is likely to hold true, even for development of OSKM-integration-free iPSCs. To examine the fate of GFP− cells, endogenousOCT4,SOX2, KLF4,c-MYCandNANOGtranscription was examined by Q-PCR (Fig. S6B). OCT4 and NANOG were significantly decreased in GFP−cells relative to GFP+cells, whereasSOX2,KLF4andc-MYC were expressed at similar or higher levels. Thus, GFP− cells are evidently committed to differentiate down particular cell lineages. Further Q-PCR analyses withPAX6-andNESTIN-specific primer sets demonstrated that neural differentiation was initiated in some GFP− cells (Fig. S6C) in which OCT4 and NANOG were downregulated.
To examine whether GFP−cells can convert to GFP+cells, 10 independent GFP− colonies comprising 8-25 cells identified 3-9 days after MET induction were assessed every 12 h for the following 7 days. In all 10 colonies, no induction of GFP was detected (Fig. S7), indicating that GFP− cells entered a state of recoverable pluripotency with induction of differentiation.
Collectively, the data suggest that activation of OCT4 in early post-MET cells is insufficient for determining the cell fate in reprogramming toward iPSCs. Several rounds of cell cycle after entry into MET may be required for establishment of a stable pluripotency molecular network, which enables symmetric cell divisions (Fig. 6B).
DISCUSSION
We have established human iRSC lines that are stably paused prior to entry into MET. These novel intermediately reprogrammed cells resume conversion to iPSCs, when cultured at high density. iRSCs maintain a mesenchyme-like morphology with a unique gene expression profile characterized by transcription of
exogenous OSKM and endogenous SOX2 and NANOG.
Endogenous OCT4 remains silent. Dramatic morphological change in MET, an early reprogramming event in iRSC-to-iPSC conversion, coincides with silencing of exogenous genes and activation of endogenous OCT4. Furthermore, visualization of endogenous OCT4 through CRISPR/Cas9-mediated genome editing in iRSCs revealed that OCT4 activation occurs before entry into MET. In the early development stage of post-MET colonies, instability ofOCT4expression resulted in a commitment to cell differentiation. Thus, endogenousOCT4activation is a key event, but is insufficient on its own as a marker of reprogramming of iRSCs into iPSCs.
[image:5.612.53.298.57.304.2]These newly established iRSC lines are the first intermediately reprogrammed cells able to resume reprogramming under defined culture conditions. In mice, it was thought that intermediately reprogrammed cells with silenced somatic genes, active SSEA1 and potential for conversion to iPSC state, are transient (Hochedlinger and Plath, 2009). Conversely, partially reprogrammed cells that Fig. 5. Reprogramming of OG-iRSCs to iPSCs.(A) Visualization of OCT4
expression as GFP in reprogramming of OG-iRSCs to iPSCs at day 2, 4, 6 and 9. Phase, phase contrast. (B) Endogenous OCT4 activation prior to entering MET. Mesenchymal iRSCs were DsRed−and GFP+within 24 h of high-density
culture. GFP was detected using an anti-GFP antibody at 24 h (right panels). By 48 h, GFP was clearly detectable without antibody (left panels). Arrowheads indicate DsRed−and GFP+cells. (C) Silencing of DsRed in GFP+ iRSCs. Detection of GFP expression in DsRed−pre-MET iRSCs with anti-GFP antibody, even in GFP−iRSCs without anti-GFP antibody (left panels). About 10% GFP+cells with anti-GFP antibody were faintly positive for DsRed (right panels). Arrowheads indicate GFP+cells. Phase, phase contrast; Ab, antibody. Scale bars: 100 µm in A,B and 50 µm in C.
DEVEL
O
express reprogramming transgenes and activating proliferation genes, but not endogenous pluripotency genes, have been established as stable cell lines. However, these lack the potential for conversion to iPSCs (Hochedlinger and Plath, 2009). Thus, establishment of human iRSCs as stable cell lines was unexpected. Importantly, our iRSCs are marked by expression of core endogenous pluripotency factors, SOX2 and NANOG, in addition to exogenous OSKM, but not endogenous OCT4. Expression of SOX2 and NANOG in a pre-MET state in humans differs from expression of Nanog post-MET for iPSC maturation in mice (Brambrink et al., 2008; Wernig et al., 2008).
Resumption of reprogramming by activation of endogenous OCT4occurred simultaneously with silencing of OSKM. Notably, all OSKM transgenes integrated into the human genome were expressed in iRSCs. It is possible that retention of exogenous OSKM expression is required for iRSC stability in an intermediately reprogrammed state. If so, the iRSC state might be transient in integration-free iPSC generation systems (Stadtfeld and Hochedlinger, 2010). A similar situation was reported for human naive-like iPSCs derived by doxycycline-induced temporal expression of OSKM and Nanog (Buecker et al., 2010), suggesting that expression of OSKM functions to trap cells at an intermediately reprogrammed stage. Consistent with the idea, low-level expression ofKlf4paused reprogramming into mouse iPSCs (Nishimura et al., 2014). Furthermore, partially reprogrammed human iPSCs, but not cell lines, emerged under similar conditions (Nishimura et al., 2014). It is interesting whether reprogramming efficiency of human iRSC to iPSC can be improved by temporal elevation ofKLF4.
It remains unclear whether the reprogramming pathway from somatic cell to iPSC is fixed. Recently, it was demonstrated in the mouse that the pluripotency spectrum can encompass multiple, unique cell states, including an alternative somatic reprogramming path to iPSCs through a Nanog+transient state, in addition to the preconceived Nanog− transient state (Tonge et al., 2014). In this context, human iRSCs, in which NANOG was precociously expressed prior to activation of endogenousOCT4, could exhibit a similar alternative reprogramming pathway. Interestingly, we found secondary conversion of isolated iRSCs that failed to convert during the first-round experiment, suggesting the requirement for an extracellular signal generated within a cellular micro-environment to trigger conversion to iPSC status (data not shown). This elusive signal has not yet been identified. Therefore, human iRSCs can potentially provide new and rapid ways to unravel the molecular mechanisms of alternative paths for somatic reprogramming to iPSCs.
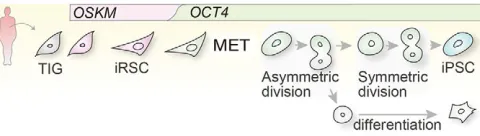
[image:6.612.50.360.57.408.2]It has been debated whether reprogramming entails a hierarchic or stochastic process (Yamanaka, 2009). Once OSKM are silenced and endogenous OCT4 activated in a stochastic manner further reprogramming processes are proposed to progress in a hierarchical manner (Buganim et al., 2012). By contrast, other authors have suggested that endogenous Oct4 activation is insufficient for progression of subsequent events in mouse somatic reprogramming (Greder et al., 2012; Silva et al., 2008). Notably, in human iRSC to iPSC reprogramming, time-lapse analyses of endogenous OCT4 activity clearly showed that GFP+ (OCT4+) cells may divide asymmetrically to form GFP+and GFP– cells soon after OCT4 activation. Thus, early OCT4+ cells have Fig. 6. Instability of OCT4-GFP expression.(A) Instability of OCT4 expression in post-MET iRSCs toward
reprogramming into iPSCs. White dotted lines denote cells within reprogramming colonies that are DsRed−and GFP− without immunostaining. Phase, phase contrast. Scale bars: 100 µm. (B) Emergence frequency of GFP+colonies
in early post-MET reprogramming. GFP+colony: more than 95% cells are GFP+in DsRed−colony. Cell division switched from asymmetric to symmetric in early post-MET iRSCs (top diagram). Gray bars show timing of switching from asymmetric to symmetric cell division after resumption of reprogramming. Error bars represent the s.e.m. of 20 samples at each point. (C) Comparison of relative intensity of GFP between GFP+and GFP−cells. GFP intensity relative to that in day 10 (GFP stable) GFP+cells in GFP+ and GFP−cells at day 3 (GFP unstable). Data are means±s.d. GFP+cells and GFP−cells at day 3,n=20; GFP+cells at day 10,
n=30. See also Figs S5-S7 and Movie 4.
DEVEL
O
epigenetic heterogeneity and instability through cell division before acquiring full pluripotency whereby a parent cell divides to form two daughter cells with the same pluripotent identity (Movie 4). Given that reprogramming is essentially a process of rewinding normal embryonic development, it is not unreasonable to expect switch from stem cells having traits of asymmetric cell division to those having the property of symmetric cell division (Fig. 7). We suggest that instability of endogenous OCT4 is linked to the cell characteristics of symmetric or asymmetric division.
In mice, MET occurs early in reprogramming of MEFs to iPSCs, characterized by upregulation of the epithelial genesE-cadherinand Epcam, and downregulation of the mesenchymal genesSnai1and N-cadherin(Polo and Hochedlinger, 2010). In humans, we find that MET occurs at a later stage. We also show that, in humans, activation of endogenous OCT4 occurs with entry into MET, whereas in mice, endogenousOct4is activated much later (Li et al., 2010; Polo et al., 2012; Samavarchi-Tehrani et al., 2010). Together, the data suggest that MET is a checkpoint for entry into a primed state of pluripotency, whereas activation of endogenous OCT4/Oct4 commits the cell to continued reprogramming through activation of OCT4/Oct4-induced pluripotency molecular networks. In this context, in mice, the first wave of reprogramming driven by c-Myc and Klf4 might induce MET-specific epigenetic and transcriptional changes, rendering the cell in a primed state of pluripotency (Li et al., 2010). The second wave induced byOct4, Sox2andKlf4occurs much later and drives the cell into a naive state of pluripotency (Polo et al., 2012). Thus, mouse somatic cell reprogramming to iPSC progresses from a primed to naive state in chronological order. In humans, MET and second-wave events occur simultaneously, late in the process. This implies that, in mice, the primed state is generated at a much earlier stage, with additional steps required prior to activation of endogenousOct4. It is possible that, in humans, further epigenetic modification events are required between MET and activation of endogenousOCT4for generation of naive iPSCs. We suggest that human iRSCs are a powerful tool for dissecting these latter events of reprogramming.
A key event in iRSC reprogramming to iPSC is entry to MET concomitant with gene silencing of exogenous OSKM and activation of endogenous OCT4. Moloney murine leukemia virus (MoMLV)-derived vectors ( pMXs) were used for human iRSC generation. Negative regulatory elements in MoMLV have been mapped to long terminal repeats (LTRs) (Hotta and Ellis, 2008). One retroviral silencer (TRIM28) that binds to the primer-binding site of MoMLV plays an important role in transcriptional silencing (Wolf and Goff, 2007). Interestingly, Trim28 and Cnot3 were identified as transcriptional regulators that uniquely co-occupy putative gene promoters with c-Myc and Zfx, but not other pluripotency-associated factors, including Oct4, Sox2 and Nanog (Hu et al., 2009). Therefore, the large factor A complex that includes
Trim28 might mediate silencing of exogenous OSKM without influencing endogenousOct4. In mice, it has been shown that Sall4 is a master regulator of expression dosage of Sall4 and Oct4, through a transcriptional regulation feedback loop (Yang et al., 2010). In humans, if similar events occur after silencing of
exogenous OSKM by the action of factor A complex,
upregulation of endogenous OCT4 might be induced as a direct consequence of exogenousOct4silencing in an autocrine manner. Many studies have shown that multiple epigenetic pathways are involved in activation of endogenousOCT4, especially changes in histone modification and DNA methylation. The observed DNA hypo-methylation at the endogenousOCT4promoter during transit from iRSCs to iPSCs might be a direct consequence of downregulation of exogenous Oct4. It would be interesting to determine whether a repressive complex containing exogenous Oct4 can bind to the promoter region of endogenousOCT4.
With respect to putative clinical applications of somatic-cell-reprogramming technologies, the use of transcription-factor-mediated direct lineage conversion or intermediate reprogramming without reversion to a fully pluripotent state has gained significant interest. Human iRSCs might represent a suitable cell source for directed conversion without full reprogramming, and for dissecting the molecular mechanisms involved in these alternative approaches. Furthermore, it has been reported that the potential for genetic manipulation of human iPSCs and ESCs, which is desirable for repair of gene mutations and deficiencies, is limited because of the difficulty of single-cell subcloning by dissociation-induced apoptosis (Cheng et al., 2012; Ohgushi and Sasai, 2011). Even when using the Rho-associated kinase (ROCK) inhibitor Y-27632 to protect against apoptosis (Watanabe et al., 2007), substantial effort is required to effectively subclone after gene transfer. By contrast, our mesenchyme-like iRSCs are readily expandable from a single cell after gene transfer using conventional delivery systems. Genome-edited clonal iRSCs are reprogrammable to an iPSC state through simple modification of culture conditions. Thus, genome-edited iPSCs can be readily generated for future research and clinical application, as verified by the generation of iRSCs and OG-iRSC-derived iPSCs. Although OSKM-integrated iRSCs will not be suitable for direct use in regenerative therapy, they can provide an effective and powerful tool for investigating the causes of genetic diseases, and for the screening of drugs followed by genome editing for disease modeling.
MATERIALS AND METHODS Cell culture
[image:7.612.55.295.613.681.2]Human TIG1 and TIG3 fetal lung fibroblasts [Japanese Collection of Research Biosources (JCRB) Cell Bank] expressing Slc7a1(Takahashi et al., 2007) were cultured in Dulbecco’s modified Eagle’s medium (DMEM) (Sigma) containing 10% FBS, and infected withOct4,Sox2,Klf4 c-Myc and DsRed retroviruses. After reseeding onto inactivated MEF feeders 4 days after infection, the culture medium was changed to iPSC medium [DMEM/F12 HAM (Sigma)] supplemented with 20% KSR (Invitrogen), L-glutamine, non-essential amino acids, 2-mercaptoethanol and 10 ng/ml bFGF (Peprotech) at day 5. For establishment of iRSCs, self-renewable colonies were picked between days 20 and 30 and subcultured onto feeder-free Matrigel-coated dishes with MEF-conditioned iPSC medium (CM). iRSCs were stably maintained in CM through subculture at a density of 1.0×10⁶cells per Matrigel-coated 10 cm dish by conventional trypsin dissociation (Invitrogen). For conversion of iRSCs to iPSCs, 1.0×10⁶cells were plated onto feeder-free Matrigel-coated 3.5 cm dishes, and cultured for ∼6-10 days with CM. For analyzing the efficiency of somatic reprogramming to iPSCs, intermediately reprogrammed cells were dissociated at day 30 and treated with CTK [0.25% trypsin, 0.1 mg/ml collagenase IV (Invitrogen), 20% KSR and 1 mM MgCl2in PBS] at 37°C
Fig. 7. Route of human somatic reprogramming to iPSCs.In human somatic reprogramming, silencing of exogenous OSKM genes and activation ofOCT4occur before the key event of MET. In early post-MET, asymmetric division of OCT4+cells generates OCT4−cells. iPSC phenotype is stabilized
after establishment of symmetric division of OCT4+cells.
DEVEL
O
for 5 min. After dissociation with trypsin at 37°C for 5 min, 2.5×10⁵cells were plated onto 3.5 cm feeder-free Matrigel-coated dishes.
Genome editing
To visualize the expression of endogenous OCT4, OCT4-2A-eGFP-PGK-Puro plasmid (Hockemeyer et al., 2011) (Addgene) was introduced into iRSCs.
CRISPR/Cas9 pX330 ( pX330-U6-Chimeric_BB-CBh-hSpCas9) (Cong et al., 2013) (Addgene) was used for higher efficiency of gene targeting. Target sequence oligos were inserted into pX330 following the protocol: www.genome-engineering.org. iRSCs (1.0×10⁷) were trypsinized, washed with DMEM three times and suspended in 1 ml DMEM. The mixture of OCT4-2A-eGFP-PGK-Puro (100μg) and pX330 (100μg) was transfected into iRSCs by electroporation using a Gene Pulser Xcell System (Bio-Rad); at 250 V, 500μF with a 4 mm cuvette (BTX Electroporation Cuvette plus 640; Harvard Apparatus). After electroporation, the cells were seeded onto two feeder-free Matrigel-coated 10 cm dishes and cultured for 4 days at low density. Following selection with 0.5μg/ml puromycin, emerging resistant colonies were picked at day 5-6. Two days later, puromycin selection (0.5μg/ml) was performed again for purification of OCT4-2A-eGFP-PGK-Puro-transfected cell clones.
Subsequently, to excise the PGK-Puro cassette, OCT4-2A-eGFP-PGK-Puro-targeted iRSCs were treated with transient expression of Cre plasmid (800 ng) using Lipofectamine2000 (Invitrogen) according to the manufacturer’s protocol.
Generation of single-cell-derived cDNA libraries
cDNA libraries from single cells were prepared as described previously (Saitou et al., 2002). Single cells were collected from DsRed+iRSCs, and from DsRed−cells at days 3, 6 and 10 from high-density cultures using a glass needle. Each single cell was transferred into a single tube containing lysis buffer, followed by sequential linker ligation, reverse transcription and cDNA amplification. The linear amplification of cDNA libraries was evaluated by spike RNAs (data not shown).
RT-PCR
Total RNA was isolated from cultured cells using TRIzol (Invitrogen) and cDNA synthesized with Superscript III reverse transcriptase following the manufacturer’s instructions (Invitrogen). PCR was performed with Ex-Taq (Takara, Japan) using gene-specific primers. Q-PCR analyses were performed using Power SYBR Green PCR Master Mix according to the manufacturer’s instructions (Applied Biosystems). Samples containing10-100 cells were treated with CellAmp Direct RNA Prep Kit for RT-PCR (Takara) after picking and washing with PBS at 300 g for 5 min. Subsequently, these samples were analyzed by Q-PCR with One Step SYBR PrimeScript RT-PCR Kit II (Takara) according to the manufacturer’s instructions. Primer sequences used are summarized in Table S1.
Bisulfite modification of DNA sequencing
Genomic DNA (1 µg) was treated with using the Imprint DNA Modification Kit following the manufacturer’s instructions (Sigma). The promoter region of the human OCT4 gene was PCR-amplified with specific primers (Table S1).
Microarray
For microarray analyses, 1 µg total RNA or amplified cDNA library was labeled according to manufacturer’s instructions and hybridized to the human genome U133 Plus 2.0 Array (Affymetrix). Raw data were normalized by the MAS 5.0 method using the bioconductor package using the R program (www.r-project.org/). Heat maps of gene expression profile were visualized using the MeV program (www.tm4.org/mev.html). Hierarchical cluster was calculated by Pearson’s correlation coefficient (r) and visualized by the pvclust package in R. For scatter plot analyses, raw data were normalized by the robust multichip average method. Scatter plots were prepared using bioconductor package in R, with the location of each gene indicated manually.
Immunocytochemistry
Cultured cells were fixed with 4% paraformaldehyde in PBS for 10 min at room temperature and pre-treated with blocking solution [3% BSA, 2% skimmed milk (Difco) in PBST (PBS with 0.1% Triton X-100)] at 4°C overnight. The cells were immunoreacted with primary antibodies (Table S2) overnight at 4°C, and incubated with secondary antibody in blocking buffer for 1 h.
Genomic PCR
Isolated genomic DNA of OG-iRSCs was analyzed by genomic PCR. The PCR products were amplified using GoTaq (Promega). Annealing temperature and cycle numbers were set following the method of stepdown PCR (Hecker and Roux, 1996). Primer sequences used are summarized in Table S1.
DNA sequencing
PCR products including GFP sequence or CRISPR/Cas9 target sequence in the OG-iRSC genome were inserted into pGEM-T (Easy) vector (Promega) through TA cloning. The universal primers T7 and SP6 and BigDye Terminator v3.1 Cycle Sequencing Kit (Applied Biosystems) were used for sequencing following the manufacturer’s protocol. All samples were analyzed using an Applied Biosystems 3130/3130xl Genetic Analyzer.
Teratoma
Teratomas, generated 6-8 weeks after transplantation of a cell suspension of 5.0×10⁵iRSCs or iPSCs under the kidney capsule of immunodeficient SCID mice (CLEA, Japan) were paraffin embedded, sectioned and stained with haematoxylin and eosin as described previously (Nagata et al., 2012).
Chromosome analysis
Cells were pre-treated with colcemid (0.3 µg/ml) and trypsinized. The cell suspension was treated with 0.075 M KCl for 8 min, and then fixed using 3:1 methanol:acetic acid. Chromosome spreads were prepared using an air-drying method, stained with DAPI and mounted with Slowfade Gold Antifade Reagent (Invitrogen).
Stability of OCT4 expression
During reprogramming from OG-iRSCs to iPSCs, OCT4-GFP+and OCT4-GFP−cells in colonies were counted manually. Colonies consisting of more than 95% GFP+cells were defined‘GFP+’. iPSC colonies were classified into seven categories (1, 2-8, 8-25, 25-50, 50-100, 100-200, 200+) based on the number of cells. At least 30 colonies in each category were analyzed. Standard error was calculated from average of emergence frequency of GFP+colonies in each category.
GFP expression level in cells
GFP intensity in GFP+and GFP−cells at day 3 was measured with Adobe Photoshop CS6. GFP intensity in a small circle (15 µm diameter/cell) was calculated in each cell. GFP intensity in DsRed+cells around the DsRed− colonies were estimated as background. Stable GFP+cells at day 10 served as a positive control.
Time-lapse imaging
To observe the sequential changes from iRSC into iPSCs in time-lapse imaging, we seed the cells on laminin 521 (Biolamina)-coated 3.5 cm glass-bottom dishes (Matsunami Glass). Cells were viewed using a Fluoview microscope (FV10i-w; Olympus) and 10-50 fields were selected randomly and recorded with image processing software (FV10-ASW 4.1).
Competing interests
The authors declare no competing or financial interests.
Author contributions
R.T. contributed to CRISPR and iRSC experiments; K.H. and S.N. to iRSC experiments; J.A. to discussion and writing; and T.T. to experimental plan, iRSC experiments, discussion and writing.
DEVEL
O
Funding
This work was supported by the Ministry of Education, Culture, Sports, Science and Technology (MEXT) [23390067].
Supplementary information
Supplementary information available online at
http://dev.biologists.org/lookup/suppl/doi:10.1242/dev.130344/-/DC1
References
Brambrink, T., Foreman, R., Welstead, G. G., Lengner, C. J., Wernig, M., Suh, H. and Jaenisch, R.(2008). Sequential expression of pluripotency markers during direct reprogramming of mouse somatic cells.Cell Stem Cell2, 151-159. Buecker, C., Chen, H.-H., Polo, J. M., Daheron, L., Bu, L., Barakat, T. S.,
Okwieka, P., Porter, A., Gribnau, J., Hochedlinger, K. et al.(2010). A murine ESC-like state facilitates transgenesis and homologous recombination in human pluripotent stem cells.Cell Stem Cell6, 535-546.
Buganim, Y., Faddah, D. A., Cheng, A. W., Itskovich, E., Markoulaki, S., Ganz, K., Klemm, S. L., van Oudenaarden, A. and Jaenisch, R.(2012). Single-cell expression analyses during cellular reprogramming reveal an early stochastic and a late hierarchic phase.Cell150, 1209-1222.
Chen, J., Liu, H., Liu, J., Qi, J., Wei, B., Yang, J., Liang, H., Chen, Y., Chen, J., Wu, Y., et al. (2013). H3K9 methylation is a barrier during somatic cell reprogramming into iPSCs.Nat. Genet.45, 34-42.
Cheng, L.-T., Sun, L.-T. and Tada, T.(2012). Genome editing in induced pluripotent stem cells.Genes Cells17, 431-438.
Cong, L., Ran, F. A., Cox, D., Lin, S., Barretto, R., Habib, N., Hsu, P. D., Wu, X., Jiang, W., Marraffini, L. A. et al.(2013). Multiplex genome engineering using CRISPR/Cas systems.Science339, 819-823.
Greder, L. V., Gupta, S., Li, S., Abedin, M. J., Sajini, A., Segal, Y., Slack, J. M. W. and Dutton, J. R.(2012). Analysis of endogenous Oct4 activation during induced pluripotent stem cell reprogramming using an inducible Oct4 lineage label.Stem Cells30, 2596-2601.
Hecker, K. H. and Roux, H.(1996). High and low annealing temperatures increase both specificity and yield in touchdown and stepdown PCR.Biotechniques20, 478-485.
Hirano, K., Nagata, S., Yamaguchi, S., Nakagawa, M., Okita, K., Kotera, H., Ainscough, J. and Tada, T.(2012). Human and mouse induced pluripotent stem cells are differentially reprogrammed in response to kinase inhibitors.Stem Cells Dev.21, 1287-1298.
Hochedlinger, K. and Plath, K.(2009). Epigenetic reprogramming and induced pluripotency.Development136, 509-523.
Hockemeyer, D., Wang, H., Kiani, S., Lai, C. S., Gao, Q., Cassady, J. P., Cost, G. J., Zhang, L., Santiago, Y., Miller, J. C. et al.(2011). Genetic engineering of human pluripotent cells using TALE nucleases.Nat. Biotechnol.29, 731-734. Hotta, A. and Ellis, J.(2008). Retroviral vector silencing during iPS cell induction:
an epigenetic beacon that signals distinct pluripotent states.J. Cell Biochem.105, 940-948.
Hu, G., Kim, J., Xu, Q., Leng, Y., Orkin, S. H. and Elledge, S. J.(2009). A genome-wide RNAi screen identifies a new transcriptional module required for self-renewal.Genes Dev.23, 837-848.
Kuroda, T., Tada, M., Kubota, H., Kimura, H., Hatano, S.-y., Suemori, H., Nakatsuji, N. and Tada, T.(2005). Octamer and Sox elements are required for transcriptional cis regulation of Nanog gene expression. Mol. Cell. Biol. 25, 2475-2485.
Li, R., Liang, J., Ni, S., Zhou, T., Qing, X., Li, H., He, W., Chen, J., Li, F., Zhuang, Q. et al.(2010). A mesenchymal-to-epithelial transition initiates and is required for the nuclear reprogramming of mouse fibroblasts.Cell Stem Cell7, 51-63. Nagata, S., Hirano, K., Kanemori, M., Sun, L.-T. and Tada, T.(2012). Self-renewal
and pluripotency acquired through somatic reprogramming to human cancer stem cells.PLoS ONE7, e48699.
Nishimura, K., Kato, T., Chen, C., Oinam, L., Shiomitsu, E., Ayakawa, D., Ohtaka, M., Fukuda, A., Nakanishi, M. and Hisatake, K.(2014). Manipulation of KLF4 expression generates iPSCs paused at successive stages of reprogramming.Stem Cell Rep.3, 915-929.
Ohgushi, M. and Sasai, Y.(2011). Lonely death dance of human pluripotent stem cells: ROCKing between metastable cell states.Trends Cell Biol.21, 274-282. Polo, J. M. and Hochedlinger, K.(2010). When fibroblasts MET iPSCs.Cell Stem
Cell7, 5-6.
Polo, J. M., Anderssen, E., Walsh, R. M., Schwarz, B. A., Nefzger, C. M., Lim, S. M., Borkent, M., Apostolou, E., Alaei, S., Cloutier, J. et al.(2012). A molecular roadmap of reprogramming somatic cells into iPS cells.Cell151, 1617-1632.
Saitou, M., Barton, S. C. and Surani, M. A.(2002). A molecular programme for the specification of germ cell fate in mice.Nature418, 293-300.
Samavarchi-Tehrani, P., Golipour, A., David, L., Sung, H.-k., Beyer, T. A., Datti, A., Woltjen, K., Nagy, A. and Wrana, J. L.(2010). Functional genomics reveals a BMP-driven mesenchymal-to-epithelial transition in the initiation of somatic cell reprogramming.Cell Stem Cell7, 64-77.
Silva, J., Barrandon, O., Nichols, J., Kawaguchi, J., Theunissen, T. W. and Smith, A.(2008). Promotion of reprogramming to ground state pluripotency by signal inhibition.PLoS Biol.6, e253.
Stadtfeld, M. and Hochedlinger, K. (2010). Induced pluripotency: history, mechanisms, and applications.Genes Dev.24, 2239-2263.
Takahashi, K., Tanabe, K., Ohnuki, M., Narita, M., Ichisaka, T., Tomoda, K. and Yamanaka, S.(2007). Induction of pluripotent stem cells from adult human fibroblasts by defined factors.Cell131, 861-872.
Tanaka, Y., Hysolli, E., Su, J., Xiang, Y., Kim, K.-Y., Zhong, M., Li, Y., Heydari, K., Euskirchen, G., Snyder, M. P. et al.(2015). Transcriptome signature and regulation in human somatic cell reprogramming.Stem Cell Rep.4, 1125-1139. Theunissen, T. W., van Oosten, A. L., Castelo-Branco, G., Hall, J., Smith, A. and
Silva, J. C. R.(2011). Nanog overcomes reprogramming barriers and induces pluripotency in minimal conditions.Curr. Biol.21, 65-71.
Tonge, P. D., Corso, A. J., Monetti, C., Hussein, S. M. I., Puri, M. C., Michael, I. P., Li, M., Lee, D.-S., Mar, J. C., Cloonan, N. et al.(2014). Divergent reprogramming routes lead to alternative stem-cell states.Nature516, 192-197.
Watanabe, K., Ueno, M., Kamiya, D., Nishiyama, A., Matsumura, M., Wataya, T., Takahashi, J. B., Nishikawa, S., Nishikawa, S.-i., Muguruma, K. et al.(2007). A ROCK inhibitor permits survival of dissociated human embryonic stem cells.Nat. Biotechnol.25, 681-686.
Wernig, M., Lengner, C. J., Hanna, J., Lodato, M. A., Steine, E., Foreman, R., Staerk, J., Markoulaki, S. and Jaenisch, R.(2008). A drug-inducible transgenic system for direct reprogramming of multiple somatic cell types.Nat. Biotechnol. 26, 916-924.
Wolf, D. and Goff, S. P.(2007). TRIM28 mediates primer binding site-targeted silencing of murine leukemia virus in embryonic cells.Cell131, 46-57. Yamanaka, S.(2009). Elite and stochastic models for induced pluripotent stem cell
generation.Nature460, 49-52.
Yang, J., Gao, C., Chai, L. and Ma, Y.(2010). A novel SALL4/OCT4 transcriptional feedback network for pluripotency of embryonic stem cells.PLoS ONE5, e10766.