LIQUID MIXTURE CONTROL SYSTEM USING PLC
AZMAN BIN ABDUL RAHMAN
A thesis submitted in
fulfilment of the requirement for the award of the Master of Electrical Engineering
Faculty of Electrical Engineering Universiti Tun Hussein Onn Malaysia
v
ABSTRACT
vi
ABSTRAK
Sistem kawalan campuran cecair ini digunakan untuk mengawal dua atau lebih cecair yang mempunyai nilai PH berbeza, untuk menghasilkan satu campuran baharu dengan campuran yang tepat sebagai satu produk ,serta dapat mengekalkan kualiti produk tersebut. Proses ini berguna untuk industri minuman , makanan , perubatan , kimia dan juga penting untuk penternakan hidupan air dan kawalan PH air.
Tambahan lagi nilai PH yang tepat dalam tubuh hidupan adalah penting bagi mengekalkan kesihatan. Untuk sistem ini isipadu salah satu cecair dapat dipastikan terlebih dahulu sebelum dialirkan kedalam tangki campuran, sistem ini kemudiannya dapat memastikan campuran yang tepat secara automatik bagi satu lagi cecair yang lain supaya menghasilkan nilai PH yang dikehendaki dalam campuran berkenaan, sebagai produk yang mahu dihasilkan.Sistem ini menggunakan PLC sebagai
kawalan.Sistem ini mengadungi enam tangki , lima pump serta satu motor pengaduk campuran. Pengesan PH digunakan bagi mengesan nilai PH dalam
campuran.Pengesan nilai PH ini disambungkan ke terminal analog PLC untuk dibandingkan dengan nilai PH rujukan mengikut program PLC, apabila nilai PH ini setara dengan nilai PH rujukan ,sistem akan menghentikan campuran serta
vii
CONTENTS
TITLE i
DECLARATION ii
DEDICATION iii
ACKNOWLEDGEMENT iv
ABSTRACT v
CONTENTS vii
LIST OF TABLES x
LIST OF FIGURES xi
LIST OF SYMBOLS AND ABBREVIATIONS xii
LIST OF APPENDICES xvi
CHAPTER I INTRODUCTION
1.1 Project Background 1
1.2 Problem Statements 10
1.3 Project Objectives 11
viii
CHAPTER II LITERATURE REVIEW
2.1 2.2
Technology Developments Theory
2.2.1 The important of pH value 2.2.2 Theory of system operation
2.2.3 pH sensor and principles of operation 2.2.4 How does reference electrode work 2.2.5 The ideal pH electrode:
2.2.5.1 But the electrode is practically never ideal 2.2.5.2 The circuit of a pH amplifier
2.2.5 .3 Digital pH Meter 2.2.6 The liquids 2.2.7 PLC
2.2.8.1 Omron PLC Specifications 2.2.9 Pump
2.2. 9.1 Pump theory
2.2.9.2 System Operating point 2.2.9.3 Pump Characteristic
2.2.9.4 Constant Horse Power 13 15 15 17 18 20 21 21 23 24 27 28 31 32 32 33 34 35
CHAPTER III RESEARCH METHODOLOGY
3.1 Project Methodology
3.1.1 System block diagram 3.1.2 System flowchart
3.1.3 Equipments and appliances 3.1.2.1 pH electrode (Sensors)
3.1.2.2 Amplifier 3.1.2.3 Interfacing
3.1.2.4 PLC input Range
ix
CHAPTER IV ANALYSIS AND RESULTS
REFERENCES 71
APPENDICES 72
3.1.2.5 Pumps and motor 3.1.2.6 Peak Value function
3.1.2.7 PLC as a controller 54
55 56
4.1.0 System testing and results 4.2.1 Future development 4.3.1 Conclusion
x
LIST OF TABLES
1.1 Acid/alkaline values for some common liquids 6
1.2 PH values for common foodstuff 7
2.1 Hydrogen ion concentration in moles/liter at 25ºC 19
2.2 Types of liquids and their PH values for project experiment 27 2.3 Performance Specifications for Omron PLC 29
4.1 Liquids and PH values for experiment 59 4.2 Results for experiment 1 60
4.3 Results for experiment 2 62
4.4 Results for experiment 3 64
xvi
LIST OF FIGURES
1.1 PH value chart 5
1.2 An example PLC for industry 9
2.1 The IPC 20 14
2.2 Typical PH sensor 19
2.3 Example of PH electrode and reference electrode 20 2.4 An example of a PH amplifier 23
2.5 PH digital meter 24
2.6 PLC operation 28
2.7 Pump operating point curve 33
2.8 Effect of relative speed on pump curve 34
3.1 System block diagram 39 3.2 System Flowchart 40 3.3 Amplifier connected PLC and PH electrode 47
3.4 Connection between PH electrode and amplifier 49
3.5 Connection between PH electrode and analogue PLC terminal
49
3.6.1 Graph for range of 1 to 5V ( 4 to 20 mA) 51
3.6.2 Graph for range of 0 to 10V 52
3.6.3 Graph for range of -10 to +10V 53
3.7 Graph for digital conversion values are affected 55
3.8 Wiring diagram to be connected to PLC 57
4.1 Graph for experiment 1 61
4.2 Graph for experiment 2 63
4.3 Graph for experiment 3 65
xvii
LIST OF APPENDICES
1
CHAPTER I
INTRODUCTION
1.1 Project Background:
Watching our diet are important. To stay healthy, human need the right balance of carbohydrates, proteins and fats. Recently, however, people have also begun to consider the amount of acid in their food. The acid-alkaline balance diet is promoted as having different health benefits.
According to Dr. Ben Kim the central tenet of the acid-alkaline balance diet is that many people consume too much acid. This chronic overconsumption of acid-producing foods can cause chronically low blood PH. This theoretically can result in a number of health problems, including osteoporosis and poor kidney function, pro-moters of the acid-alkaline balance diet claim. Some claim that the right balance of acidic and alkaline foods and drink can help fight cancer [Dr.T.Baroody and Yao,2001].
2
the elimination of these acids through various orifices, such as your eyes, ears, mouth or nose."
Inside pure water, a decrease in pH value of about 0.45 occurs as the temperature is raised by 25 °C. In water with a buffering capacity imparted by bicarbonate, car-bonate, and hydroxyl ions, this temperature effect is modified .The PH values of most raw water lies within the range 6.5–8.5 [Yao and Robert Baldo,2001].
Also according to Acidic or alkaline - the importance of the PH value of food editted by Ingrid Kunze 25.02.2008 Health and Nutrition, human body consume both alkalis and acids with food. The proportion should be around 70-80% alkalis and 20-30% acids. Unfortunately this ratio has slipped to the opposite today. The or-ganism is particularly careful to maintain the PH level of blood so that it is a slightly alkaline environment of 7.365. Because of this considerable variation of the ac-id/alkali equilibrium the PH level in our bodies is influenced negatively, and as a re-sult a good breeding ground for many illnesses is provided. A permanently acidic PH value destroys body tissue, causes restlessness and sleep deprivation, headaches, a state of exhaustion, a weak immune system, fungal infections of the finger and toe-nails, raised blood pressure or high cholesterol, which the body forms around the blood vessels as a protective measure against damage.
com-3
position of the food and the way in which an individual digests them. Individual stress patterns, the ability to process life's ups and downs and emotional stability all influence the action of the digestive juices. A happy person in a satisfying job, who takes the time to chew their food well in a peaceful environment, will digest their food and experiences more easily than a stressed, overworked person who has to eat on the run. However a busy, well-organized person with strong digestive juices and a calm disposition may be able to digest better than the person who does everything right according to the health book but worries and frets over little things [Micheal and Adam Cloe, 2001].
Beside foods and drinking water, others products such as Soap based products; (bars, liquids and shower and bath gels) are often very drying and can cause irritation to the skin. Because soap based products are high in alkaline value they will alter the natural PH balance of your skin. Normal healthy skin is slightly acidic with a PH of 5.0 to 6.0 and this provides a protective acid mantle, which helps to protect the skin from environmental damage and dryness. Good quality Soap Substitutes or "non-soap" products will have a slightly acidic or lower PH value. As a result they are much gentler and less likely to cause irritation [Micheal and Adam Cloe, 2001].
4
defenseless against the onset of infection. The skin then needs about 2 hours to recu-perate from the negative chemical effects of soap. Sensitive skin needs as long as 26 hours to re-establish a normal PH of 5.5. [Micheal and Adam Cloe, 2001].
Marine lives, either in freshwater or sea creatures also need correct PH value of water, then this important to determine correct PH value in aquariums so that these marine creatures can live with healthy and safety, this also important for fish hatche-ries, water conditioning and aquaculture.
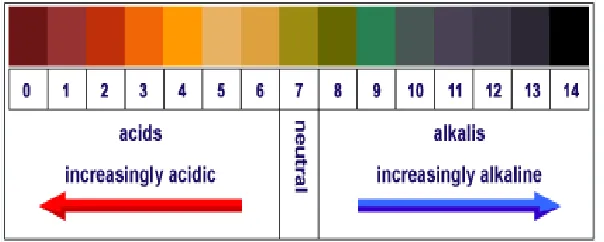
The pH of a solution indicates how acidic or basic (alkaline) it is. The PH term translates the values of the hydrogen ion concentration- which ordinarily ranges be-tween about 1 and 10 x -14gram-equivalents per liter - into numbers bebe-tween 0 and 14.On the PH scale a very acidic solution has a low PH value such as 0, 1, or 2 (which corresponds to a large concentration of hydrogen ions; 10 x 0, 10 x -1, or 10 x -2 gram-equivalents per liter) while a very basic solution has a high PH value, such as12, 13, or 14 which corresponds to a small number of hydrogen ions (10 x -12, 10 x -13, or 10 x -14 gram-equivalents per liter).A neutral solution such as water has a PH of approximately 7.
indi-5
[image:14.612.178.480.221.342.2]cator, there are blue and red litmus papers, they change colour when come into con-tact with acidic or alkaline substance (liquids), as shown on figure 1.1.
Figure 1.1 PH Chart
For ease of understanding we can view the PH scale as a range of 0 to 14.
1) a PH of 7 is neutral 2) a PH less than 7 is acidic
3) a PH greater than 7 is alkaline or basic.
6
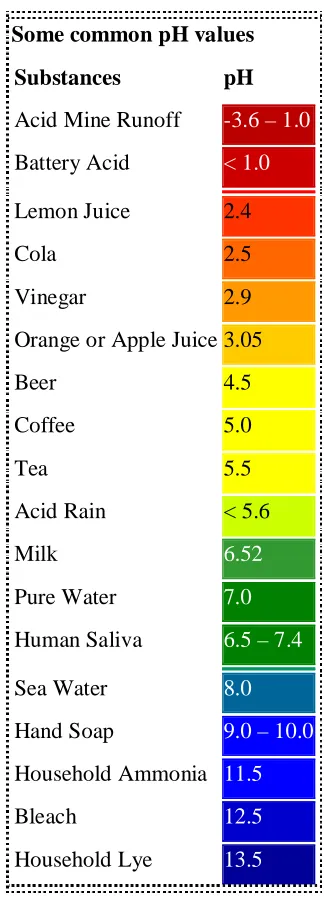
Table 1.1 Acid/Alkaline values of Some Common Liquids
Some common pH values
Substances pH
Acid Mine Runoff -3.6 – 1.0 Battery Acid < 1.0 Lemon Juice 2.4
Cola 2.5
Vinegar 2.9
Orange or Apple Juice 3.05
Beer 4.5
Coffee 5.0
Tea 5.5
Acid Rain < 5.6
Milk 6.52
Pure Water 7.0
Human Saliva 6.5 – 7.4
Sea Water 8.0
Hand Soap 9.0 – 10.0 Household Ammonia 11.5
Bleach 12.5
7
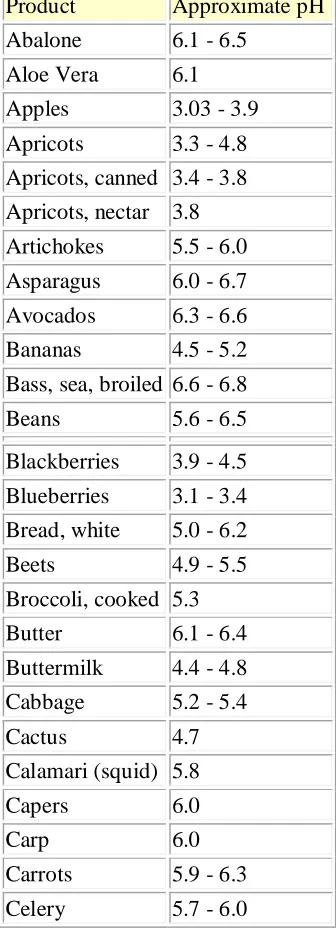
Table 1.2 PH values of some common food and foodstuff products can be found
Product Approximate pH Abalone 6.1 - 6.5
Aloe Vera 6.1 Apples 3.03 - 3.9 Apricots 3.3 - 4.8 Apricots, canned 3.4 - 3.8 Apricots, nectar 3.8 Artichokes 5.5 - 6.0 Asparagus 6.0 - 6.7 Avocados 6.3 - 6.6 Bananas 4.5 - 5.2 Bass, sea, broiled 6.6 - 6.8 Beans 5.6 - 6.5 Blackberries 3.9 - 4.5 Blueberries 3.1 - 3.4 Bread, white 5.0 - 6.2 Beets 4.9 - 5.5 Broccoli, cooked 5.3 Butter 6.1 - 6.4 Buttermilk 4.4 - 4.8 Cabbage 5.2 - 5.4
Cactus 4.7
Calamari (squid) 5.8
Capers 6.0
Carp 6.0
8
For this project PH sensor is used instead of litmus papers, which this pH sensor will determine either substance is more acidic or alkaline (for more detail please refer to pH sensor or electrode on pages 19, 20 and 21).The liquid mixing control system is the mechanism to control the composition of liquid to be mixed in the mixture process, used in the Process Industry, in sectors such as beverage,drinking water, food,pharmaceuticals,chemistry,refinery and etc. This system consist of six tanks, with one mixturer motor and five pumps are used and PLC is used to control the system.
Programmable Logic Controller (PLC) is used to control this Liquids Mixture Control system.The users are indipendently can select the volume of liquid from one of two separate tanks by selecting either one of two select buttons which locate on control panel, then the mixing process will be done, which the correct composition is determined by PH sensor of the mixture matching the PH value requirement as a product.After completing the mixing process ,this mixured liguids are transfered into the finishing tank as a complete product.
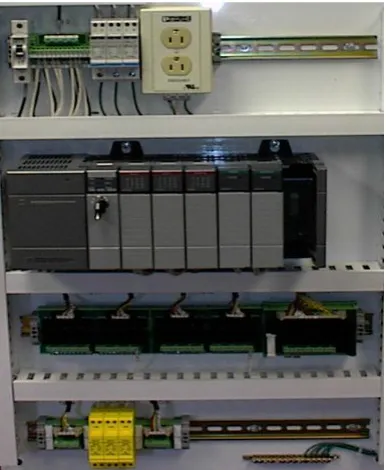
typi-9
cally highly customized systems so the cost of a packaged PLC is low compared to the cost of a specific custom-built controller design. On the other hand, in the case of mass-produced goods, customized control systems are economic due to the lower cost of the components, which can be optimally chosen instead of a "generic" solu-tion, and where the non-recurring engineering charges are spread over thousands or millions of units [Omron Industrial Automation, Malaysia, 2010].
[image:18.612.239.432.305.540.2]
Figure 1.2 an example of PLC uses for industry of automation
10 1.2 Problem Statements
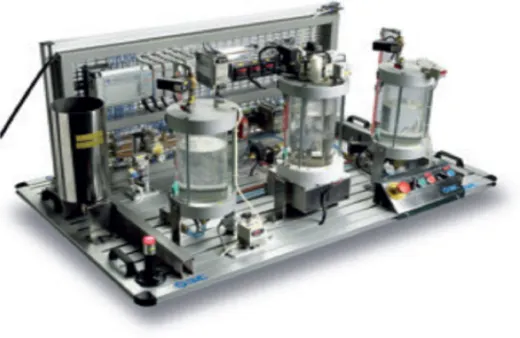
Liquid Mixture System model IPC 201 from SMC actuating by corresponding pneumatic solenoid valve, this method need air compressor to supply air ,this system also unable to determine correct pH value of the product. Moreover air compressor need high maitainance and compressor’s room need large space and clean room.
11 1.3 Project Objectives:
This project is to achieve new pH value of combination of two different liquids that have different pH values as a product and then maintain this pH value although the volume of one of two liquids is vary
The main objectives of this project are:
a) To acquire new pH value of mixture composition in mixture process tank as a product.
b) To maintain quality of the product to be produced.
c) To develop PLC as a controller to control Liquid Mixture system
e) To apply the Liquid Mixture Control system that can be used to obtain prod-uct in the main tank.
1.5 Project Scopes:
This project is primarily concerned to get new pH value of combination of two different liquids that have different pH values as a product and then maintain this pH value although the volume of one of two liquids is. The scopes of this project are:
a) Develop a system that can produce new product during mixing process of two liquids that have different pH values.
12
c) Employ PLC as a controller to control the system.
13 CHAPTER II
LITERATURE REVIEW
2.1 Technology Developments:
14
Figure 2.1 The IPC 20
But this method need air compressor to supply air ,this system also unable to determine correct PH value of the product. Moreover air compressor need high maitainance and compressor’s room need large space and clean room. Furhermore IPC 201 also need electrical supply to supply stirrer actuated by a motor , then for this project I would be used pump which only electrial supply is needed, instead of using two type of supply.In addition this sytem do not need large space to locate air compressor.
15 2.2 Theories
2.2.1 Why pH Values important:
One of the primary goals of WHO (World Health Organization) and its member states is that “all people, whatever their stage of development and their social and economic conditions, have the right to have access to an adequate supply of safe drinking water.” A major WHO function to achieve such goals is the responsibility “to propose regulations, and to make recommendations with respect to international health matters ....” The first WHO document dealing specifically with public drink-ing-water quality was published in 1958 as International Standards for Drinking-Water.
It was subsequently revised in 1963 and in 1971 under the same title. In 1984– 1985, the first edition of the WHO Guidelines for drinking-water quality (GDWQ) was published in three volumes: Volume 1, Recommendations; Volume 2, Health criteria and other supporting information; and Volume 3, Surveillance and control of community supplies. Second editions of these volumes were published in 1993, 1996 and 1997, respectively. Addenda to Volumes 1 and 2 of the second edition were pub-lished in 1998, addressing selected chemicals.
ben-16
efits. For example, the pH value of water is a measure of the acid–base equilibrium and, in most natural waters, is controlled by the carbon dioxide–bicarbonate– carbonate equilibrium system. An increased carbon dioxide concentration will there-fore lower pH, whereas a decrease will cause it to rise. Temperature will also affect the equilibrium and the pH value. In pure water, a decrease in pH value of about 0.45 occurs as the temperature is raised by 25 °C. In water with a buffering capacity im-parted by bicarbonate, carbonate, and hydroxyl ions, this temperature effect is mod-ified (1). The pH values of most raw water lies within the range 6.5–8.5 (1) [Byrne and Wensheng, 2001].
That why this project is done, which this system is to mix two different liquids with different pH values. Substances are classified as acidic, alkaline or neutral.The pH of a solution indicates how acidic or basic (alkaline) it is. The pH term trans-lates the values of the hydrogen ion concentration - which ordinarily ranges be-tween about 1 and 10 x -14gram-equivalents per liter - into numbers bebe-tween 0 and 14. On the pH scale a very acidic solution has a low pH value such as 0, 1, or 2 (which corresponds to a large concentration of hydrogen ions; 10 x 0, 10 x -1, or 10 x -2 gram-equivalents per liter) while a very basic (alkaline) solution has a high pH value, such as 12, 13, or 14 which corresponds to a small number of hydrogen ions (10 x -12, 10 x -13, or 10 x -14 gram-equivalents per liter).
al-17
though the volume of one of two liquids is vary. For more detail how this system can be applied please refer to chapter 3 – Methodology starting on page 39.
.
2.2.2 Theory of System operation:
18 2.2.2.1 pH Sensors and Principles of Operation
How They Work:
Understanding pH measurement in the process world, pH is an important pa-rameter to be measured and controlled. The pH of a solution indicates how acidic or basic (alkaline) it is. The pH term translates the values of the hydrogen ion concen-tration - which ordinarily ranges between about 1 and 10 x -14gram-equivalents per liter - into numbers between 0 and 14. On the pH scale a very acidic solution has a low pH value such as 0, 1, or 2 (which corresponds to a large concentration of hy-drogen ions; 10 x 0, 10 x -1, or 10 x -2 gram-equivalents per liter) while a very ba-sic (alkaline) solution has a high pH value, such as 12, 13, or 14 which corresponds to a small number of hydrogen ions (10 x -12, 10 x -13, or 10 x -14 gram-equivalents per liter).
19
Figure 2.2 typical pH sensors
PH is a measure of acidity or alkalinity. The amount of hydrogen ions (H+) causes a liquid to be acidic (high concentration of hydrogen ions) or al-kaline (low concentration of hydrogen ions). The pH range is measured from 0 to 14. Values below 0 or above 14 are possible but rare and cannot be measured with our electrodes. Table 2.1 shows hydrogen ion concentration in Moles /Liter at 25ºC.
Table 2.1 shows hydrogen ion concentration in Moles /Liter at 25ºC
pH H+ conc. OH - conc.
0 1.0 0.00000000000001
1 0.1 0.0000000000001
2 0.01 0.000000000001
3 0.001 0.00000000001
4 0.0001 0.0000000001
5 0.00001 0.000000001
6 0.000001 0.00000001
7 0.0000001 0.0000001
8 0.00000001 0.0000001
9 0.000000001 0.00001
10 0.0000000001 0.0001
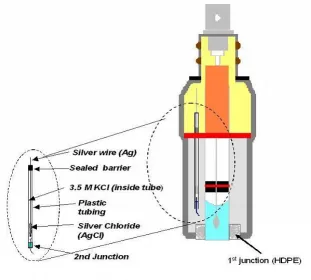
20 2.2.3 How does a reference electrode work?
Figure 2.4 shows an example of pH electrode and a reference electrode work as follow:
1) A porous reference junction separates the filling solution in the electrode from the solution whose pH is to be measured.
2) The filling solution's constant chloride ion concentration generates a milli voltage at a pure silver wire with silver chloride on it.
[image:29.612.176.487.412.692.2]3) The silver wire passes the signal from the solution being measured to the electrode's cable or connector.
21 2.2.5 The ideal pH electrode:
1) Zero volts output at neutral PH (=7.0) 2) Positive voltage in acids, PH<7 3) Negative voltages in bases, PH>7 4) Total realistic PH range is 0 to 14.
5) Generates -59.16 mill volts per PH unit at room temperature (="Nernst poten-tial"). Note that this is a negative slope--higher PH, lower voltage.
6) the full scale range is +/-0.414 volts. (+/-0.05916*7), at 25Cº.
7) Temperature coefficient of the Nerst potential is -0.001984 mV per °C. That makes the slope -54.2 mill volts per PH unit at 0 degrees Celsius, and -74.04 mill volts per PH unit at 100 degrees Celsius.
2.2.5.1 But the electrode is practically never ideal:
22
The kicker from the electronic standpoint is that the output impedance of the pH electrode is extremely high. The electrode acts like voltage source, however, there is a 10 to 50 mega ohm resistor in series with the voltage. Any voltmeter that measures the output of a PH electrode has to have extremely high input impedance, 1 tera ohm or more. Even many digital multi meters, which have 10 or 20 mega ohms of input resistance, will load down a PH electrode and give a reading that is much lower than it should be:
1) It is the glass membrane of the probe that is responsible for the high resistance. It a special glass with tiny "pores" that cannot support much electrical current.
23 2.2.5.2 The circuit of a pH amplifier:
Figure 2.4 shows amplifier circuit that be used for this project this amplifier pro-duces 1 volt output in neutral, PH=7, buffer. Adjust RT1 to set this offset. This ad-justment could also be used to set the output to 1.0 volts when the PH probe at the input is placed in neutral PH buffer. The resistor R6 sets the gain. With 221k½ in-stalled at R6, the overall gain will be x2, and the full scale output will be nominally 0.16 to 1.84 volts to cover the 0 to 14 PH range.
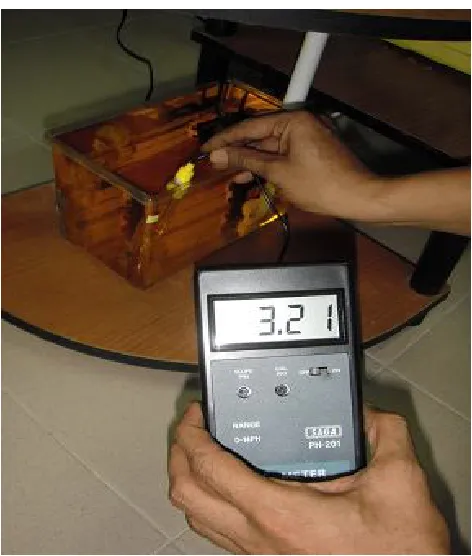
24 2.2.5.3 The Digital PH Meter
[image:33.612.224.460.213.491.2]PH meter is used to measure pH value of the liquids as showing on figure 2.5.
Figure 2.5 PH meter
This pH meter already calibrated by signal that simulated from the ideal pH elec-trode output (base on 25ºC environment). However due to:
1) Most electrodes are slightly off.
71 REFERENCES
Alkalize or Die by Dr.T.Baroody, Electric Press,205 Pigeon
Street,Waynesllive,N.C.
Spectrophotometric Determination of Freshwater pH Using Bromocresol Purple and Phenol Red. Author: Yao, Wensheng; Byrne, Robert H. Source: Environmental Science and Technology v. 35 no6 (Mar. 15, 2001) p. 1197-201
Spectrophotometric Determination of Seawater pH Using Phenol Red.
Author: Robert-Baldo, Gillian L.; Morris, Michael J.; Byrne, Robert H. Source: Analytical Chemistry v. 57 (Nov. 1985) p. 2564-77.
Acid & Alkaline Food Groups Author: Adam Cloe M.D./Ph.D the
University Of Chicago.
Commercial catalogue
Commercial catalogue
Perusahaan Majuco Sdn Bhd (2008), SMC- IPC 201 47-2 ,Petaling Jaya ,47810 Selangor,Malaysia
R. Bliesener, F.Ebel, C.Löffler, B. Plagemann,H.Regber,
E.v.Terzi, A. Winter ,Programmable Logic Controller © Copyright by Festo Didactic GmbH & Co., D-73770 Denkendorf 2002
Petruzella, F. D., Programmable Logic Controllers, McGraw Hill, 2005
Johnson, C. D., Process Control Instrumentation Technology, Prentice Hall, 2006
Saygin, C., Kahraman, F., “A Web-based programmable logic controller
laboratory for manufacturing engineering education”, The International
Journal of Advanced Manufacturing Technology, Vol. 24, No. 7-8, pp. 590-298.
David G.Alciatore & Micheal B. Histands, (Second Edition 2003) Introduction to Mechatronics , McGraw Hill
Edited by Igor J. Karassik Joseph P. Messina Paul Cooper Charles C. Heald Pump Handbook THIRD EDITION McGRAW-HILLNew York San Francisco Washington, D.C
http://www.emesystems.com/OWL2face.htm
http://www.sensorland.com/HowPage037.html
http://www.gliint.com/catalog/pdf/data/ds-pc.pdf
http://www.gfsignet.com/products/as2750.html