Performance of Ceria-electrolyte Solid Oxide Fuel Cell
Using Simulated Biogas Mixtures as Fuel
M.J. Escudero*, A. Fuerte
Centre for Energy, Environment and Technology (CIEMAT), Spain
Copyright©2017 by authors, all rights reserved. Authors agree that this article remains permanently open access under the terms of the Creative Commons Attribution License 4.0 International License
Abstract
In this study, a samarium cerium electrolyte-supported solid oxide fuel cell (SOFC) was assembled with Ce0.8Sm0.2O2−δ (SDC) electrolyte,La0.58Sr0.4Fe0.8Co0.2O3-δ (LSCF) as cathode and WNi-Ce as
anode. A porous layer of SDC between anode and electrolyte was used to improve adhesion of the anode ink. The cell performance was investigated with hydrogen and three simulated biogas mixtures (CH4/CO2/H2 70/25/5, 60/35/5
and 50/45/5) on the anode and static air on the cathode at 750ºC.In addition, the effect of H2S (10ppm) incorporation
in the biogas on the cell performance has been examined. The electrochemical behavior of the cell has been evaluated using IV curves, impedance spectroscopy and load demands. The results revealed that the best performance was obtained with the biogas composition richer in CH4 due to probably
the higher catalytic activity of WNi-Ce in this operation condition. Furthermore, the addition of H2S in biogas causes
an important decrease on the cell performance owing to the sulphuration reactions of anodic material. However, the stability tests under load demands revealed that the cell does not suffer degradation under any studied operation conditions (biogas composition and H2S in the fuel). This
suggests that WNi-Ce could be a suitable anode material for ceria-electrolyte SOFC direct feeding of biogas.
Keywords
SOFC, Anode, SDC, W and Ni, Biogas, Sulphur1. Introduction
Solid oxide fuel cell (SOFC) technology attracts much interest thanks to the flexibility that it offers to be fed, besides pure hydrogen, with other fuels. In this respect, biogas mainly consisting of CO2 and CH4 can be considered
an attractive renewable carbon source obtainable by fermentation of organic compounds (sewage sludges, liquid organic industrial effluents, farms residues, landfill, municipal and industrial solid organic residues) and its exploitation would be advantageous from both economic and
environmental point of view [1]. The biogas composition fluctuates significantly depending on the different way of production and the different waste sources, but also varies over time. Basically it consists of 50-70% CH4, 25-50% CO2,
1-5% H2 and 0.3-3% N2, with various impurities, notably,
NH3, H2S and halides [2,3].Theoretically, biogas can be used
to generate power high efficiently (60–90%) and cleanly by means of SOFCs. But, presently, the direct use of biogas as the fuel for SOFCs is still limited due to the H2S
contamination on the anode [4,5].
Unfortunately, the usual anode in SOFC, Nickel-Yttria-Stabilized Zirconia (Ni-YSZ) cermet displays excellent catalytic properties for fuel oxidation and good current collector but exhibits disadvantages, such as a low tolerance to sulphur, chlorine and phosphorous compounds [6,7] and carbon deposition due to deactivation of catalytic activity of Ni when using carbon-containing fuels including biogas [8]. Therefore, doping nickel catalysts with small amounts of the other materials is a popular and effective approach taken to alleviate carbon deposition and sulphur poisoning [9,10]. In this context, CeO2 is widely used in
sulphur removal processes and adds coking resistance in catalytic processes [11]. On the other hand, WS2 has been
studied as anode material in H2S oxidation fuel cells to
improve performance [12,13] and the results revealed that it was stable and active during the testing time of 36 h. Then, an interesting alternative to favor the direct utilization of biogas as fuel in SOFCs could be a bimetallic formulation of nickel and tungsten combined with CeO2 (WNi-Ce) as anode
material. In previous papers, we have reported that this compound (WNi-Ce) exhibits a high sulphur tolerance and could be operated at sulphur levels up to 500ppm without degradation in the cell performance [14], as well as a low performance in biogas with 10ppm H2S at 850°C using
(GDC), both due their high ionic conductivity compared to YSZ. Moreover, electronically and catalytically active characteristics of doped ceria under high-temperature reducing atmosphere improve the anode reaction kinetics when inserted between the anode and the electrolyte, and as results the electrochemical performance of SOFCs further improves. For the other one, it is known that the structural stability of ceria under reducing atmosphere is poor due to the structural change of ceria from CeO2 to Ce2O3, which has
often prevented the doped ceria from being widely utilized for SOFCs [17].
In this work, a samarium cerium electrolyte-supported solid oxide fuel cell (SOFC) was assembled with a 400 µm Ce0.8Sm0.2O2−δ (SDC) electrolyte, La0.58Sr0.4Fe0.8Co0.2O3-δ
(LSCF) as cathode and WNi-Ce as anode. A porous layer of SDC between anode and electrolyte was used to improve adhesion of the anode ink. The cell performance was investigated with hydrogen and three simulated biogas mixtures (CH4/CO2/H2 70/25/5, 60/35/5 and 50/45/5) on the
anode and static air on the cathode at 750ºC.In addition, the effect of H2S (10ppm) incorporation in the biogas on the cell
performance has been examined. The electrochemical behavior of the cell has been evaluated using IV curves, impedance spectroscopy and load demands. In addition, the chemical compatibility between WNi-Ce and SDC was also analyzed by XRD.
2. Experimental
2.1. Synthesis and Chemical Compatibility of Anode Material
W and Ni combined with CeO2 (WNi-Ce) with a total
loading of 30 at. % (2/1 atomic ratio for Ni/W system) was prepared by coprecipitation within reverse microemulsion using cerium (III) nitrate hexahydrate (Fluka, purity >98%), nickel (II) nitrate hexahydrate (Panreac, purity >99%) and ammonium metatungstate hydrate (Fluka, purity >99%) as precursors. For this purpose, two reverse microemulsions with similar characteristics concerning the volumes employed of organic (n-heptane from Panreac), aqueous phases of surfactant (Triton X-100 from Sigma Aldrich) and co-surfactant of (1-hexanol from Sigma Aldrich), were prepared. The first one contained in its aqueous phase the dissolved salts of Ce, Ni and W, while the second one contained in its aqueous phase a dissolved base (tetramethyl ammonium hydroxide or TMAH from Sigma Aldrich) which is employed as precipitating agent. Mixing both microemulsions produces the precipitation of the cations; after separation of the precipitated solid by centrifugation and decanting, the resulting solid was rinsed with methanol and dry for 24h at 150°C. Then, the resulting material was calcined under air at 800 °C during 2h, employing a heating ramp of 1 ºC·min-1 [15]. Reduced sample was obtained by further reduction at 750°C under flowing 10%H2/N2 for
50h.
The sample was characterized by X-ray diffraction (XRD) for phase identification and to assess phase purity. XRD analysis was performed with a Philips “X Pert-MPD” diffractometer using Cu Kα radiation (λ = 1.5406 Å). The diffraction patterns were recorded in the 2θ range 20–80 with steps of 0.04°. In order to verify the chemical compatibility between WNi-Ce anode and SDC, an equal amount of anode material and electrolyte were thoroughly ground in an agate mortar and put into a quartz reactor. The mixture was fired in hydrogen for 50h at 750°C. Then, the product was examined by XRD.
2.2. Fuel Cell Testing
A single cell (0.28cm2 active area) was prepared with WNi-Ce as anode, La0.58Sr0.4Fe0.8Co0.2O3-δ (LSFC, Praxair)
as cathode and Ce0.8Sm0.2O2−δ (SDC, Praxair) as electrolyte.
A thin porous buffer layer of SDC was deposited between the electrolyte and anode, in order to improve the adhesion of anode ink on the electrolyte. Fabrication of the cell used in this study was described in the previous manuscript [15]. Humidified hydrogen or three different simulated biogas mixtures (CH4/CO2/H2 B50=50/45/5, B60=60/35/5 and
B70=70/25/5) were supplied to the anode as fuel using max-flow controls at 750°C. In order to evaluate the presence of H2S in the biogas on the cell performance,
10ppm H2S was added to the three biogas compositions,
without passing through water bubbler because H2S rusts the
stainless steel bubbler. The total fuel flow rate was 50ml·min-1, after passing through a saturator at room temperature to adjust the gas humidity at 3% H2O. Cathode
was open to air.
Electrochemical measurements were conducted using AUTOLAB system (PGSTAT30 and FRA2 module) from Eco Chemie (The Netherlands). The current voltage (I-V) characteristic of the cell was measured using linear sweep voltammetry at a scan rate of 10mV/s. The impedance of the cell was recorded at open circuit in galvanostatic mode in a frequency range from 1 MHz to 10 MHz and excitation signal of 5 mA.
2.3. Post-test Analysis
After testing, the microstructure of the single cell and possible chemical reaction between electrode/electrolyte were investigated by scanning electron microscopy (SEM)/energy-dispersive X-ray analysis (EDX) and mapping techniques with a Hitachi-S-2500 microscope
3. Results & Discussion
3.1. Anode Material Characterization
coprecipitation within inverse microemulsion, has been previously reported [14, 15]. After calcination in air this material is mainly constitutes by the fluorite phase of CeO2
together with a second one of NiWO4. After its reduction, the
compound kept the reflections assigned to fluorite structure but no signs of NiWO4 were detected, and new peaks
appeared ascribed to Ce2W2O9 and Ni0. WNi-Ce presents a
good thermal compatibility with SDC electrolyte based on the thermal expansion coefficient (TEC) value. As important as a good electrode electrolyte thermal compatibility in order to avoid mechanical problems, the chemical compatibility between electrode materials and electrolyte is a prerequisite to any further cell testing. Indeed, the formation of reaction products at the electrode/electrolyte interface could be detrimental to the cell efficiency. In this sense, a reactivity study was carried out to assess the interaction between the anode material and electrolyte SDC.
XRD pattern of the electrode/electrolyte mixture (WNi-Ce+SDC) after lengthy reducing treatment in 10%H2/N2 during 50h at 750°C is presented for its
comparison in Figure 1, together with patterns of both fresh and reduced WNi-Ce, and SDC electrolyte. Results clearly allow to dismiss any chemical reaction between electrode and electrolyte materials, no new phases or changes are observed, only diffraction peaks for fluorite phase that corresponds to SDC and CeO2, and Ni
0
. It is worthy to mention that Ce2W2O9 could be presented due to its main
peak positions overlaps with the fluorite one
Figure 1. XRD patterns for WNi-Ce in air and after its reduction, SDC and chemical compatibility test between electrode and electrolyte (WNi-Ce+SDC)
3.2. Fuel Cell Testing
The WNi-Ce compound was further investigated as the anode material in a SDC cell fed by three simulated biogas mixtures (CH4/CO2/H2 B50=50/45/5, B60=60/35/5 and
B70=70/25/5) with and without added 10ppm H2S at 750°C.
Three different CH4/CO2 molar feed ratios were used
because one of the principal limitations of biogas is its variability of quality.
As previously mentioned, the sulphur impurities which are present primarily as hydrogen sulphide (H2S) exist in biogas.
Figure 2 shows typical voltage current and power current curves in the three simulated biogas compositions with and without added 10ppm H2S at 750°C. The electrochemical
[image:3.595.313.551.210.587.2]characteristics for all tests performed are summarized in Table 1.
(a)
(b)
Figure 2. IV curves for the WNi-Ce/SDCp/SDC/LSCF cell under three simulated biogas mixtures (CH4/CO2/H2 B50= 50/45/5, B60= 60/35/5 and
[image:3.595.64.292.425.623.2]B70=70/25/5) at 750 °C; (a) without H2S; (b) with 10 ppm H2S
Table 1. Summary of the cell performance data operating on three simulated biogas mixtures (CH4/CO2/H2 B50=50/45/5, B60=60/35/5 and
B70=70/25/5) with and without 10ppm H2S at 750°C
Gas composition
Pmax (mW·cm-2)
Rt (Ω·cm2 ) RΩ (Ω·cm2 ) Rp (Ω·cm2 ) B50 B60 B70 48 48 50 2.27 2.28 2.28 1.07 1.07 1.07 1.20 1.21 1.21 B50/10 ppm B60/10 ppm B70/10 ppm 29 34 37 3.05 2.88 2.74 1.25 1.24 1.23 1.80 1.64 1.51
20 30 40 50 60 70 80
+ + # # X X X X X X X X X
WNi-Ce + SDC in 10 %H2/N2
SDC in 10 %H2/N2
WNi-Ce in 10 %H2/N2
+ * # # * * *
x Fluorite # NiWO
4*Ce
2W
2O
9+Ni
0# # # ##
#
2θ(°)
In tens ity ( a. u. )
WNi-Ce in air X X X X X X X X X X X X X
X X X
X X
X
X X
X X
0 20 40 60 80 100 120 140 160 180 200 0 100 200 300 400 500 600 700 800 B50 B60 B70 V ol tag e ( m V )
Current density (mA/cm2)
0 5 10 15 20 25 30 35 40 45 50 55 P ow er dens ity ( m W /c m 2 )
0 20 40 60 80 100 120 140 160
0 100 200 300 400 500 600 700 800
B50 + 10 ppm H2S B60 + 10 ppm H2S B70 + 10 ppm H2S
V ol tage ( m V )
The OCVs of the cell was 0.762, 0.766 and 0.769 V for 50, 60 and 70 vol% methane concentration, respectively, and decreased at 0.727, 0.740 and 0.747 V when 10ppm H2S was
incorporated in the biogas mixtures. In this study, the OCV for simulated biogas fuel increases with increasing the CH4
content in biogas. This tendency is similar with the calculated OCV based on the thermodynamic equilibrium in CH4 [18]. The low voltages values are due to the SDC
electrolyte presents mixed electronic-ionic conductivity at very low pO2, being the electronic conductivity the cause of
low OCVs. In addition, the OCV interpretation becomes much more complex when biogas is directly fed to the cell; multiple reactions can take place at the anode.
The high operating temperature and catalytic activity of anode material make possible the dry-reforming of methane (Eq. 1) and the steam reforming (Eq. 2) under tested conditions [19,5]:
CH4 + CO2 ↔ 2CO + 2H2; ∆H0298= 247 KJ·mol-1 (1)
CH4 + H2O ↔ CO + 3H2; ∆H0298= 206 KJ·mol-1 (2)
CO and H2 produced through both reforming processes
can be further electrochemically oxidized to produce electricity. An increase in the current density within the SOFC corresponds to an increased in oxygen ion transport across the electrolyte from the cathode to the anode. This allows several key electrochemical oxidation reactions to take place at the anode under load as below (Eq: 3-6):
H2 + O2-↔ H2O + 2e-; ∆H0298= -242 KJ·mol-1 (3)
CO + O2- ↔ CO2 + 2e-; ∆H0298= -283 KJ·mol-1 (4)
CH4+ O2- ↔ CO+2H2 +2e-; ∆H0298= -37 KJ·mol-1 (5)
CH4 + 4O
2- ↔ CO
2 + 2H2O +8e -; ∆H0
298= 802 KJ·mol -1
(6) Additionally, there are several side reactions that could result in carbon deposition on the anode, such as CH4
cracking (Eq. 7) and Boudouard reaction (Eq. 8)
CH4 ↔ C+ 2H2; ∆H0298= 75 KJ·mol-1 (7)
CO ↔ C+ CO2, ∆H0298= -173 KJ·mol-1 (8)
The primary reactions will be mainly defined by the gas composition and the catalytic activity of anode material. Moon et al. [20] suggested that the electrochemical oxidation reaction of CO and H2 are faster than the reforming reaction.
On the other hand, it can be seen that the maximum current density (cell voltage =0) and the maximum power density (MPD) slightly decrease with decreasing the CH4 content in
the biogas without sulphur.
However, it can see that the incorporation of 10 ppm H2S
in the biogas fuel caused a significantly reduction in the MPD around 39, 29 and 26% for B50, B60 and B70, respectively. To properly determine the influence of the biogas mixtures on the cell performance, impedance spectroscopy measurements were recorded after each IV curve. Figure 3 displays the Nyquist plots measured at the three simulated biogas mixtures with and without 10ppm H2S at 750°C.
(a)
[image:4.595.316.546.85.375.2](b)
Figure 3. Impedance spectra for the WNi-Ce/SDCp/SDC/LSCF cell under three simulated biogas mixtures (CH4/CO2/H2 B50= 50/45/5, B60= 60/35/5
and B70=70/25/5) at 750°C; (a) without H2S; (b) with 10ppm H2S In these spectra, the intercepts with the real axis at low frequencies represent the total cell resistance (Rt) and the
value of the intercept at high frequency is the ohmic resistance(RΩ) which includes ionic resistance of electrolyte,
electronic resistance of the electrode and some contact resistances associated with interfaces. The width of the impedance arc on the real-axis is the polarisation resistance (Rp) that corresponds to the sum of the resistance of the two
interfaces: the cathode-electrolyte and the anode-electrolyte interfaces. The resistance values obtained for the single cell evaluation at the three biogas mixtures in all tests were also collected in Table 1. In all tests, the ohmic resistance remains constant with the CH4 content in biogas; only the
polarization resistance (Rp) increases with decreasing the
CH4/CO2 ratio in presence of sulphur, which indicates that, a
priori, the resistances are not affected by the biogas composition. The presence of 10 ppm H2S in the biogas fuel
produced an increase of the RΩ value of 16%, while the Rp
values increase around 50, 35 and 24% for B50, B60 and B70, respectively. The cell performance drop caused by the incorporation of H2S in the fuel gas could be due as a result
of surface adsorption of sulphur on the exposed metal catalysts (M=Ni, W) and/or formation of bulk metal sulphides. In addition, under reducing operation conditions, CeO2 could be reduced to CeO2-x, which is highly reactive
with H2S to become cerium oxysulphide. These reactions are
presented in the following equations (9-12) [11,21]:
H2S(g) + M(s) ↔ M-S(s) + H2(g) (9)
1.0 1.2 1.4 1.6 1.8 2.0 2.2 2.4
0.0 0.2 0.4 0.6 0.8 1.0 1.2
B50 B60 B70
-Z"
(
Ω
cm
2 )
Z' (Ω cm2)
1.0 1.2 1.4 1.6 1.8 2.0 2.2 2.4 2.6 2.8 3.0 3.2 3.4 3.6 0.0
0.2 0.4 0.6 0.8 1.0
1.2 B50 + 10 ppm H2S
B60 + 10 ppm H2S
B70 + 10 ppm H2S
-Z"
(
Ω
cm
2 )
xM(s) + yH2S(g) ↔ MxSy (s) + yH2(g) (10)
CeO2(s) + xH2(g) ↔ CeO2-x(s) + xH2O(g) (11)
2CeO2-x(s) + H2S(g) + (1-2x)H2(g) ↔ Ce2O2S(s) +
2(1-x)H2O (g) (12)
Additionally, in presence of biogas, the methane could react with H2S as follows [22]
CH4 + 2H2S↔ CS2 + 4H2(g) (13)
CS2 is an electrochemically active specie that could be
oxidized in numerous ways, then it is extremely difficult to determinate its influence on the cell voltage.
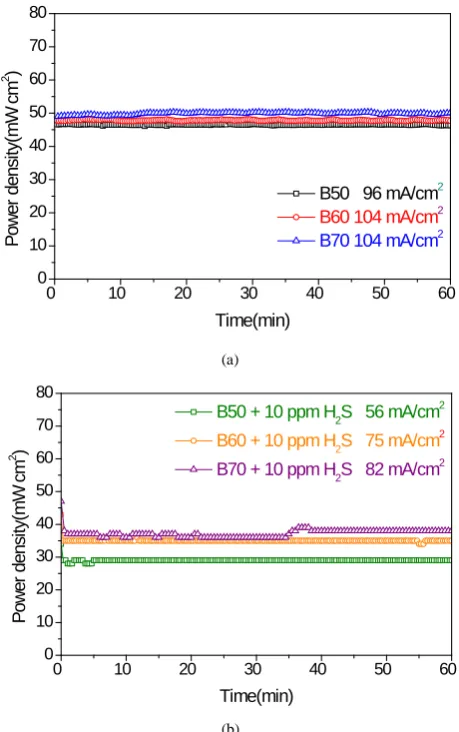
To determine the cell stability is crucial for practical applications, the cell was tested under a constant current density for 1h under the three simulated biogas mixtures with and without 10 ppm H2S at 750 °C (Figure.4). The current
density demand varied in each test and corresponded to the intensity required to achieve 90% of the maximum power. Each value was obtained of IV curves measurements in identical experimental conditions before the stability test (Figure 2).
In absence of sulphur, the cell reached power density around 46-50 mW·cm2 with the three biogas mixtures. When the cell operates under load demand, an increase of oxygen ion transport across the electrolyte from the cathode to the anode occurs. Then, several electrochemical oxidation reactions take place at the anode under load, such as the oxidation of CH4, CO and H2, reactions (Eq. 5), (Eq. 6), (Eq.
4) and (Eq. 3) above mentioned, as well as the following electro-oxidation reactions to prevent carbon deposition on the anode [19,23].
C(s) + O2- ↔ CO + 2e-; ∆H0298= -111 KJ·mol-1 (14)
C(s) + 2O2- ↔ CO2 + 4e-; ∆H0298= -394 KJ·mol-1 (15)
When 10 ppm H2S was added to biogas mixtures, the cell
achieved power densities of 29, 34 and 37 mW·cm-2 for B50, B60 and B70, respectively, indicating an enhancement of the cell performance with the higher methane content in biogas. Although, these values are lower (around 90%) than those obtained without H2S, they kept stable in recorded time for
all tests. This good stability could be produced by the effect of load demand. At high current density, the adsorbed sulphur on surface of nickel and Ce2O2S could be removed
under load current conditions by reacting with oxygen ions to form SO2 as follow [24,25].
Ni-S(s) + 2O2- ↔ Ni(s) + SO2(g) + 4e- (16)
Ce2O2S(s) + 4O
2-↔2CeO
2-δ(s) + (1-δ)SO2(g) + 8e
(17) In addition, as mentioned before, the supply of ions through the electrolyte might facilitate the oxidation of CH4,
CO and H2, and the electrochemical reactions to avoid the
carbon deposition on the anode surface. Similar IV curves and Nyquist diagrams were measured after all endurance tests, which indicate no degradation of the cell.
The results published in scientific literature tend to vary with each other due to different cell structures, anode features and testing conditions being difficult to compare our
results with them. However, the power density achieved (~50mW·cm-2) was comparable with that of 60 mW·cm-2 reported by Yentekatis et al. [26]. They operated a tubular single cell based on gadolinium doped ceria (GDC), Ni(Au)-GDC cermet anode and La0.54Sr0.46MnO3 (LSM)
cathode under equimolar CH4/CO2 feed ratio at similar
temperature. With regards to the effect of sulphur presence in biogas, Laycock et al. [27] investigated the effect of temperature on coking and sulphur poisoning to Ni-YSZ (90:10 mol%) anode under biogas dry reforming conditions. They reported that 5 ppm H2S caused the anode deactivated
completely at 750 ºC within 4 h. Increasing temperature accelerated the deactivation [28]. Papurello et al. established the link between the sulphur time-to coverage and the performance drop using biogas and biogas reformate fuels, in which sulphur saturation on Ni surface was achieved within 2 h when the concentration of H2S was above 2ppm [29].
H2S concentrations higher than 2ppm showed an irreversible
effect on cell performance. They also demonstrated, to reach a given loss in cell performance, a SOFC stack required lower sulphur coverage as compared with a single cell [28]. In our case, the cell performance was kept stable under biogas with 10ppm H2S.
(a)
[image:5.595.316.546.355.721.2](b)
Figure 4. Power density of the cell under load demand in three simulated biogas mixtures (CH4/CO2/H2 B50= 50/45/5, B60= 60/35/5 and
B70=70/25/5) at 750°C; (a) without H2S; (b) with 10ppm H2S
0 10 20 30 40 50 60
0 10 20 30 40 50 60 70 80
B50 96 mA/cm2
B60 104 mA/cm2 B70 104 mA/cm2
P
ow
er
dens
ity
(m
W
cm
2 )
Time(min)
0 10 20 30 40 50 60
0 10 20 30 40 50 60 70 80
B50 + 10 ppm H2S 56 mA/cm2
B60 + 10 ppm H2S 75 mA/cm2
B70 + 10 ppm H2S 82 mA/cm2
P
ow
er
dens
ity
(m
W
cm
2 )
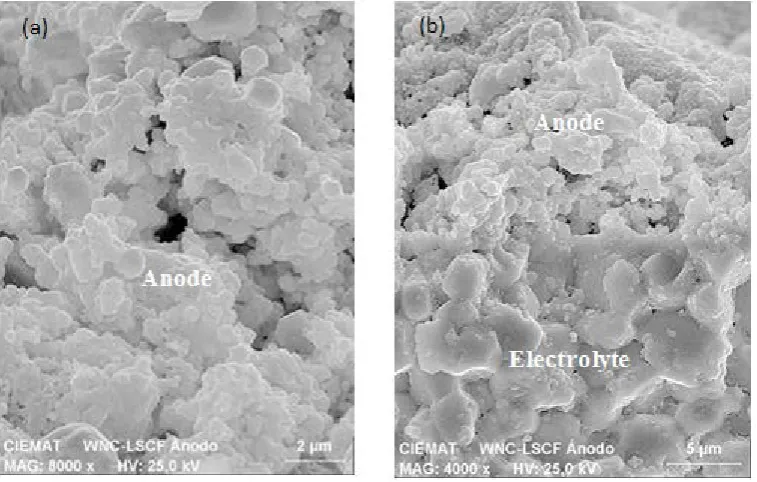
Figure 5. SEM images and EDX mapping of the anode/electrolyte region after cell testing on biogas with 10ppm H2S; (a) anode surface; (b)
cross-sectional of anode/electrolyte.
3.3. Microstructural Analysis of Electrode/Electrolyte Interface after Biogas with H2S Testing
Figure 5 illustrates the SEM micrographs of anode surface and the cross-sectional of the anode/electrolyte interface after the cell evaluation using biogas containing 10ppm of H2S as fuel. As shown in Figure 5a, the anode exhibits a
granular and porous microstructure with an inhomogeneous particle size distribution that forms agglomerates with an average grain size around 1-3 µm. The anode layer is well-adhered to the SDC electrolyte (Figure 5b). The EDX mapping of W, Ni, Ce, Sm and S elements (data not shown) revealed neither the presence of Ni, and W on the electrolyte). It is worthy to mention that sulphur was not detected on the anode/electrolyte interface. This could be due to the sulphur was removed from the nickel and cerium according the equations 16 and 17.
4. Conclusions
SDC electrolyte supported single cell with WNi-Ce has been tested using three simulated biogas mixtures (CH4/CO2/H2 70/25/5, 60/35/5 and 50/45/5) with and without
10 ppm H2S at 750 °C. The composition of biogas only
affects on the cell behavior in the SH2 presence. The
electrochemical characterization revealed an important reduction on the cell performance when the sulphur is incorporated on the biogas. This reduction is mainly caused by the increase of polarization resistance even a slight increase was also observed in the ohmic resistance. In presence of sulphur, the cell operation improves with the increase of methane content of biogas. However, when a
constant current was demanded to the cell, a stable performance was observed in all cases studied (biogas with or without H2S). These results suggest that a higher flux of
O2- from the electrolyte favoring the electrochemical oxidation reactions of CH4, CO and H2 and causing oxidative
desorption of S(ads) on Ni and/or CeO2 to SO2. In addition,
the formation of WS2 could be beneficial to the cell
performance. Therefore, this configuration could be an appropriate and potentially interesting anode material for direct-biogas SOFC.
Acknowledgements
This work was supported by Spanish Ministry of Economic and Competitiveness (MAT2013-45043
).
REFERENCES
[1] G. Bonura, C. Cannilla. F. Frusteri, Ceria–gadolinia supported NiCu catalyst: A suitable system for dry reforming of biogas to feed a solid oxide fuel cell (SOFC). Applied Catalysis B: Environmental, Vol. 121-122, 135-147, 2012.
[2] J. Huang, R. J. Crookes, Assessment of simulated biogas as a fuel for the spark ignition engine. Fuel, Vol. 77, 1793-180, 1998.
Bioresource Technology, Vol. 126, 254-265 2012.
[4] F.Y. Wang, G.B. Zhong, S. Luo, L. Xia, L.H. Fang, X. Song, X. Hao, G. Yan, Porous Sr2MgMo1−xVxO6-δ ceramics as anode materials for SOFCs using biogas fuel, Catalysis Communications, Vol. 67, 108-111, 2015.
[5] A. Fuerte, R.X. Valenzuela, M.J. Escudero, L. Daza, Study of a SOFC with a bimetallic Cu–Co–ceria anode directly fuelled with simulated biogas mixtures, International Journal of Hydrogen, Vol. 39, 4060-4066, 2014.
[6] F.N. Cayan, M. Zhi, S.R. Pakalapati, I. Celik, N. Wu, R. Gemmen Effects of coal syngas impurities on anodes of solid oxide fuel cells, Journal Power Sources, Vol. 185, 595-602, 2008.
[7] S. Li, H. Miao, T. Chen, W.G. Wang, C. Xuz, Effect of simulated coal-derived gas composition on H2S poisoning behavior evaluated using a disaggregation scheme, Journal of the Electrochemical Society, Vol. 156, No. 12, B1383-B1388, 2009.
[8] T. Chen, W. G. Wang, H. Miao, T. Li, C. Xu, Evaluation of carbon deposition behavior on the nickel/yttrium-stabilized zirconia anode-supported fuel cell fueled with simulated syngas, Journal Power Sources, Vol. 196, 2461-2468, 2011.
[9] C. J. Laycock, J.Z. Staniforth, R.M. Ormerod, Biogas as a fuel for solid oxide fuel cells and synthesis gas production: effects of ceria-doping and hydrogen sulfide on the performance of nickel-based anode materials, Dalton Transactions, Vol. 40, 5494-5504, 2011.
[10]O. A. Marina, C. A. Coyle, M. H. Engelhard, L. R. Pederson, Mitigation of sulfur poisoning of Ni/Zirconia SOFC anodes by antimony and tin, Journal of the Electrochemical Society, Vol. 158, No. 4, B424-B429, 2011.
[11]J M. Gonga, X. Liu, J. Trembly, C. Johnson, Sulfur-tolerant anode materials for solid oxide fuel cell application, Journal Power Sources, Vol. 168, 289-298, 2007.
[12]N. U. Pujare, K. J. Tsai, A. F. Sammells, An electrochemical Claus process for sulfur recovery, Journal of the Electrochemical Society, Vol. 136, No.12, 3662-3678, 1989.
[13]C. Yates, J. Winnick, Anode materials for a hydrogen sulfide solid oxide fuel cell, Journal of the Electrochemical Society, Vol. 146, No. 8, 2841-2844, 1999.
[14]M.J. Escudero, A. Fuerte, Electrochemical analysis of a system based on W and Ni combined with CeO2 as potential sulphur-tolerant SOFC anode, Fuel Cells, Vol. 16, No. 3, 340-348, 2016.
[15]M.J. Escudero, I. Gómez de Parada, A. Fuerte, Performance evaluation of WNi-CeO2 as anode in a solid oxide fuel cell fed by simulated biogas mixtures, International Journal of Hydrogen, Vol. 40, 11303-11314, 2015.
[16]D. J. L. Brett, A. Atkinson, N.P. Bradon, S.J. Skinner, Intermediate temperature solid oxide fuel cells, Chemical Society Reviews, Vol. 27, 1568-1578, 2008.
[17] S. Ji, Y.H. Lee, T. Park, G. Y. Cho, S. Noh, Y. Lee, M.Kim, S. Ha, J. An, S.W.Cha, Doped ceria anode interlayer for low-temperature solid oxide fuel cells with nanothin electrolyte, Thin Solid Films, Vol. 591, 250-254, 2015.
[18] S.P. Jiang, X. J. Chen, S. H. Chan, J. T. Kwok, K.A. Khor, (La0.75Sr0.25)(Cr0.5Mn0.5)O3/YSZ composite anodes for methane oxidation reaction in solid oxide fuel cells, Solid State Ionics, Vol. 177, 149-157, 2006.
[19] J. Mermelsteina, M. Millana, N.P. Brandon, The interaction of biomass gasification syngas components with tar in a solid oxide fuel cell and operational conditions to mitigate carbon deposition on nickel-gadolinium doped ceria anodes, Journal Power Sources, Vol. 196, 5027-5034, 2011.
[20] D.J. Moon, J. W. Ryu, Electrocatalytic reforming of carbon dioxide by methane in SOFC system, Catalysis Today, Vol. 87, 255-264, 2003.
[21] A. Cheng, S. Zha, M. Liu, Stability of materials as candidates for sulphur resistant anodes of solid oxide fuel cells, Journal of the Electrochemical Society, Vol. 153, No. 7, A1302- A1309, 2006.
[22] C. M. Grgicak, R. G. Green, J. B. Giorg, SOFC anodes for direct oxidation of hydrogen and methane fuels containing H2S, Journal Power Sources Vol. 179, 317-328, 2008.
[23] G. Goula, V. Kiousis, L. Nalbandian, I.V. Yentekakis, Operation of anode-supported solid oxide fuel cells on methane and natural gas, Solid State Ionics, Vol. 158, 11-16, 2003.
[24] S. Zha, Z. Cheng, M. Lium Sulfur poisoning and regeneration of Ni-based anodes in solid oxide fuel cells, Journal of the Electrochemical Society, Vol. 154, No. 2, B201-B206, 2007.
[25] J. W. Yun, S. P. Yoon, S. Park, H.S. Kim, S.W. Nam, Analysis of the regenerative H2S poisoning mechanism in Ce0.8Sm0.2O2-coated Ni/YSZ anodes for intermediate temperature solid oxide fuel cell, International Journal of Hydrogen, Vol. 36, 787-796, 2011.
[26] I. V. Yentekakis, Open- and closed-circuit study of an intermediate temperature SOFC directly fueled with simulated biogas mixtures, Journal Power Sources, Vol. 160, 422-425, 2006.
[27] C.J. Laycock, J.Z. Staniforth, R. M. Ormerod, Biogas as a fuel for solid oxide fuel cells and synthesis gas production: effects of ceria-doping and hydrogen sulfide on the performance of nickel-based anode materials. Dalton Transactions, Vol. 40, 5494-5504, 2011.
[28] H. Chen, F. Wang, W. Wang, D. Chen, S.D. Li, Z. Shao, H2S poisoning effect and ways to improve sulfur tolerance of nickel cermet anodes operating on carbonaceous fuels cells, Applied Energy, Vol. 179, 765-777, 2016.