Optimization of Process parameter in Resistance spot welding for
unequal thickness sheet using the Grey Relational Analysis
Prasad S. Salke
1, Kailash C. Bhosale
21
PG Scholar, Department of Mechanical Engineering(Design), S.R.E.S.C.O.E, Kopargaon
(e-mail: [email protected])
2
Assistance Professor Department of Mechanical Engineering, S.R.E.S.C.O.E, Kopargaon
(e-mail: [email protected])
---***---Abstract -
The optimization of process parametersconsidering multiple performance characteristics to minimize power consumption in Resistance spot welding (RSW) process for unequal thickness GI sheet using the Grey relational analysis (GRA) and genetic algorithm (GA) is presented. Performance characteristics including Tensile strength and Nugget Diameter are chosen to evaluate the weld quality. This all the Performance characteristics are closely correlated with the selected input process parameter such as Current, Weld time, Electrode force, Thickness, hold time, squeeze time, and electrode tip diameter. Experiments based on the appropriate L27 OA are conducted first. The coefficient and grades according to GRA are evaluated using normalized experimental results of the performance characteristics. The Analyses Of Variance (ANOVA) are conducted to identify the most significant factor affecting the spot welding performance.
Key Words: Resistance Spot Welding (RSW),
Optimization, Grey relational analysis (GRA), Genetic Algorithm (GA), Analysis of Variance (ANOVA).
1.INTRODUCTION
In the car body, Body-in-White (BIW) is pointed out as one of the most significant parts of a vehicle, it impacts on performance such that speed, fuel consumption, safety and handling. A typical BIW described in consist of approximately 300 sheet metal parts that is joined by around 4000-6000 weld spots. BIWs are usually pre-assembled into under-body, body side’s panels and body closures are separated before assemble into a complete BIW.
In welding field now a day’s Spot welding is a advance technique to join two or more parts in the producing a car Spot welding is used in an automotive industry. The main application of using resistance spot welding technique is the machine is applicable to robot arm so that, welding work will be done at faster than other technique. In resistance spot welding process, two or three overlapped or stacked stamped components are welded together because of the heat created due to electrical resistance. This can be done by the work pieces as they hold together under pressure
between the electrodes. Spot welding may be performed manually, using robots, or using dedicated resistance spot welding machine which takes only few seconds.
Spot welds are discrete weld locations on the assembled components which look like small circles. They are not continuous, linear welds. Low volumes of components are usually done by manually, where as mass volumes can be done the best by using robots or dedicated weld equipment. There are number of variables involved in resistance spot welding such as current, pressure, time, human element, type of condition of welder, condition of electrodes and condition of surface. Some of the weld parameters are difficult to control and may cause weld quality. Some of them are easy to control such as the current, time and electrode pressure. Achieving good weld quality necessity to start with good process parameter design that minimizes the variables during welding.
The comprehensive summary concerning technology of resistance spot welding of aluminum alloys was presented (A. AMBROZIAK et al. 2010). The welding schedule, electrical parameters of resistance welding, electrodes materials and electrodes life time by resistance spot welding aluminum were described. M. Pouranvari (2009) investigated the effect of process variable like pressure, current, welding time on low carbon steel with peak load and failure mode to describe spot weld performance. Marashi & Pournavari studied failure mechanism of resistance spot welded specimen and their microstructure details of heat affected zones of welded section and carried regression analysis to optimize the welding current and weld time setting to achieve a minimum nugget diameter and maximum tensile force. The work was carried out on the SPRC35 steel sheet. M. Subramaniam (2010) concluded the increase in the current will lead to increase in nugget diameter and tensile shear strength. The properties of resistance spot welds of dissimilar steels have been studied. A.B.Verma (2014) Attempts were made to link a weld’s quality to its attributes under tensile-shear testing. The influence of the welding parameters on the weld metal size has been evaluated. The use of Taguchi method provides a systematic and effective means to deal with the multivariable nature of characterizing a spot weld. M. Salem et.al (2011) in this paper author finds that constant tip voltage did reduce the
Volume: 03 Issue: 08 | Sep-2016 www.irjet.net p-ISSN: 2395-0072
variance of the weld spot diameter. In order to improve the consistency of RSW, control of the voltage at the electrode is considered. By comparing open loop voltage control and constant current control above approach is evaluated. Open loop voltage control mode is original control mode for RSW, while constant current control mode is the present state for art control technology with large scale resistance spot welding. The paper finds that constant tip voltage reduces the variance for weld spot diameter. Nachimani Charde (2010) This study may lead to the consideration of medium carbon steels for car assembly which offers the high strength joints with low cost as compared to other materials. Considered technically, the growths in spot weld are mainly developed due to the basic controlling parameters such as weld current, weld time, force and electrode tip dia. the welding current, welding time and electrode pressing force are increased from lower range of weld lobe to higher range of weld for 1mm base metals while electrode tip remained unchanged range of weld lobe to higher range of weld for 1mm base metals while electrode tip remained unchanged. A.G Thakur et. al. (2010) has investigated an optimization and the effect of welding parameters on the tensile strength for spot welded GI steel sheets. The level of importance of the welding parameters on the tensile strength is determined by ANOVA. Based on the ANOVA method, the highly effective parameters on tensile strength were found as weld current and welding time, whereas electrode force and electrode diameter were less effective factors. The conclusion showed that welding current was about two times more important than the second factor weld time for controlling the tensile shear strength. Ugur Esme (2009) has studied optimization of RSW process parameters in SAE 1010 steel using the Taguchi method investigated that increasing welding current and electrode force are most influencing factors controlling the weld strength. He conclude that Taguchi method can be effectively used for optimization of spot welding parameters. A.S. Panchakshari et.al (2013) has studied the Non-Linear method like Genetic Algorithm to optimize the machining parameters of Resistance Spot Welding that is cycle time (Weld, Hold, and Squeeze) and current which are responsible for Nugget Diameter & Strength of weld. Low carbon cold rolled EDD grade material has been consider for response. Corresponding mathematical model based on factorial regression & ANOVA developed which expresses generalized relation between responses and variable input process parameters. Aravinthan Arumugam et.al (2015) have studied the use of Grey Based Taguchi Method to optimize the welding schedule for welding steels with dissimilar thicknesses and types using Taguchi L9 orthogonal array optimization technique. S. Aslanlar et.al (2012) has studied the effects of drilling parameters on surface roughness and roundness error in drilling of AI6061 alloy with HSS twist drills. In addition, optimal control factors for the hole quality were determined by using Taguchi - Gray relational analysis. Cutting speed, feed rate, drill diameter, point angle and cutting fluid mixture ratio were considered as control
factors, and L18 orthogonal array was determined for experimental trials. Gray relational analysis was employed to minimize the surface roughness and roundness error achieved via experimental design.
2. METHODOLOGY
Resistance spot welding (RSW) are done for GI (CRC-D2) sheet with thickness of 0.8, 1.2, 1.5, 2 mm respectively. For the model structure, Taguchi L27 orthogonal array was selected for experiment design. Selection of Orthogonal array are depends on number of input parameter and their levels. GRA were performed for the parameters estimation and comparison. To measure the performance of the model used F ratio, Sum Square (SS) Error and Mean Square (MS) Error was used as a model validation tests.
The first step in a GA is to initialize the population that means to create an initial population .An initial population of desired size is generated randomly. A Simple Genetic Algorithm largely uses three basic operators which are-1) Reproduction 2) Cross over 3) Mutation. There are two basic parameters of genetic algorithm, cross over probability (Pc) &mutation probability (Pm) &hence they are taken.0.7&0.01 respectively. GA Optimization for Matlab is used for execution of the problem with coded spot welding program. Further the levels of importance are calculated by performing ANOVA.
3. Experimental work
3.1.Method
A current and timer controlled electrical resistance spot welding machine was used in experimental works. It has 120 kVA capacity and pneumatic application mechanism. Part were welded by electrical resistance spot welding by changing electrode force, welding current, cycle time and fixing electrode diameter having 15 mm sphere, cooling water flow rate during experiments.
Table 1: Specification of Machine
Make of RSW machine TECHNA Weldcon India
Pvt. Ltd. Nashik
Supply 415 Volt(AC)
Frequency 50 Hz
Cooling water flow 12 Lpm
Max. electrode force 600 kgf
3.2.Material
The materials used in experiment were commercially available galvanized CRC D2 steel sheet, widely used in car fabrication. Its composition is C-0.065%, Si-0.095, Cr-0.017, Ni-0.032, Cu-0.053, Mn-0.404, S-0.017, P-0.018 and Fe-balance. The thickness of it is 1.2 mm and galvanized layer is 8 µ. Specimens were prepared by the hydraulic cutting process.
3.3.Experimental factors and their levels
Level Experimental control Factors Current
(KN) A Weld time (cycle) B
Electrode
Force(kgf) C Thickness (mm) D
1 8 9 210 1.2
2 8.5 9.5 300 1.5
3 9 10 400 2
Table 2 presents four controlled factors of the current (i.e., C (KA)), the weld time (i.e., WT(cycle)), the electrode force (i.e., F (KN)), and the thickness (i.e., t(mm)) with three levels for each factor. Table 3 shows the Twenty seven experimental runs according to the selected orthogonal table. After spot welding, two quality objectives of the work pieces are chosen, including the tensile strength (i.e., TS (KN)) and nugget diameter (i.e., (mm)).
Table 3: Experimental layout using an L27 OA and performance results
Ex. No
Levels of parameters TS
(Kgf)
ND (mm)
A B C D
1 8 9 210 1.2 5375 5
2 8 9 300 1.5 5375 5.2
3 8 9 400 2 5250 5.9
4 8 9.5 210 1.5 5750 5.75
5 8 9.5 300 2 5375 5.3
6 8 9.5 400 1.2 5750 5.7
7 8 10 210 2 5625 5.95
8 8 10 300 1.2 5500 6.5
9 8 10 400 1.5 5375 5.6
10 8.5 9 210 1.2 5625 5.9
11 8.5 9 300 1.5 6000 6.1
12 8.5 9 400 2 5500 6.5
13 8.5 9.5 210 1.5 5750 5.85
14 8.5 9.5 300 2 5875 6.1
15 8.5 9.5 400 1.2 5755 6.3
16 8.5 10 210 2 5875 6.25
17 8.5 10 300 1.2 6000 5.95
18 8.5 10 400 1.5 5750 6
19 9 9 210 1.2 6000 6.1
20 9 9 300 1.5 5800 6.6
21 9 9 400 2 5750 5.75
22 9 9.5 210 1.5 6250 6.5
23 9 9.5 300 2 5875 5.75
24 9 9.5 400 1.2 5775 5.95
25 9 10 210 2 5875 6.35
26 9 10 300 1.2 5750 6.6
27 9 10 400 1.5 5875 5.9
4. Results
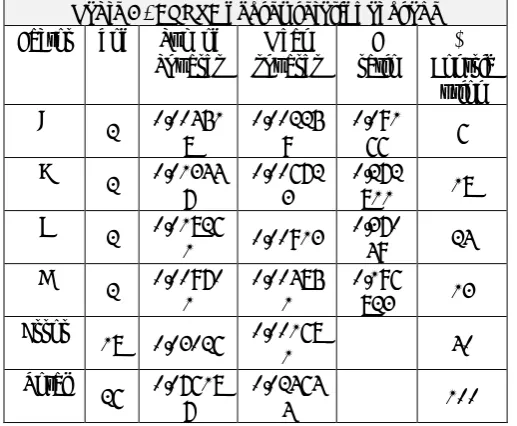
[image:3.595.35.290.107.246.2]The distinguishing coefficient can be substituted for the Grey relational coefficient. If all the process parameters have equal weighting, is set to be 0.5. Table 4 listed the Grey relational coefficients and the grade for all twenty seven comparability sequences.
Table 4: The calculated grey relational grade and its order in the optimization process
Sr.N o.
Grey relational coefficient
Grey relational
grade
Rank
TS ND
1 0.363636 1 0.681818 1
2 0.363636 0.8 0.581818 3
3 0.333333 0.470588 0.401961 25
4 0.5 0.516129 0.508065 11
5 0.363636 0.727273 0.545455 5
6 0.5 0.533333 0.516667 10
7 0.444444 0.457143 0.450794 21
8 0.4 0.347826 0.373913 26
9 0.363636 0.571429 0.467532 19
10 0.444444 0.470588 0.457516 20
11 0.666667 0.421053 0.54386 6
12 0.4 0.347826 0.373913 26
13 0.5 0.484848 0.492424 14
14 0.571429 0.421053 0.496241 13
15 0.502513 0.380952 0.441732 22
16 0.571429 0.390244 0.480836 16
17 0.666667 0.457143 0.561905 4
18 0.5 0.444444 0.472222 17
19 0.666667 0.421053 0.54386 6
20 0.526316 0.333333 0.429825 23
21 0.5 0.516129 0.508065 11
22 1 0.347826 0.673913 2
23 0.571429 0.516129 0.543779 8
24 0.512821 0.457143 0.484982 15
25 0.571429 0.372093 0.471761 18
26 0.5 0.333333 0.416667 24
27 0.571429 0.470588 0.521008 9
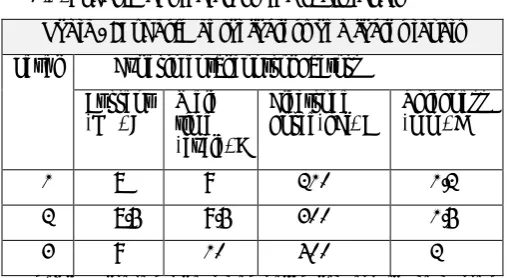
This investigation employs the response table of the Taguchi method to calculate the average Grey relational grades for each factor level, as illustrated in Table 5. Table 2: Experimental factors and factor levels
Volume: 03 Issue: 09 | Sep-2016 www.irjet.net p-ISSN: 2395-0072
[image:3.595.308.561.197.640.2]Table 5: Response table for the grey relational grade Fact
or
Grey relational grade Main
effect (max-min)
Rank Level 1 Level 2 Level 3
A 0.50311
4
0.48007 20
0.5104 29*
0.030357 4
B 0.50251
5
0.52258 4*
0.4685 15
0.054069 2
C 0.52899
*
0.49927 30
0.4653 42
0.063657 1
D 0.49767
3
0.52118 5*
0.4747 56
0.046429 3
Total mean value of the grey relational grade =0.497871
* Levels for optimum grey relational grade A3B2C1D2
Furthermore, ANOVA has been performed on grey relational grade to obtain contribution of each process parameter affecting the two process characteristics jointly and is discussed in the forthcoming section
Table 6 - ANOVA of grey relational grade
Factor dof Sum of
Squares
Mean squares
F ratio
% Contrib
ution
A 2 0.00451
8
0.00225 9
0.091
66 6
B
2 0.01344
7
0.00672 3
0.272
811 18
C
2 0.01826
1 0.00913
0.370
49 24
D
2 0.00970
1
0.00485 1
0.196
823 13
Error
18 0.03026 0.001681 40
Total
26 0.07618
7
0.02464
4 100
Additionally, Table 6 gives the results of the analysis of variance (ANOVA) for the TS and the ND using the calculated values from the Grey relational grade of Table 4 and the response table of Table 5. According to Table 6, the factor C, the Electrode force with 24% of contribution, is the most significant controlled parameters for the resistance spot welding operation; the weld time is with 18% contribution, the thickness with 13%, and the current with 6% of contribution if the maximization of the tensile strength and nugget diameter are simultaneously considered.
Table7: Improvements in grey relational grade with optimized RSW machine parameters
Condition
description Optimal machining parameters
Machining parameters in first trial
of OA
Grey theory prediction
design
Genetic Algorithm optimization
Level A1B1C1D1 A3B2C1D2 A1B1C2D1
Tensile strength
(TS)
5375 6250 6875
Nugget Diameter
(ND)
5 6.5 5.95
grey relational
grade
0.681818 0.673913 0.69986
Improvement in grey relational grade = 0.018042
5. Conclusion
The GRA based on the Taguchi method’s response table has been proposed as a way of studying the optimization of RSW process parameters for GI, CRC D2 Sheet. The optimal machining parameters have been determined by the grey relational grade and Genetic Algorithm for multi performance characteristics that are Tensile Strength and Nugget Diameter which affects the reducing the power losses for unequal sheet and verified by comparing optimum set of parameter with RWMA standard. Twenty seven experimental runs based on OA’s have been performed. The following conclusions can be drawn from this study.
1. The work has successfully evaluated the feasibility of Tensile strength in RSW of unequal thickness of CRC D2 sheet.
2. From the response table of the average grey relational grade, it is found that the largest value of grey relational grade for current, weld time electrode force and thickness are 8 KA, 9 cycle, 210 KN and 1.2mm, respectively. These are the recommended levels of controllable process factors when better Tensile strength, lesser Nugget Diameter is simultaneously obtained.
3. The ANOVA of grey relational grade for multi-performance characteristics reveals that the electrode force is the most significant parameter.
[image:4.595.34.293.381.594.2]4. Based on the confirmation test, the improvement in TS and ND is 6875 KN, and 5.95 mm from 5375 KN and 5 mm respectively.
It is shown that the performance characteristics of the RSW process such as TS and ND are improved together with reducing power consumption using the method proposed by this study. The effectiveness of this approach has been successfully established by validation experiment.
6. References
1) AMBROZIAK, M. KORZENIOWSKI, “Using resistance spot welding for joining aluminum elements in automotive industry”, ARCHIVES OF CIVIL AND MECHANICAL ENGINEERING, Vol. X, 2010.
2) M. Pouranvari, and S.P.H Marashi,“Factors Affecting Mechanical Properties of Resistance Spot Welds,” Materials Science and Technology, vol. 26, no. 1, 2010, pp. 1137-1144
3) M. Balasubramaniam, and V. Subramanian, “Effect of Process Parameters on SPRC35 Spot Welded Automotive Panels,”ActaMetallurgicaSinica, vol. 23, no. 3,2010, pp. 185-190
4) S. Aslanlar, et.al “Effect of welding current on mechanical properties of galvanized chromided steel sheets in electrical resistance spot welding” Materials and Design, 28 (2007), 2–7
5) M. Salem, et.al “Improved Consistency Of Resistance Spot Welding With Tip Voltage Control” IEEE CCECE, 2011
6) Nachiman Charde, “An Experimental Investigation on Spot Weld Growth on Dissimilar Joints of 304L Austenitic Stainless Steel and Medium Carbon Steel,” International Journal of Advances in Applied Sciences (IJAAS) Vol. 2, No. 1, March 2013, pp. 25~32 ISSN: 2252-8814
7) A. Ogur, U. Ozsarac, and E. lhan, “Effect Of Welding Current On Mechanical Properties Of Galvanized Chromate Steel Sheets In Electrical Resistance Spot Welding,” Materials and Design, vol. 28, 2007, pp. 2-7
8) A.G Thakur, T.E. Rao, M.S. Mukhedkar, and V.M. Nandedkar, “Application of Taguchi Method for Resistance Spot Welding of Galvanized Steel,” ARPN Journal of Engineering and Applied Sciences, vol. 5, no. 11, 2010, pp. 22-26A
9) Ugur Esme, “Application Of Taguchi Method For The Optimization Of Resistance Spot Welding Process” The Arabian Journal for Science and Engineering, Volume 34, Number 2B, 2009
10)M. Norasiah, Y.H.P. Manurung, M. Hafidzi, and S.K. Abas, “A Quality Improvement Approach for Resistance Spot Welding using Multi-Objective
Taguchi Method and Surface Response
Methodology, ”International Journal of Advanced Science, Engineering and Information Technology, vol. 2, no.3,2012, pp. 17-22
11)A.S. Panchakshari, “Optimization of the Process Parameters in Resistance Spot Welding Using Genetic Algorithm” International Journal Of Multidisciplinary Sciences And Engineering, Vol. 4, 2013
12)Aravinthan Arumugam, “Spot Welding Parameter Optimization To Improve Weld Characteristics For Dissimilar Metals,” International Journal Of Scientific & Technology Research, Volume 4, Ensue 01Issn 2277-8616, January 2015.
13)Muhammad Norasiah, “Optimization And Modeling Of Spot Welding Parameters With Simultaneous Multiple Response Consideration Using Multi-Objective Taguchi Method And RSM” Journal of Mechanical Science and Technology 26 (8), (2012), 236
Volume: 03 Issue: 09 | Sep-2016 www.irjet.net p-ISSN: 2395-0072