Robotized Warehouse Systems: Developments and
Research Opportunities
Kaveh Azadeh, René de Koster
Rotterdam School of Management, Erasmus University, The Netherlands
Debjit Roy
Indian Institute of Management, Ahmedabad, India
Abstract
Robotized handling systems are increasingly applied in distribution centers. They require little space, provide flexibility in managing varying demand requirements, and are able to work 24/7. This makes them particularly fit for e-commerce operations. This paper reviews new categories of robotized handling systems, such as the shuttle-based storage and retrieval systems, shuttle-based compact storage systems, and robotic mobile fulfillment systems. For each system, we categorize the literature in three groups: system analysis, design optimization, and operations planning and control. Our focus is to identify the research issue and OR modeling methodology adopted to analyze the problem. We find that many new robotic systems and applications have hardly been studied in academic literature, despite their increasing use in practice. Due to unique system features (such as autonomous control, networked and dynamic operation), new models and methods are needed to address the design and operational control challenges for such systems, in particular, for the integration of subsystems. Integrated robotized warehouse systems will form the next category of warehouses. All vital warehouse design, planning and control logic such as methods to design layout, storage and order picking system selection, storage slotting, order batching, picker routing, and picker to order assignment will have to be revisited for new robotized warehouses.
1
Introduction
Warehouse operations tend to be labor intensive and require large space for facilities. Large buildings are needed to store the item assortment in racks, to move stock, to unload and load
trailers and containers, to inspect picked orders, and to allow trucks to maneuver in the yard and to dock them. With the advent of e-commerce, companies store millions of unique items and handle large and variable daily order volumes. On the other hand, the most laborious and expensive process, order picking, is repetitive, often suffers from poor ergonomics, and requires high-quality labor willing to work in shifts, which is often difficult to get. It is therefore not surprising that warehousing systems and processes are key candidates for automation. In addition, the land available for warehouses (which should preferably be close to the demand points) has become scarce, and many warehouses have to operate 24/7. Together, this has given warehouse automation a big boost. Warehouse automation dates back to the 1960s, when the first high-bay (20-40 m high was quite standard) unit-load warehouses were established in Germany with aisle-captive cranes driving on rails, constructed as a silo building (Industrie-forum 2004). These so-called AS/R (automated storage and retrieval) systems were able to store bulk stock on unit loads (pallets, or totes: miniload system). They could also work in conjunction with manual pick stations as a parts-to-picker system, where the retrieved unit load was restored after picking units from it. Since then, AS/R systems have become very popular in practice, and research has gained momentum with the papers by Hausman et al. (1976), and Bozer and White (1984). Hundreds of papers have been published on these systems. An overview is given by Roodbergen and Vis (2009).
The last decade, warehouse automation has developed rapidly. A big boost has been given by the AVS/R (autonomous vehicle-based or shuttle-based storage and retrieval) systems. These systems use racks with aisles and deploy autonomous shuttles that operate at each level in each aisle. Vertical transport is enabled by lifts. Another important development has been auto-mated pallet stacking and destacking technologies, in particular also by mixed-case palletiz-ing technology developed in the early 2000s. A new generation of automated guided vehicles (AGVs), supporting the order picking process has recently been introduced. These systems will gradually result in automated picking processes. Pioneered by Witron, combining mul-tiple technologies has led to the advent of completely automated warehouses, particularly in the store-based retail industry (mostly grocery). In Western Europe alone, about 40 fully
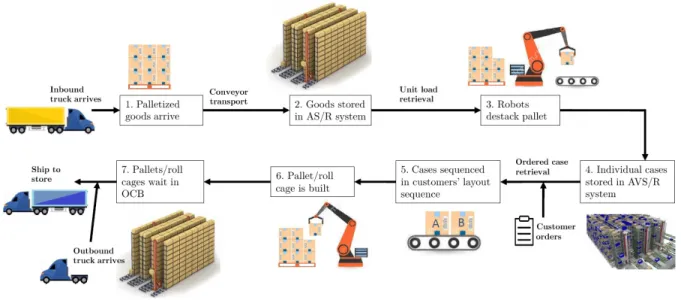
automated warehouses are in operation and many are under development. Although these warehouses are large, they are much smaller (and supposedly more cost-efficient) than their conventional, manual counterparts. Figure 1 shows a flow diagram of such a warehouse with typical storage and handling systems.
Figure 1: Material flow in an automated warehouse
In such an automated retail warehouse, selected suppliers unload their own trucks and feed the pre-announced single-sku (stock-keeping unit) pallets to a check-in conveyor (step 1). The pallets are then stored in an AS/R system (2). When a certain product is requested, the pallet is off loaded and automatically destacked (3). The loose cases are then often put on trays to ease manipulation and are stored in a miniload AS/R, or in an AVS/R system (4). When the store order arrives, the cases are retrieved and sequenced (5), and mixed-case palletizers build the pallets or roll-cages in a store-specific sequence that allows rapid shelving in the store (6). These roll-cages then wait in an order consolidation buffer (OCB), usually some AS/R system (7), until the departure truck arrives, after which they are retrieved and loaded in the sequence determined by the stop sequence in the truck route.
• • • • • • • • • • • • • • • • • • •
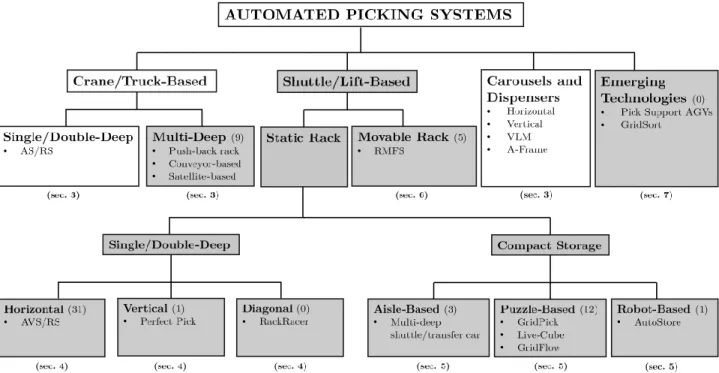
Figure 2: Classification of automated picking systems. The literature of the gray-shaded sys-tems is reviewed. The numbers of reviewed papers are shown between brackets. Sec. refers to the section which deals with the respective systems.
Apart from the (many) technicians needed to keep the system alive, no manual handling is involved. However, the majority of warehouse research still focuses on conventional storage and order picking methods. The overview by De Koster et al. (2007) provides some avenues for research into (semi-)automated picking methods. Due to rapid system developments, it is time for an update, as the new technologies have provided new and interesting research oppor-tunities. This paper structures the new automated technologies and provides an overview of these technologies and the research carried out already. It also reviews the modeling techniques used and the research opportunities they provide. We focus on design and control of order picking systems, as they form the heart and soul of any warehouse. In doing so, we include the corresponding automated product storage and handling techniques. Figure 2 categorizes the automated picking systems, both the classical as well as the newly developed automated picking systems. To find the articles, we used the following search terms in Scopus: “autonomous ve-hicle/shuttle storage and retrieval systems”, “robotic mobile fulfillment system”, “puzzle-based
storage system”, “compact warehouse storage systems and robotic warehouse storage and re-trieval systems”, as well as variants of these search terms. We review papers published in high quality journals, complemented by some working papers and proceedings for prominent systems that have not received much attention yet. We review 62 papers on the core systems indicated in the gray-shaded boxes in Figure 2.
We first describe various modeling methods used in the design and operation of the systems and the associated objectives (Section 2). Section 3 deals with the ‘conventional’ AS/R systems, that have been researched intensively, and then continues with less conventional crane and truck-based systems, such as multi-deep racks operated by cranes and satellites, and carousel systems. Section 4 discusses various types of AVS/R systems, and Section 5 considers three types of compact storage systems: aisle-based, puzzle-based, and robot-based. Section 6 continues with robotic movable rack-systems. Section 7 discusses directions for future research and includes emerging technologies, in particular, humans picking in collaboration with AGVs. We conclude in Section 8.
2
Modeling Methods: Storage, Transport and Order
Pick-ing Process
Two approaches exist to model the systems: Analytical-based andSimulation-based. Simulation-based models can mimic reality accurately and produce the least error. However, conceptual-izing and designing a detailed and accurate simulation model is time intensive. Optimconceptual-izing the entire design space may require the development of multiple models. Therefore, at an early stage, analytical models are preferred, to reduce the design search space and to identify a limited number of promising configurations. Compared to simulation modeling, analytical models run faster and can obtain the optimal configuration with a quick enumeration over a large number of design parameters. The error made in the estimated performance measures using analytical models is usually acceptable for the conceptualization phase. Section 2.1, explains analytical
models. Section 2.2 discusses the use of analytical models in design and operational perfor-mance optimization. As an example, Section 2.3 describes how a single-tier AVS/R system can be modeled analytically.
2.1
Analytical Models
Analytical models for storage and retrieval are classified into two categories: Travel Time Models and Queuing Network (QN) Models.
Travel Time Models
Using travel time models, the design engineer can obtain the amount of time that it takes for a resource to move from one location to another. For instance, in an automated parts-to-picker picking context, travel time models can be used to obtain a closed-form expression for the expected load storage and retrieval time. The closed-form travel time expressions are usually simple and computationally friendly. Therefore, they can be used to limit the search space before adopting a detailed simulation, or for optimizing the design choices. They can also be used to estimate the expected service time of a server in a network of queues. Despite the simplicity of the travel time models, they are not capable of capturing several factors such as interaction between multiple resources, parallel processing by multiple resources, or queueing within the system. In these scenarios, QN models are preferred.
Queueing Network Models
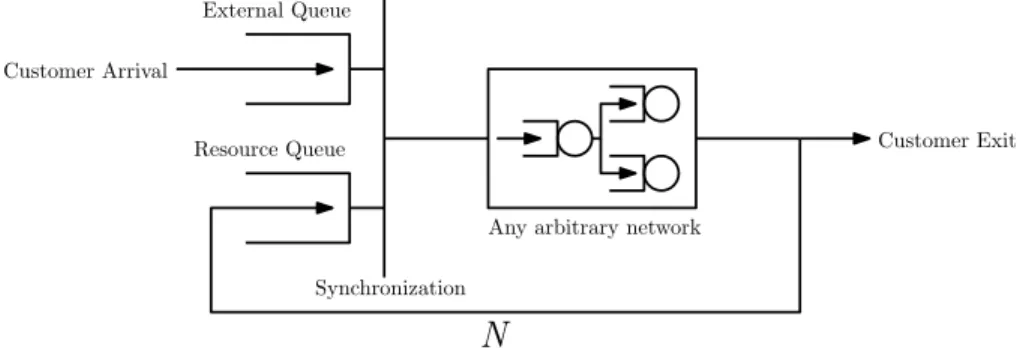
Automated picking systems can be modeled as a multi-stage service system using a QN. In a QN, a customer arrives in the system, undergoes several stages of service and leaves the system. Several types of queueing networks have been studied: Open (OQN), Closed (CQN), and Semi-Open (SOQN). In an OQN, customers, such as orders to be picked, arrive from an external source and after receiving service in different nodes, they leave the system. An OQN is particularly useful to estimate expected order throughput time. However, in many systems, resources accompany orders during the whole or a part of the process, e.g. a transport vehicle,
or a transport roll container or a pallet. Often, the number and the capacity of the resources are limited which affect the performance of the system. For instance, orders might be transported by expensive robots in the system. In this scenario, an OQN is not capable of accurately estimating the performance of the system as it assumes an infinite supply of robots. One way to overcome this challenge is to model the system as a CQN. In a CQN, a limited number of resources are paired with the incoming orders. Once an order is completed, the resource becomes available and can serve another order. The limited number of resources enforces a population constraint in the CQN. However, it is implicitly assumed that an infinite number of orders are waiting outside the system (Heragu et al. 2011). CQNs are useful to estimate the throughput capacity of the system. Using a CQN to model the systems in which the incoming customers and the resources are paired together throughout the process, leads to an underestimation of the true customer waiting time. The reason lies in the assumption (infinite number of customers waiting externally in a CQN). However, in reality, there are times when a customer needs to wait for a resource or vice versa. In this situation, an SOQN is a suitable model because it can accurately capture the transaction waiting time. As it illustrated in Figure 3, an SOQN (in the literature sometimes called an open queueing network with limited capacity) possesses a synchronization station in which incoming customers waiting at an external queue are paired with available resources in the resource queue. Then, the customer is processed using the resource that carries the customer to pre-specified different nodes (Cai et al. 2013, Roy et al. 2015b, Roy 2016).
Any arbitrary network
N External Queue Resource Queue Customer Arrival Customer Exit Synchronization
Figure 3: A general semi-open queueing network
Solution Methods for Evaluating Queueing Networks: One of the most important methods for calculating performance measures of product-form queueing networks (Baskett
et al. 1975) is Mean Value Analysis (MVA) (Reiser and Lavenberg 1980). The MVA algorithm is based on Little’s Law and the arrival theorem. However, networks used in analyzing auto-mated picking systems usually do not have product-form solutions for a number of reasons, such as non-exponentially distributed service times, customer blocking, or non-Markov routing. Therefore, approximation algorithms are used to estimate the performance measures of the system. Several approximation techniques such as Approximate Mean Value Analysis (AMVA) and the parametric decomposition approach proposed by Whitt (1983) have been developed based on the characteristics of the network. Bolch et al. (2006) provide a detailed overview of exact and approximate algorithms to evaluate the performance of open and closed queueing networks. The SOQN does not have a product-form solution, even for Poisson arrivals and ex-ponential servers. The Matrix-geometric method (MGM), aggregation, network decomposition, parametric decomposition, and performance bounds are the most common solution approaches for approximating the performance of an SOQN. Roy (2016) gives a detailed overview of solution techniques to evaluate an SOQN.
2.2
Design Optimization and Operational Planning and Control
Two levels of decision-making can be distinguished in warehouse planing and design: long-term (tactical) and short-term (operational).
In long-term planning, decisions revolve around the hardware design selection and optimiza-tion (DO) of the system. At this level, the prime objective is to maximize the throughput and the storage capacity of the system. The objectives are affected by several decision variables, such as the physical layout configuration (e.g. the number of aisles, the depth of each aisle, the number of cross-aisles, and the number of tiers), the number of robots and lifts, and the location of load/unload points. At this stage, the focus is on the decisions that are hard to reverse once the system is in place.
Short-term decision-making focuses on operational planning and control (OP&C). Some of the prime objectives are to minimize lead time, waiting time, response time, and resource
idleness, etc. Decisions include vehicle assignment policies, blocking prevention protocols, dwell point use of the vehicles i.e. selecting the location where a vehicle without a job is parked, storage slotting, and station assignment rules.
Analytical models can address both the long-term and short-term decision-making. With a travel time model, it is (sometimes) possible to obtain a closed-form expression of the per-formance measures, such as the average processing time. By taking derivatives with respect to the desired decision variables, one can optimize the system with regards to the performance measure. However, deriving a closed-form expression of the system measure such as transaction waiting time is often not possible. Therefore, queueing network and simulation-based models are used to estimate such dynamic performance measures. Performance optimization is done by enumerating the decision variables. Sometimes, combinations of decision variables have a joint effect on the performance of the system. As a result, some authors, such as Ekren and Heragu (2010b) suggest using regression models with interaction variables to evaluate the combined effect of decision variables on the performance of the system. Then, the enumeration is done over the variables and their combinations on the desired performance measure.
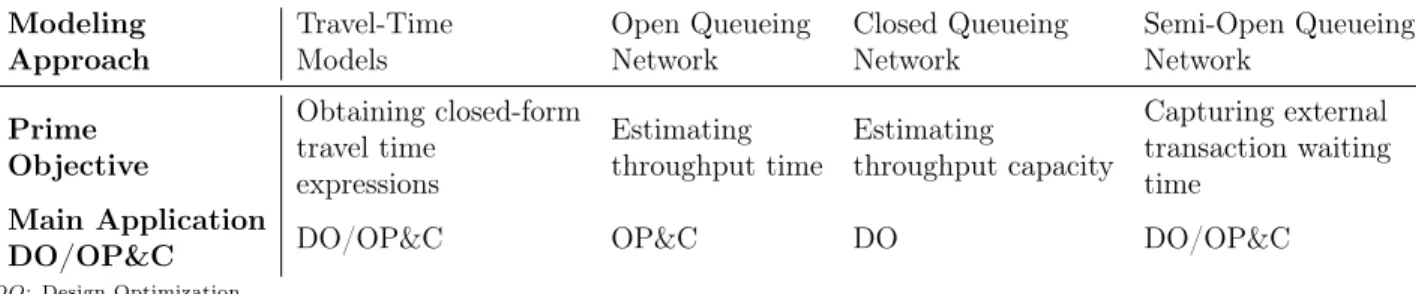
Table 1 presents a framework of modeling approaches to analyze various performance mea-sures.
Table 1: Modeling approach framework for performance measures
Modeling Approach Travel-Time Models Open Queueing Network Closed Queueing Network Semi-Open Queueing Network Prime Objective Obtaining closed-form travel time expressions Estimating throughput time Estimating throughput capacity Capturing external transaction waiting time Main Application
DO/OP&C DO/OP&C OP&C DO DO/OP&C
DO: Design Optimization
OP&C: Operational Planning and Control
2.3
Example: Analytical Model of a Single-Tier AVS/RS
In this section, we present the modeling approach proposed by Roy et al. (2015b) to model a single-tier AVS/R system. The model can be used for design optimization or for operational
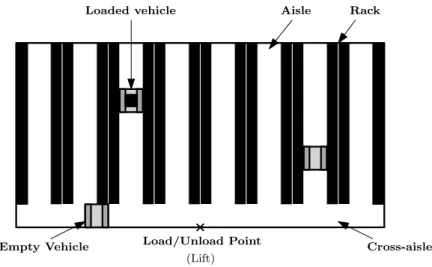
planning and control. Figure 4 shows the top view of the system. The tier comprises N two-sided storage aisles (A1, ..., AN) and a cross-aisle orthogonal to the storage aisles. V vehicles
perform the storage and retrieval transactions. The Load/Unload point is located in the middle of the cross-aisle. Load/Unload Point Aisle Rack Cross-aisle Empty Vehicle Loaded vehicle (Lift)
Figure 4: Schematic top view of a single-tier AVS/RS
To model the system we make the following assumptions: 1) Transactions are in the form of single-command cycles. 2) The FCFS rule applies to process the transactions. 3) Vehicles are pooled, meaning they have an equal probability to be chosen to perform a transaction. 4) Storage and retrieval requests are uniformly distributed throughout the tier. 5) The number of aisles, N, is even. 6) Vehicles dwell at the L/U point. 7) Blocking within the cross aisle and storage aisles is handled by two protocols. A switching policy determines which of the vehicles is allowed to use the cross-aisle at the L/U point and the storage aisle end. Inside each storage aisle, the current vehicle must yield to the incoming vehicle. This means that when a new vehicle enters the aisle, the current vehicle moves to an empty bay location at the back of the aisle and waits for the incoming vehicle to complete its operation.
Figure 5 illustrates the resulting SOQN for the single-tier AVS/R system. The model consists of N + 4 nodes. We divide the cross-aisle into two equal parts: the left side of the L/U point, or node CAL, and the right side of the L/U point, or node CAR. Therefore, the
queueing network has N aisle nodes,A1, ..., AN, and two cross-aisle nodes,CALand CAR. The
node matches the transaction requests to the vehicles. Transactions wait in buffer B1 and
vehicles wait in buffer B2. The routing of the vehicles in the network depends on the type of
transaction. For example, the routing of a vehicle processing a storage transaction is as follows. First, the storage transaction waits in B1 to be matched with a vehicle in the synchronization
station J. The vehicle then picks up the load in the L/U point, represented by node L/U. Next, the vehicle travels through either one of the cross-aisle nodes, to travel to its desired aisle and storage position. These two nodes are modeled as an infinite server (IS) station. After the vehicle gets served in the cross-aisle node, it moves to an aisle node to store the load. Using the mentioned blocking protocol, each aisle is modeled as a Last-Come-First-Serve with preemptive resume service queue (LCFS-PR). After unloading, the vehicle takes the same path back to the L/U point. Upon arriving at the L/U point, the vehicle is free to be used again and moves to buffer B2 to be matched with another transaction. The model is evaluated using a network
decomposition approach. See Roy et al. (2015b) for further details of the model as well as the extension of the model to multi-tier AVS/R systems.
L/U CAL CAR A1 A2 AdN 2e AdN 2e+1 AN−1 AN V J B2 B1 λs+λr Storage classes Retrieval classes
3
Crane/Truck-Based Automated Picking Systems
Crane-based Automated Storage and Retrieval System (AS/RS) were introduced in the 1960s. Initially, their main application was in pallet warehouses storing bulk inventories. Later, mini-load warehouses and more compact and multi-deep order picking warehouses were also auto-mated. In this section, we discuss the different types of crane-based automated systems (see Figure 2).
3.1
Single-Deep Automated Storage Systems
Such a system consist of racks and automated handling systems such as cranes or automated trucks. These handling systems can be aisle-captive (typically cranes) or aisle-roaming (typi-cally high-bay AGV trucks). To perform a storage operation, a crane picks up a load, usually from a conveyor, and stores it in the 30-40m high racks. Driving and lifting in the aisle take place simultaneously. The process sequence is reversed for a retrieval operation. It is also pos-sible to carry out a dual command cycle, in which a storage and a retrieval job are combined. This would save one movement per dual command cycle. If totes instead of pallets are stored, the system is referred to as mini-load. Figure 6 shows an example of such a warehouse.
Unit-load and mini-load aisle-captive AS/R systems have been studied extensively. One of the first scientific articles is by Bozer and White (1984). They calculate the average cycle time of the crane for single command cycles, and assume that crane travel to any location within the rack has the same probability (random storage policy). Their expected cycle time is
E[T] =1 + (ty/tx)2
3
.tx, in whichtx is the travel time to the farthest location in the rack and
ty is the lifting time to the highest location in the rack. The formula assumes that the crane
drives and lifts at the same time and that the travel time to the farthest location is longer than the lifting time. Using this formula, the optimal ratio between the length and height of an aisle can be obtained, which proves to be square in time (SIT), meaning that the travel time to the farthest location and the lifting time to the highest location are identical. Assuming
Figure 6: Automated high-bay warehouse for pallets with aisle-captive cranes. (Source: Daifuku America)
that a crane travels approximately four times faster than it lifts, the length of the aisle should therefore be four times its height in order to minimize the cycle time. Later on, this formula was adjusted to include other aspects of the warehouse, such as different storage strategies (such as ABC storage), dual command cycles, and different locations of the load and unload points (the above formula assumes one such point, at the lower corner of the rack). We refer to Roodbergen and Vis (2009) for an extensive overview of the literature on AS/R systems.
In the case of ABC (or product turnover-based) storage, the items are divided into classes (e.g. three: A, B, C), based on item turnover rate. The locations are also divided into groups based on travel time to the L/U point. This ensures that the items from the class with the highest turnover rate are located closest to that point. Hausman et al. (1976) investigated the cycle time calculations with ABC storage and EOQ-based replenishment. Later, their results were extended to N product classes by Rosenblatt and Eynan (1989). Hausman et al. (1976) calculated the optimal class boundaries for known ABC demand curves, for example, 20/70 demand curves, whereby 20% of the items (or unit-loads) are responsible for 70% of the demand. In the calculation, they considered of product restocking according to a continuous
review <s, Q> policy, with the stocking quantity Q being equal to the optimal order quantity. However, they did not take into account that the more storage classes there are, the fewer items are stored per class. This requires more space per item stored in the class, since the space within the classes cannot be shared by the items which lengthens crane travel time. In the extreme case of one item per class, the space required is P
dQi +SSie whereas in the extreme
case of one class containing all items (i.e. random storage), the space required is P
dQi
2 +SSie
. This means that an optimum number of storage classes can be distinguished. In practice, the optimal number of classes is small (about 3 to 5,) but the cycle time is relatively insensitive to the exact number. At such a limited number of classes, products can perfectly share the space available in the class. However, the required number of locations on top of the average stock level quickly amounts to an additional 40% (Yu et al. 2015).
3.2
Compact Storage Systems
AS/R systems can also be used to store loads double-deep in the racks. To this end, the cranes can be equipped with double-deep telescopic forks. Deep lane, or compact, multi-deep (3D) AS/R systems can store loads even more deep in storage lanes (see Figure 7). The storage depth depends on the type of product and the technology; e.g. 5-15 loads. These systems are particularly popular for storing products when storage space minimization is a primary concern, e.g. fresh produce and cold storage warehouses. In a typical crane-based compact storage system, a storage and retrieval (S/R) crane takes care of movements in the horizontal and vertical directions of the rack, and an orthogonal conveying mechanism takes care of the depth movement. Multi-deep lane crane-based compact storage systems can be further classified into three categories based on the mechanism of the depth movement: push-back rack, conveyor-based, and satellite-based (see Figure 2).
Push-Back Rack: In this variant, the crane (or truck) stores the loads by mechanically pushing them into the storage lanes. The system works according to the Last-In-First-Out
Figure 7: A crane-based multi-deep compact storage system (De Koster et al. 2008)
(LIFO) principle. A slight slope on the storage lane utilizes the gravity to ensure sure that a load is always available in front of the storage lane. The depth of the lane in a push-back pallet rack is up to about five loads.
Conveyor-Based: The racks in these systems are equiped with conveyors (see Figure 8). If the conveyor can move in two directions, the operation is LIFO, similar to the push-back racks. The conveyors can also operate in pairs (either by gravity or powered). On the inbound conveyor, unit loads flow to the rear end of the rack. The outbound conveyor is located next to the inbound conveyor. On the outbound conveyor, unit loads flow to the rack’s front end and stop at the retrieval position of the crane. In a case of a gravity conveyor, the rack is equipped with a simple elevating mechanism at the back of the rack to lift unit loads from the down inbound conveyor to the upper outbound conveyor (see Figure 8). A stop switch located at the front side of the outbound conveyor stops a unit load when it is needed for retrieval. The lift drives the rotation of unit loads and, as it is the slowest element, it determines the effective rotation speed. In order to retrieve a pallet, the two neighboring gravity conveyors should have at least one empty slot (De Koster et al. 2008). The system with powered conveyors does not need lifts, but uses more expensive powered conveyors (that are not so easy to fix in the case of a malfunction). However, powered conveyors allow more dense storage because racks with powered conveyors can be constructed deeper than racks with gravity conveyors.
Figure 8: Working mechanism of gravity conveyor (De Koster et al. 2008)
Satellite-Based: In this variant, a satellite (connected to the crane) or a shuttle (freely roaming) is used to perform the depth movement. The crane with a shuttle picks up a storage pallet and travels to the storage lane. Then the crane releases the shuttle in the rack and the shuttle travels along the storage lane to store the load. Likewise, to retrieve a load, the shuttle travels underneath the load to retrieve the pallet and completes the remaining operations in a reverse sequence. In some cases, the shuttles can also be dedicated to lanes. If a system has fewer shuttles than storage lanes, the crane moves the shuttles between the lanes (Stadtler 1996).
We categorize the literature on crane-based compact storage systems into three categories: System Analysis, Design Optimization, and Operations Planning and Control. System analysis articles focus on modeling techniques to estimate the performance of the system without fo-cusing on any optimization, design optimization articles focus on hardware optimization of the system (e.g. system layout), and operations planning and control articles focus on the software optimization of the system (e.g. block prevention policies). See Section 2.2 for more details regarding hardware and software objectives.
System Analysis: Sari et al. (2005) develop closed-form travel time expressions for a flow rack AS/RS. The expressions, which rely on a continuous storage rack approximation, are validated using discrete-even simulations. The simulations use a discrete rack dimensional approach. They find that the percentage errors are quite reasonable (varying between 11%-14%). Hence, such models can be used to estimate system throughput capacity.
for a crane-based compact storage system with rotating conveyors, using a single-command cycle and random storage policy. The crane’s expected retrieval travel time is identical for both gravity and powered conveyors. Using the expected travel time expressions, they calculate the optimal ratio between the three dimensions that minimized the travel time. They also provide an approximate travel time expression for dual command cycles and use it to optimize the system dimensions. They find a counter-intuitive result that the cube-in-time dimensions for the rack is not the optimal choice. The performance for a cube-in-time rack is still fairly good and deviates from the optimal rack configuration (optimal ratio along the three dimensions: 0.72:0.72:1) by about 3%. Yu and De Koster (2009a) extend the analysis of De Koster et al. (2008) for a turnover-based storage policy and determine the optimal rack dimensions that minimizes the expected cycle time. They analytically determine the optimal rack dimensions for any given rack capacity and ABC curve skewness. They find that with greater skewness of the ABC curve, savings in the expected time increase compared to the random storage policy. Yang et al. (2015) further extend the analysis ofDe Koster et al. (2008) by optimizing the shape of the system and by considering the acceleration and deceleration of the S/R machine, which has a direct impact on the optimal shape of the system. For the special case of constant speed of the S/R machine, their findings are in line with the results of De Koster et al. (2008). Hao et al. (2015) also develop expected travel time expressions and optimize the rack layout for a random storage policy. However, they choose an I/O point located in the middle of the rack (which, in reality, is difficult to construct for aisle-captive cranes). Under the same operating conditions, they obtain lower expected travel time and higher throughput.
Operations Planning and Control: One of the biggest disadvantages of dense storage is that the pallets are accessible from only one side. Therefore, pallets are either retrieved based on LIFO principle or they undergo multiple relocations/reshuffles to allow access to the right pallet. Stadtler (1996) uses the retrieval time estimate of each pallet and proposes a storage and retrieval assignment planning tool considering this issue. The decision models are formulated as mixed-integer programs and are solved using a tabu search heuristic. The results show that the compact storage systems can operate at heavy workload and high storage rack utilization with
a small number of pallet relocations (6% relocations at 78% rack utilization over a period of 42-day operation). Yu and De Koster (2012) develop heuristic approaches to sequence a block of storage and retrieval transactions for a compact conveyor-based storage system operating in a dual-command cycle. They compare the makespan performance for five sequencing heuristics: 1) First Come First Serve (FCFS), 2) Nearest Neighbor (NN), in which the sequence is based on the minimum travel distance between storage and retrieval locations, 3) Shortest Leg (SL), in which the open storage location lies on the Tchebychev path leading to the retrieval location, 4) Shortest Dual Cycle (SDC) in which sequencing is done in a way to minimize the dual cycle time in every step, and 5) Percentage Priority to Retrievals with Shortest Leg (PPR-SL), in which a certain percentage of retrievals are given a higher priority for pre-positioning than the storage open locations. Numerical results suggest that PPR-SL strategy outperforms all sequencing strategies by 20% or more. For a compact AS/R system with shuttles or satellites, one of the biggest challenges is the additional time required to reshuffle unit loads and retrieve the right unit. Many companies, therefore, use a dedicated storage policy per lane, which reduces the reshuffle time, but decreases lane utilization (and requires a larger system). To overcome this shortcoming, Zaerpour et al. (2013) propose a mathematical model for a shared storage policy that minimizes the total retrieval time in a cross-dock/temporary storage environment. They solve the model using a construction and improvement (C&I) heuristic. They show that for most real cases, shared storage outperforms dedicated storage, with a shorter response time and better lane utilization. Yu and De Koster (2009b) focus on identifying the optimal class zone boundaries for a compact 3D crane-based systems with two storage classes (a high turnover class and a low turnover class). They formulate the problem as a non-linear integer program and obtain a solution using a decomposition technique and a one-dimensional search scheme. They show that the crane travel time is significantly influenced by zone dimensions, zone boundaries, and the ABC curve skewness. Table 2 presents an overview of the literature on crane-based compact storage systems.
Table 2: Overview of the literature (9 papers) on crane-based compact storage systems
Research Category System Article Research Issue Methodology
System Analysis Conveyor-based (paired)
Sari et al. (2005)
Check validity of discrete vs. continuous travel-time expression
Probability, simulation
Design Optimization Conveyor-based (paired)
De Koster et al. (2008) Optimal rack dimensions
with random storage policy Probability, optimization Yu and De Koster (2009a)
Optimal rack dimensions with a full turnover-based storage policy
Probability, optimization
Yang et al. (2015)
Optimal rack dimensions considering the acceleration/ deceleration of the crane
Probability, optimization
Hao et al. (2015) Optimal rack dimensions
with IO point at middle Probability, optimization
Operations Planning and Control
Satellite-based Stadtler (1996)
Choice of aisle and lanes, Reservation of resources at order time (aisles, pallets), managing busy period workload
Mixed-integer programming, heuristics
Conveyor-based (paired)
Yu and De Koster (2009b) Optimal zone boundaries for two product classes
Mixed-integer nonlinear programming
Yu and De Koster (2012) Sequencing storage and
retrieval transactions Heuristics Conveyor-based
(single) Zaerpour et al. (2013) Choice of storage strategies
Mixed-integer nonlinear programming,heuristics
3.3
Carousels, Vertical Lift Modules, A-frames
Carousels are automated storage and retrieval systems in which shelves are linked together and rotate in a closed loop. The rotation is either horizontal or vertical (see Figure 9a and 9b). In this system, the picker has a fixed location in front of the system, and the system transports the items to the picker. Carousels are especially suitable for small and mid-size items such as books, health and beauty products (Litvak and Vlasiou 2010). A Vertical Lift Module (VLM) is similar to a carousel, but operates differently. It consists of two columns of trays with a lift-mounted inserter/extractor in the center (see Figure 9c). When an item is needed, the inserter/extractor locates the trays in which the item is stored and brings the tray to the picker, who is located in front of the system, like in a carousel (MHI 2015). The static location of the picker in these systems eliminates the walking aspect of order picking operation (Meller and Klote 2004), which can improve picking productivity. The pickers can also perform other tasks such as packing and labeling or even serving another carousel or VLM while waiting for the carousel to retrieve items.
(a) Horizontal carousel (b) Vertical carousel (c) Vertical lift module Figure 9: Carousels and vertical lift modules (courtesy of Kardex Remstar, Ellis Systems and MHI)
Horizontal carousel models have been extensively studied in the literature dating back to the 1980s when the basic foundation for studying carousals was laid out by Bartholdi III and Platzman (1986). Different aspects have been studied such as storage arrangement, response time, and design issues. Litvak and Vlasiou (2010) give an extensive literature overview on performance evaluation and design of carousel systems. Pazour and Meller (2013) investigate the effect of batch retrieval on the performance of the horizontal carousel system. They show that batching retrievals reduces the cycle time in the carousel by 20% compared to sequential processing. The number of studies on horizontal carousels have declined and the only recent study is by Pazour and Meller (2013). The reason could be that more and more companies are replacing their horizontal carousels with shuttle-based storage and retrieval systems, which we discuss in Section 4. VLMs, on the other hand, have been studied in only a handful of articles. Meller and Klote (2004) develop a throughput model for a single VLM pod. Dukic et al. (2015) extend the research to model the throughput of a dual-tray VLM. Rosi et al. (2016) use simulation to analyze the throughput performance of the single-tray VLM for different design profiles (height and width of VLM) and the lift velocity.
4
Shuttle-Based Single/Double-Deep Storage and Retrieval
Systems
Throughput capacity of AS/R systems is constrained because only one crane is responsible for handling loads at all vertical levels within a given storage aisle. This led to a new generation of automated order picking systems, Autonomous Vehicle-based Storage and Retrieval Systems (AVS/RS), which were first introduced by Savoye Logistics in the 1990s. Such systems are increasingly popular because the required investment is similar to that of AS/R systems, while they offer a much higher retrieval capacity, and are also significantly more flexible in capacity. By using additional shuttles, system capacity can be increased, and by removing shuttles, capacity can be decreased. Typical AVS/R systems use shuttles, which can drive in the x-direction and the y-x-direction on any level in the aisle, and lifts move shuttles (or unit loads) between the levels. In this variant, shuttles can only move horizontally, and rely on lifts for vertical movements. Recently, several robotic solutions have emerged, in which the shuttles (often called robots) have the ability to not only move horizontally but also to elevate up to different tiers by either moving diagonally or vertically (Azadeh et al. 2016). Therefore, the AVS/R system can be classified based on their shuttles’ movement capability into three categories: Horizontal, Vertical, and Diagonal systems (see Figure 2).
4.1
Horizontal AVS/R Systems
The storage area in an AVS/R system consists of aisles with multi-tier storage racks on both sides and a cross-aisle that runs orthogonal to the aisles. To perform storage and retrieval actions, a lift is used for vertical movements between tiers and autonomous vehicles or shuttles are used for the horizontal movements within the tier (Roy 2011). To retrieve a tote, a shuttle moves to the tote’s storage location and picks up the tote, pulls it on board and moves towards the lift for vertical travel. Then the shuttle either hands the tote to the lift (tier-captive system (Heragu et al. 2008)), or uses the lift to move the load to a lower level (tier-to-tier system
(Heragu et al. 2008)) where it is transferred to the pick station by conveyor belt. After picking, the tote again uses the lift and a shuttle to be stored in the system.
Figure 10: AdaptoTMAVS/R system (Source: Vanderlande)
The literature on the horizontal AVS/R systems can be categorized into three categories: System Analysis, Design Optimization, and Operations Planning and Control.
System Analysis: Malmborg (2002) was the first to analyze the AVS/R system. He devel-oped a state equation model to estimate the vehicle utilization and cycle time of the unit-load AVS/RS. He estimates the vehicle cycle time to be (1−α)tSC +αtDC/2, in which tSC and
tDC denote the single-command and dual-command cycle times and α is the proportion of all
cycles that are dual-command cycles. Malmborg (2003a) emphasizes the design advantage of an AVS/R system relative to an AS/R system, which is the ability to adapt the vehicle fleet size in response to the transaction demand. Malmborg (2003b) extends the state equation model by including the number of pending transactions in the state space description, to estimate α, in a system with opportunistic interleaving, i.e. dual-command cycles are used only if storage and retrieval requests are pending in the transaction queue at the time when the cycle is ini-tiated. However, the state equation approach is computationally inefficient for solving large scale problems. Therefore, Kuo et al. (2007) and Fukunari and Malmborg (2008) propose a computationally efficient model to overcome this problem. In this approach, the lift is modeled as a queueing system which is nested within a separate vehicle queueing system. They model the queuing dynamics between vehicles and transactions using an M/G/V queue (with V
ve-hicles), and the dynamics between transactions/vehicles and lift using a G/G/L queue (with
L lifts). The two systems are analyzed iteratively until the performance measures converge. Although the nested queueing approach is computationally efficient, it is not able to model a scenario in which the cycle starts outside of the storage rack, i.e. when loads are received from outside the storage rack. Fukunari and Malmborg (2009) propose a queueing network model as an alternative to address this drawback. They propose a closed-queueing network for esti-mating resource utilization in the AVS/R systems. Although the earlier models are effective in estimating vehicle utilization with reasonable accuracy, they are ineffective in estimating trans-action waiting times. Using a series of queuing approximations, Zhang et al. (2009) address this problem by dynamically choosing among three different queueing approximations, based on the variability of transaction inter-arrival times. This procedure significantly improves the accuracy of transaction waiting time estimates. Recent studies use a semi-open queueing net-work to analyze the performance of the AVS/R system. Roy et al. (2012) build a multi-class SOQN with class switching for a single-tier AVS/RS, and design a decomposition method to estimate system performance. Ekren et al. (2013) model a tier-to-tier AVS/RS as an SOQN and present an analytical approximation by extending the algorithm of Ekren and Heragu (2010a) to estimate the performance measures. Later, Ekren et al. (2014) improved the estimation of the number of transactions waiting in the vehicle queue by developing a matrix-geometric method for the SOQN model. Cai et al. (2014) model a tier-to-tier system as a multi-class multi-stage SOQN, and use matrix-geometric methods to analyze it. Ekren (2011) performs a case study by simulating the performance of a real AVS/RS under pre-defined design scenarios (number of aisles, bays, tiers, and vehicles). He also includes the total cost of the system in his analysis. The number of studies on tier-captive configurations is limited. Heragu et al. (2011), Marchet et al. (2012), and Epp et al. (2017) use the open-queueing network approach to estimate the transaction cycle time of the AVS/R system with tier-captive vehicles. Heragu et al. (2011) then use an existing tool called the Manufacturing Performance Analyzer (MPA) to compare the performance of AVS/R systems and traditional AS/R systems. Ekren (2016) uses simulation to model the system and provide a graph-based solution for performance
evalu-ation of the system (utilizevalu-ation of lifts and the cycle time) under various design configurevalu-ations. Roy et al. (2017) model the system as an integrated queueing network and estimate the cycle time and resource utilization. They model each tier as a semi-open queueing network and the vertical transfer unit as a multi-class queueing network with G/G/1 queues corresponding to each vertical transfer segment. They replace each tier subsystem with a single load-dependent queue, and approximate the first and second moments of inter-departure times using embedded Markov chain analysis. Then they solve the integrated model by capturing the linkage between arrivals and departures in the tier subsystem and the vertical transfer unit. Lerher et al. (2015) and Lerher (2016) develop travel time models for single-deep and double-deep AVS/R systems, respectively. They develop a closed-form expression for the cycle time and consider the effect of shuttle acceleration and deceleration.
Design Optimization: Roy et al. (2012) develop a semi-open queuing network model and optimize the shape of the system. Their results suggest that the layout configuration with depth-to-width ratioD/W = 2 for a system with the lift in the middle (see Figure 4), provides the best system performance. Roy et al. (2015a) extend the model, and show that the end of the aisle is the optimal cross-aisle location for the system. Ekren and Heragu (2010b) provide a simulation-based regression analysis for the rack configuration of the system. In their regression model, the average cycle time is chosen as the output variable, and the input variables are the number of tiers (T), aisles(A) and bays (B). The regression function demonstrates that the cycle time is positively related to T and B, but is negatively related to T ∗A as well as to
T ∗B. Marchet et al. (2013) simulate an AVS/R systems with a tier-captive configuration and illustrate the effect of rack configurations on the throughput performance. By varying the rack configuration and observing the performance impact, they optimize the shape of the system.
Operations Planning and Control: Ekren et al. (2010) develop a simulation-based experimental design to identify the effect of a combination of several input factors (dwell-point policy, scheduling rule, I/O location, and interleaving rule) on the performance of the system (average cycle time, average vehicle, and lift utilization). They investigate the effect of up to four-way interactions of input variables on the performance of the system. Kuo et al. (2008) use
the closed-queueing network approach to investigate the effect of a class-based storage policy on the cycle time of an AVS/R system. They conclude that class-based storage policies can mitigate the cycle time inflation effect of vertical storage, while keeping the space efficiency of the random storage intact. Kumar et al. (2014) simulate an AVS/R system in which the vehicles are captive in vertical zones rather than in tiers. They show that the optimal partitioning of vertical zones can reduce the transaction cycle times by up to 12% compared to the tier-captive configuration. Roy et al. (2012) develop a semi-open queuing network model and analyze the effect of vehicle location, the number of storage zones, and vehicle assignment policies on the performance measures. They show that using multiple zones reduces travel time along the cross-aisle which improves the performance of the system. However, increasing the number of zones beyond a threshold results in longer transaction waiting time and worsens the system performance. Finally, they observe that the most efficient vehicle assignment policy is the random policy. Roy et al. (2015a) extend the model to analyze different dwell-point policies. They shows that the best dwell policy is the L/U point dwell policy. He and Luo (2009) use colored time Petri nets to dynamically model AVS/R systems and established the necessary conditions to have a deadlock-free system. Roy et al. (2014) use a semi-open queueing network to investigate the effect of vehicle blocking within a single tier of the AVS/R system. Their results show that the blocking delays could contribute significantly (up to 20%) to the transaction cycle time. They also show that the percentage of blocking delays goes up as the number of vehicles increases. However, the effect of blocking decreases as the utilization of vehicles increases, since the waiting time to obtain a free vehicle dominates in a system with high vehicle utilization. Roy et al. (2016) come to similar conclusion using a simulation model. Roy et al. (2015b) evaluate congestion effects in a multi-tier AVS/R system. They develop a semi-open queuing network and use a decomposition-based approach to solve it. Their model provides the steady state distribution of the vehicles at the cross-aisles and aisles of each tier, conveyor loops, at the LU point. The model also captures the blocking delays at the cross-aisle and aisle nodes. Zou et al. (2016) investigate a scenario in which the lift and vehicles in the tier-captive AVS/R system are requested to move a load simultaneously rather than sequentially. They model the system
with a fork-join queueing network. They show that the parallel processing policy improves the response time of the system by at least 5.5% compared to the sequential processing policy, for a small-sized systems (system with fewer than ten tiers). In large systems with more than ten tiers and a ratio of aisle length to rack height of more than seven, they find a critical point for the retrieval transaction arrival rate. Before that rate, the parallel processing policy performs better. For arrival rates more than the critical point, the sequential processing policy should be used. Table 3 gives an overview of these papers.
4.2
Vertical and Diagonal AVS/R Systems
In these systems, a single robot can independently roam throughout the storage rack to perform storage and retrieval operations. In a Diagonal system, robots move independently in horizon-tal and “diagonal” directions to access a storage location, while in a Vertical system robots move independently in horizontal and vertical directions inside the rack structure. The Rack RacerTM(see Figure 11a) developed by Fraunhofer IML is an example of a diagonal system.
Perfect PickTMdeveloped by OPEX Corporations is an example of the vertical system. It uses
robots, called iBotTM(see Figure 11b), to perform storage and retrieval actions (Azadeh et al.
2016).
(a) RackRacerTM(Fraunhofer 2014) (b) iBotTM(OPEX 2013) Figure 11: Robots in single-touch systems
The single-touch retrieval process gives the vertical and diagonal system an edge over the horizontal system in terms of flexibility and throughput adjustment. In these systems, the throughput can be adjusted by only deciding on the number of robots in the system. Therefore,
no major overhaul of the system is needed by adding extra lifts. Moreover, maintenance of these systems is easier since a faulty robot can be replaced without affecting operations. In contrast, a failure of an exchange point in horizontal systems could result in a system shutdown. The vertical and diagonal systems seem to be more reliable and flexible than the horizontal ones, however, insufficient studies have been carried out to give a balanced judgment. The diagonal system has not yet studied while the vertical system has been studied in only one paper. Azadeh et al. (2016) models a single aisle of the vertical system using a closed-queueing network. They show that the optimal height-to-width ratio of the system is around one. They propose a recirculating (REC) blocking policy as opposed to the wait-on-spot (WOS) policy and show that the REC policy dominates the WOS policy if the number of robots in the system is large. Finally, they compare the operational performance and costs of vertical and horizontal systems. They show that for systems with one L/U point, the vertical system always produces similar or higher system throughput with lower operational costs compared to the horizontal system with a discrete lift. In the case of two L/U points, the vertical system outperforms horizontal systems with both discrete and continuous lifts.
Table 3 presents an overview of the literature on shuttle-based single/double-deep storage and retrieval systems.
5
Shuttle/Robot-Based Compact Storage Systems
In this section, we discuss variants of the shuttle-based automated compact storage systems. They are adapted for safe and secure handling of a variety of products such as textiles and automobile spare parts and fresh produce. They are categorized into three groups: aisle-based, puzzle-based, and robotic-based systems (see Figure 2).
5.1
Aisle-Based Compact Storage Systems
Crane-based compact storage systems lack flexibility in the volumes they can handle. Shuttle-based compact storage systems, using lifts instead of cranes, have more throughput flexibility
Table 3: Overview of the literature (32 papers) on shuttle-based single/double-deep storage and retrieval system
Research Category System Article Research Issue Methodology
System Analysis
Horizontal (tier-to-tier)
Malmborg (2002), Malmborg (2003a,b)
Estimate vehicle utilization
and cycle time State equation model
Kuo et al. (2007),
Fukunari and Malmborg (2008)
Estimate vehicle utilization
and cycle time Nested queueing model
Fukunari and Malmborg (2009)
Estimate vehicle utilization and cycle time interfacing material flow system
Closed-queueing network
Zhang et al. (2009) Estimate transaction waiting time Variance-based nested queueing model Ekren (2011)
Evaluate performance of a real system under predefined design scenarios
Simulation Ekren et al. (2013),
Ekren et al. (2014), Cai et al. (2014),
Model the system Semi-open queueing network
Horizontal (tier-captive)
Marchet et al. (2012)
Epp et al. (2017) Estimate transaction cycle time Open-queueing network Heragu et al. (2011) Estimate transaction cycle time,
Compare with AS/RS Open-queueing network Lerher et al. (2015)
Lerher (2016) Estimate mean travel time Closed-form solution Ekren (2016) Graph-based solution for
performance evaluation of the system Simulation Roy et al. (2017) Estimate transaction cycle time
and resource utilization
Multi-stage semi-open queueing network Vertical Azadeh et al. (2016) Model and compare a cost-performance
with the horizontal system Closed-queueing network
Design Optimization
Horizontal (single tier)
Roy et al. (2012) Optimal rack configuration Semi-open queueing network Roy et al. (2015a) Optimal cross-aisle
location Semi-open queueing network
Horizontal
(tier-to-teir) Ekren and Heragu (2010b) Optimal rack configuration Simulation-based regression Horizontal
(tier-captive) Marchet et al. (2013)
Optimal rack configuration
of the system Simulation
Vertical Azadeh et al. (2016) Optimize the shape of the system Closed-queueing network
Operations Planning and Control
Horizontal (single tier)
Roy et al. (2012)
Effect of design choices on cycle time and vehicle utilization
Semi-open queueing network Roy et al. (2014) Effect of vehicle blocking on performance Semi-open queueing network Roy et al. (2015a) Optimal dwell-point policy Semi-open queueing network Roy et al. (2016) Effect of vehicle blocking on performance Simulation model
Horizontal (tier-to-tier)
Fukunari et al. (2004) Optimal dwell point location Decision-tree analysis Kuo et al. (2008) Effect of class-based storage
on cycle time Closed-queueing network
He and Luo (2009) Deadlock-free control policy Colored time Petri nets Ekren et al. (2010)
Effect of combination of dwell-point, I/O location, scheduling and interleaving rule on performance
Simulation, ANOVA
Kumar et al. (2014) Optimal partitioning of
vertical zones in the system Simulation Roy et al. (2015b) Congestion effect on
the performance of the system Semi-open queueing network Horizontal
(tier-captive) Zou et al. (2016)
Simultaneously vs sequentially
requesting vehicles and lifts Fork-join queueing network Vertical Azadeh et al. (2016) Effect of blocking on performance Closed-queueing network
by adding or removing shuttles. They consist of multiple tiers of multi-deep storage lanes, each of which holds one type of product (see Figure 12). The loads in a lane are managed using a last-in-first-out (LIFO) policy unless the retrieval is possible from opposite sides.
In such a system, the vertical transfer of loads (usually pallets) across multiple tiers is carried out using lifts, whereas the horizontal transfer of loads within a tier is carried out using shuttles. These shuttles move underneath the loads within each storage lane to store or retrieval the load.
Figure 12: Multi-deep shuttle-based compact storage system (Source: Total Solution Provider Group)
The horizontal movements of shuttles and loads in the system can be carried out either by “specialized” shuttles and a transfer car, or by “generic” shuttles that can move in both horizontal directions without the transfer car. Tappia et al. (2016) model each tier and the vertical transfer mechanism using a multi-class semi-open queuing network and an open queue, respectively. They suggest that generic shuttles may reduce the total travel distance for storage and retrieval operations since additional shuttle movements in the cross-aisle without a load are not required. However, they argue that a specialized shuttle might be attractive from an economic perspective, since a generic shuttle is about twice as expensive as a specialized one. They also show that a single-tier system with a depth/width ratio of around 1.25 minimizes the expected throughput time. Manzini et al. (2016) and D’Antonio et al. (2017) develop alternative travel time models for various layout configurations to estimate the cycle time of the system.
5.2
Puzzle-Based Compact Storage Systems
Gue (2006) shows that the storage density of ak-deep aisle-based system, is less than or equal to 2k/(2k + 1), i.e. 2/3 for a single-deep and 4/5 for a double-deep system. To achieve an absolute maximum storage density, a new concept based on the famous Sam Loyd’s puzzle game has been developed; the 15-slide puzzle (Loyd and Gardner (1959), see Figure 13). The 15-slide puzzle is a game in which 15 numbered tiles slide within a4×4grid, and the objective of the game is to arrange the tiles in the correct numerical sequence, starting from a random initial arrangement.
1
3
2
4
12 14 15 5
13
6
11
9
10 8
7
Figure 13: Sam Loyd’s 15-slide puzzle
The “Puzzle-Based Storage and Retrieval” concept (Gue and Kim 2007), follows a similar idea. A tile represents a tote, pallet, or even a container that is stored in a grid with only one open spot on the grid, which allows a (n−1)/n storage density, where n is the number of cells in the grid. To retrieve a requested unit load, the system repeatedly moves the open locations, which ultimately brings the load to the Input/Output (I/O) point. This is illustrated in Figure 14. I/O Item to Other items Empty cell be retrieved (escort)
I/O I/O I/O I/O I/O
I/O I/O I/O I/O I/O
To retrieve a load, an open location first needs to be moved next to the requested item. Then the open location should be used to move the item to the I/O point. In other words, the open location “escorts” the requested item to the I/O point. An open location is called anescort (Gue and Kim 2007). Several compact storage systems have emerged from the puzzle-based concept in practice and in the literature.
GridStore: Building upon the puzzle-based storage system concept, Gue et al. (2014) propose a high-density storage system for physical goods called GridStore. The system consists of a rectangular grid of square conveyor modules with the capability to move items in the four cardinal directions. The modules can communicate with their neighboring modules as well as with the item they carry. At the south side of the grid, the retrieval conveyor moves products away from the grid. At the north a replenishment conveyor moves products that need to be stored in the grid. Figure 15 illustrates the movement of the items toward the retrieval conveyor. Replenishment conveyor Retrieval conveyor Item to be retrieved Other items Empty cells
Figure 15: Items movements toward the retrieval conveyor in GridStore
GridPick: Based on the GridStore architecture, Uludag (2014) introduces an order picking systems called GridPick. The system is filled with high-density storage containers, without any fixed lanes or aisles; only a few open spots on the grid allow items to move during the retrieval process. The objective of the system is to provide a high order picking rate while minimizing any congestion effects. Unlike the GridStore, items do not leave the grid in the GridPick system. Only containers holding the requested item, move to the edge of the system, called the pick face. The picker picks the items and accumulates the order in a picking cart. There is also a backward movement, away from the pick face, to balance the empty cells in
each row. This balancing rule helps to avoid deadlocks in the system.
Figure 16 illustrates an instance of GridPick. The gray items are not-requested stored items, and the black items are the requested items which are moving toward the pick face. Black circles on top of some gray items are balancing items moving in the opposite direction from the pick station. The numbers on top of the items display the order number for the requested item. The next order for picking is released when all the items from an order have arrived in the pick face of the system. 2 2 1 1 2 2 1 1 1 1 1 2 2 2 1
Figure 16: An instance of the GridPick system
When comparing the GridPick with its equivalent gravity flow rack counterpart, Gue and Uludag (2012) show that the gravity flow rack results in a larger system. Therefore, the average productivity (measured in picks per hour) is higher for smaller orders in the GridPick because it reduces travel. However, as order size increases, walking time of both systems converges to the same number.
Live-Cube Compact Storage: A multi-level system in which each floor is based on a puzzle-based storage architecture is called a Live-Cube storage system (Zaerpour et al. 2017). As illustrated in Figure 17, the essential parts of the system are multiple levels of storage grids, shuttles, lift, and the I/O point. Each level of the system forms a grid-based storage system where shuttles move inx andydirections with the load on top of them. With at least one escort available in each level, the shuttles maneuver the requested item to the lift, which transports the load to the I/O point. The I/O point is usually located at the lower left corner of the system.
GridFlow System: A major drawback of the puzzle-based system is that the physical layout cannot be changed easily. Therefore, the concept of GridFlow is proposed by Furmans
Figure 17: A Live-Cube storage system with lift (Zaerpour et al. 2017)
et al. (2011) to offer a cheaper and a more flexible system. In this system, instead of conveyors, AGVs are used to move the pallets. The use of AGVs instead of conveyors makes the system more flexible with respect to design and throughput changes. Vehicles can form grids of any shape without any additional investment. Figure 18 illustrates the GridFlow system and the vehicle movements in the system.
(a) The system with pallets and vehicles
Vehicle Escort
Moved load unit
(b) Basic movements of the system Figure 18: The GridFlow system (Furmans et al. 2011)
Many system manufacturers are developing puzzle-based systems in different variants. The number of actual implementations and prototypes based on this concept is growing in many different fields, especially in the automated parking systems (e.g. “Park, Swipe, Leave” parking system (Automation Parking System 2016), “Space Parking Optimization Technology” or SPOT (EWECO 2016), Hyundai Integrated Parking System or HIP (Hyundai Elevator Co. LTD. 2016), Wöhr Parksafe (Wöhr 2016)).
Similar to the classification in Section 3.2, the literature on the puzzle-based compact storage systems is classified into three categories: System Analysis, Design Optimization, and Opera-tions Planning and Control.
System Analysis: Gue and Kim (2007) develop an algorithm to find an optimal path to retrieve an item in the puzzle-based system with a single escort positioned at the I/O point. They propose a dynamic programming approach for multiple escorts and a heuristic for larger instances. Their results confirm the intuition that having more escorts shortens the retrieval time. The only exception occurs for smaller systems with many escorts at the I/O point. They also compare the performance of the puzzle-based system with its aisle-based counterpart. They find that aisle-based systems have shorter retrieval times than puzzle-based systems, unless the desired storage density is more than 90%. Kota et al. (2010) extend the analytical model of Gue and Kim (2007) by letting the single escort to be randomly located in the grid. They also develop a model for the system with two escorts, one near the I/O point and one randomly placed on the grid. An integer programming formulation is also provided for the grid populated with any number of escorts. Kota et al. (2015) develop a closed-form expression for the retrieval time in the puzzle-based storage system with a single or two randomly scattered escorts within the grid. They propose a heuristic solution for more than two escorts in the system. Their heuristic gives a near optimal solution, except for the time when free escorts are congested near the edge of the grid. Zaerpour et al. (2017) investigate a multi-tier puzzle-based (live-cube) storage system. They assume sufficient escorts are available at each level so that a virtual aisle can be created (minimum number of escorts is the maximum of the rows and columns in the system). They use traditional methods for the aisle-based system and derive a closed-form formula for expected retrieval time. Zaerpour et al. (2016b) propose a two-class-based storage policy for a live-cube system. They derive closed-form formulas to calculate the expected retrieval time of the system. They conclude that their proposed storage policy can improve the average response time of the system up to 55% compared to the random storage policy, and up to 22% compared to the cuboid two-class-based storage policy.
Design Optimization: Gue et al. (2014) analyze the optimal shape of the GridStore sys-tem. They find that a system with more columns has a higher throughput with the same number of stored items. Zaerpour et al. (2017) propose and solve a mixed-integer-nonlinear model to optimize the dimensions of a live-cube system by minimizing the retrieval time
as-suming a random storage policy. Zaerpour et al. (2016b) extend this work by considering a two class-based storage policy. Their results show that the the optimal dimensions of the system are identical for two class-based and for a random storage policy. Zaerpour et al. (2016a) propose a mixed-integer nonlinear model to optimize the dimensions and zone boundaries of the two-class live-cube storage system by minimizing the response time. Furmans et al. (2011) investigate the design choices for the GridFlow system with one vehicle and one escort. They conclude that putting the I/O point in the middle of the longer side of the grid produces the best performance. Furthermore, they show that the 2:1 aspect ratio results in the lowest retrieval time when the number of storage locations is less than 2000. Their results are not conclusive for larger storage capacities.
Operations Planning and Control: Taylor and Gue (2008) investigate the effect of the distribution of escorts in the puzzle-based system. They examine three choices for the initial location of escorts: 1) near the I/O (located at a lower left corner of the grid), 2) along the diagonal from lower left to upper right, and 3) randomly on the grid. They show that when the number of escorts is above 25%, having the escorts along the diagonal always outperforms the other strategies. The only exception occurs when the storage is based on an ABC policy, in which, random placement for the escorts is the best option. Yu et al. (2017) consider a puzzle-based storage system with multiple escorts, in which multiple loads and escorts are allowed to move simultaneously and in blocks (simultaneous movement of loads in a line). Using integer-programming, they obtain the optimal retrieval time of a single item in the system. Their results show that allowing loads and escorts to move simultaneously and in blocks can save up to 70% in the total number of needed moves to retrieve an item. Mirzaei et al. (2017) propose retrieving multiple items simultaneously. They derive the optimal retrieval time for double-item and triple-item retrieval using enumeration. They propose a heuristic algorithm for more than three simultaneous item retrievals. Their shows that double-item retrieval reduces the storage/retrieval time by on average 17% compared to sequential retrieval. Savings can be further increased by performing multi-item retrievals. Gue et al. (2014) propose a decentralized Assess-Negotiate-Convey control scheme for the GridStore system, in which each conveying cell
can execute the same set of instructions based on its local condition. They also investigate the effect of WIP and the number and distribution of escorts per row, on the throughput. First, they assume that escorts are uniformly distributed in the rows. They show that the throughput increases with an increasing rate with an additional request for medium and low level of WIP in the system. Next, they investigate two additional distribution of escorts: more escorts in the southern row (increasing k) and fewer escorts in the southern row (decreasing k). They show that the distribution of escorts has no effect on the throughput for low level of WIP. The increasing k performs better at low to moderate WIP levels, and all distributions perform equally well at a high level of WIP. Alfieri et al. (2012) investigate the GridFlow system with a limited number of vehicles. They propose a heuristic algorithm to optimize the movement of shelves and to dispatch the AGVs optimally.
5.3
Robot-Based Compact Storage and Retrieval (RCSR) Systems
In RCSR systems, items are stored in a very dense storage block with a grid on top. In each cell of the grid, bins that contain the items are stacked on top of each other and form the storage stacks. The workstations are located at the lowest level next to the storage stacks. Robots in this system are positioned on top of the storage block on the grid. The robots have lifting capabilities, and can extract bins from the storage frames and transport them to the workstations (Zou et al. 2016). AutoStoreTMdeveloped by Hatteland is the first implementation of an RCSR system.
Zou et al. (2016) are the only ones to investigate the RCSR system. They model the system as a semi-open queueing network and compare two storage policies, namely dedicated and shared storage. They show that the dedicated policy results in a shorter throughput time whereas the shared policy has more benefits due to substantial cost savings on the total storage space. They also optimize the shape of the system. They show that for the optimal shape of the system, the width-to-length ratio is around 2/3 (assuming the workstations are evenly distributed at the right and left side of the system) when using random storage stacks, and
(a) Schematics (b) Storage stacks
(c) Robot (d) Workstation
Figure 19: Robot-based compact storage and retrieval system (Source: Hatteland)
slightly larger when using zoned storage racks based on product turnover frequencies. They also investigate the effects of immediate and delayed reshuffling policies. Immediate reshuffling can improve the dual command throughput time.
Table 4 presents the classification of the literature for the shuttle or robot-based compact storage systems.
6
Robotic Mobile Fulfillment Systems
Internet retailers typically have a warehouse with a large assortment of small products. Their demands usually consi