Development of a New Framework for Distributed
Processing of Geospatial Big Data
Angéla Olasz1, Binh Nguyen Thai2, Dániel Kristóf1
1 Department of Geoinformation, Institute of Geodesy, Cartography and Remote Sensing (FÖMI), [email protected], [email protected]
2 Department of Cartography and Geoinformatics, Eötvös Loránd University (ELTE), [email protected]
Abstract
Geospatial technology is still facing a lack of “out of the box” distributed processing solutions which are suitable for the amount and heterogeneity of geodata, and particularly for use cases requiring a rapid response. Moreover, most of the current distributed computing frameworks have important limitations hindering the transparent and flexible control of processing (and/or storage) nodes and control of distribution of data chunks. We investigated the design of distributed processing systems and existing solutions related to Geospatial Big Data. This research area is highly dynamic in terms of new developments and the re-use of existing solutions (that is, the re-use of certain modules to implement further specific developments), with new implementations continuously emerging in areas such as disaster management, environmental monitoring and earth observation. The distributed processing of raster data sets is the focus of this paper, as we believe that the problem of raster data partitioning is far from trivial: a number of tiling and stitching requirements need to be addressed to be able to fulfil the needs of efficient image processing beyond pixel level. We attempt to compare the terms Big Data,
Geospatial Big Data and the traditional Geospatial Data in order to clarify the typical differences, to compare them in terms of storage and processing backgrounds for different data representations and to categorize the common processing systems from the aspect of distributed raster processing. This clarification is necessary due to the fact that they behave differently on the processing side, and particular processing solutions need to be developed
This work is licensed under the Creative Commons Attribution-Non commercial Works 3.0 License. To view a copy of this license, visit http://creativecommons.org/licenses/by-nc-nd/3.0/ or send a letter to Creative Commons, 543 Howard Street, 5th Floor, San Francisco, California, 94105, USA.
according to their characteristics. Furthermore, we compare parallel and distributed computing, taking into account the fact that these are used improperly in several cases. We also briefly assess the widely-known MapReduce paradigm in the context of geospatial applications. The second half of the article reports on a new processing framework initiative, currently at the concept and early development stages, which aims to be capable of processing raster, vector and point cloud data in a distributed IT ecosystem. The developed system is modular, has no limitations on programming language environment, and can execute scripts written in any development language (e.g. Python, R or C#).
Keywords: Distributed computing, Geospatial Big Data, Geo Big Data, Raster data tiling, Data assimilation, Remote sensing data analysis
1. INTRODUCTION
In recent years, distributed computing has reached many areas of computer science, including geographic and remote sensing information systems (Di, 2004; Yang, 2008; Yang et al., 2008; Wang et al., 2015). However, distributed data processing solutions have primarily been focused on processing simple structured documents rather than complex geospatial data. Hence, migrating current algorithms and data management to a distributed processing environment may require a great deal of effort.
The volume and variety of the available data are evolving in an unprecedented way, exceeding the capabilities of traditional algorithm performance and hardware/software environments in terms of data management and computation (Manyika et al., 2011; IDC, 2012; Evans and Hagen, 2013). Higher efficiency is therefore required in order to exploit the available information derived from Geospatial Big Data (Eldawy and Mokbel, 2015; Hoersch, 2016; Doherty, 2016). Consequently, geospatial analysis needs to be reformed to exploit the capabilities of current and emerging computing environments via new data management and processing concepts (Lee and Kang, 2015; Li et al., 2016). In this paper, we focus on the gap between the possibilities offered by current computing capabilities and the available geospatial solutions, in the specific context of the joint processing of big raster, vector and point cloud data sets in a distributed environment. The currently available solutions require highly-trained software engineers (with a geospatial background) to maintain them, and have high levels of complexity. Our goal is to develop a solution for the processing of Geospatial Big Data in a distributed ecosystem which provides an environment for running algorithms, services, various data partitioning strategies and processes, without limitations in terms of programming language or distribution among computational nodes. Our principal motivation is that spatio-temporal data requires an approach to partition and distribution among processing nodes which is different from “ordinary” Big
Data. Our aim is to provide a tool which enables the supervision of data distribution and association according to the type of analysis used. Moreover, we aim to include basic distribution and association strategies for common geospatial analytical tasks. To be able to provide this functionality, further investigation is needed into the common image analysis processes and which distribution techniques are appropriate for these.
In the remainder of this paper, we introduce the relevant definitions, describe the theoretical background to the research and phrase the research challenges in more detail. We include this investigation since it forms a basis for the fundamental decisions involved in our work. For instance, we identified the limitations of existing solutions in terms of data formats, distribution methods and other aspects, and made decisions on the development environment based on these. Following this, the development concept and architectural model is introduced and illustrated. We give a clear description of the problems faced in both the theoretical composition of the framework and the implementation of the modules.
In the last section, we provide an outline of the concept of the implementation in terms of four different aspects. These are as follows: the requirements and intended functionality of the framework, namely the Data Catalogue module; the
Tiling and Stitching module responsible for data distribution (tiling) and association (stitching) between the processing nodes; the Distributed Processing module, with a description of system requirements; and the Data Distribution module. In the final section, we provide some experimental details of an application example focusing on common data access patterns using a case study on the detection of waterlogging. We conclude our paper with an overview of the experience gained through our study, including the challenges faced, related methodology and first results for each focus area, and a description of future goals and implementation plans.
2. PREVIOUS AND RELATED WORK
In the following paragraphs, we present some definitions related to our research for the sake of clarity and common understanding. We provide summaries of the definitions used throughout our work and their existing widely known solutions. This is of particular importance, as their differences in terms of processing characteristics require different approaches during analysis. The difference between the terms “parallel” and “distributed” processing is highlighted, since in many cases their usage is misunderstood or confused. We introduce the definition of distributed geospatial computing and the MapReduce programming model; these methods are included because they are frequently used in the more recent application developments, and because it is essential to take into account their advantages and disadvantages in the area of geoscience. We also share our thoughts about the geospatial scientist’s requirements for a distributed processing
system.
2.1. Definition of Geospatial Big Data
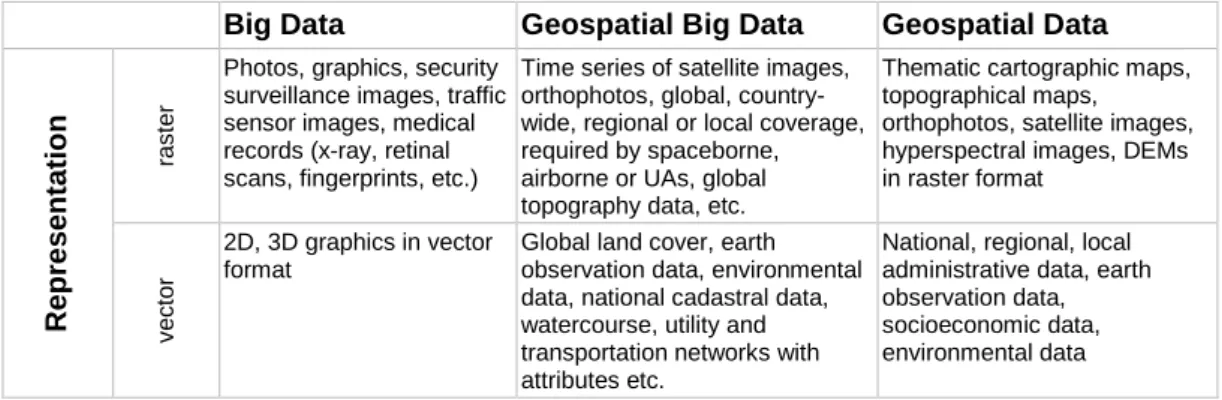
There are many definitions of Geospatial Data (also known as spatial data or geodata, among other terms), depending on the professional background of the author. However, all of these share a unique characteristic: the geographic location of the phenomena is of principal importance. Based on the nature of the digital representation of continuous space, four different data types can be distinguished: vector, raster, point clouds and networks. Of these, the vector and raster representations of Geospatial Data were introduced following the early development of Geospatial Information Systems (Gomarasca, 2009). Due to the developments in information and geospatial technology, we can now have a higher abstraction of representations such as point clouds or graph networks (Karimi, 2014). An additional location-aware data type also examined by GIS analysts is geo-tagged, text-based social media data, which requires a specific approach for collection and processing (Ivan et al., 2017). Like Big Data (Laney, 2001; Jewell et al., 2014; Karimi, 2014; Sivarajah et al., 2016), Geospatial Big Data is defined by its volume, variety and velocity exceeding the capability of spatial computing technology (Lee and Kang, 2015; Li et al., 2016). In Table 1 below, we illustrate the difference between the terms “Big Data”, “Geospatial Big Data” and “Geospatial Data”, in order to clarify what we consider these designations to be. Although some authors introduce numerical limitations for those categories in terms of million instructions per second (MIPS) needed for processing, we refrain from providing exact numbers to distinguish between them. The reason for this is the fuzziness of category margins, which depend on a number of variables such as the amount and variety of processed data, the actual use case, the extent and density of data, and the capabilities of the hardware and software environment, among others. The content of the following table is valid for a user environment with the average computational capacity of 2016.
Table 1: Characteristics of Big Data, Geospatial Big Data and Geospatial Data with a comparison of the most common solutions
Big Data Geospatial Big Data Geospatial Data
Repre se n tatio n ra s te r
Photos, graphics, security surveillance images, traffic sensor images, medical records (x-ray, retinal scans, fingerprints, etc.)
Time series of satellite images, orthophotos, global, country-wide, regional or local coverage, required by spaceborne, airborne or UAs, global topography data, etc.
Thematic cartographic maps, topographical maps, orthophotos, satellite images, hyperspectral images, DEMs in raster format v e c to r 2D, 3D graphics in vector format
Global land cover, earth observation data, environmental data, national cadastral data, watercourse, utility and transportation networks with attributes etc.
National, regional, local administrative data, earth observation data, socioeconomic data, environmental data
p
o
int
c
lou
d 3D scans of objects (in robotics, medical, automotive, art,
archaeology, geology, etc.)
Terrestrial MMS data, LiDAR data,
Classified, filtered point clouds (subset of LiDAR or MMS data) te x t b a s e d Social networks,
comments, text messages, business data, logs, administrative data, sensors text data, transportation/travel/trade data, life science data
Text-based big data
complemented with geolocation, geosocial data, (coordinates, address, geographical names, etc.)
Track logs, coordinates, attributes, indices stored in text files S to rage and p ro c es s ing b ac kgrou n d ra s te
r Wide column store, distributed file system,
Array database/key-value store, RDD, wide column store
OB-RDBMS with extension to raster or traditional file-based image storage processing software
v
e
c
to
r Relational DBMS, wide column store
Distributed file system, relational DBMS complemented with spatial extensions, or wide column store and key-value store with GIS functions
OB-RDBMS p o int c lou
d Key-value store Key-value store, RDD OB-RDBMS with extension to point cloud storage and processing or conventional software solutions te x t b a s e
d Distributed file system, document store DBMS, wide-column store,
Distributed file system, document store DBMS, wide-column store, RDD
Conventional GIS processing applications (often with format conversion) Co mm o n solu tion s ra s te r Apache Accumulo, Cloudera
Rasdaman, SciDB, GeoTrellis, GeoMesa, Geowave operating on the top of various DB-engines
Grass GIS, Saga GIS, Orfeo, OSSIM, gvSIG, QGIS, PostGIS Raster etc.
v e c to r Cassandra, HBase,Distributed file system
Apache Hadoop, Hive, HBase, Accumulo, MongoDB, Neo4j with extension for spatial functions and existing libraries (e.g. MapR)
PostGIS, SpatiaLite, MySQL, QGIS, p o int c lou
d Distributed file system Apache Spark with extension for spatial functions (e.g. Spark LiDAR)
PostGIS, LasTools, rLiDAR, Geo-Plus, Grass GIS- LiDAR Tools te x t b a s e d Cassandra, Cloudera, HBase, Neo4j, CouchDB, MongoDB, Hortonworks, MillWheel
Apache Storm, S4, Spark, Hive Desktop software (GPS tracklog processing etc.)
2.2. Definitions of Parallel Computing
A parallel computing environment may be a single computer with multiple processors. In general, parallel computing infrastructure is located within a setting where several processors are installed in a server rack or separate interconnected servers, with multiple CPUs sharing information with each other, achieved in a shared-memory environment, that is, the processors operate separately but access the same memory resources. The variables, objects and data structures in that environment are accessible to all the processes. The application server sends
requests distributed over small chunks or components, which are concurrently executed on each processor/server. Parallel computation can be grouped into bit-level, instructional bit-level, data and task parallelism. The processes need to be parallelizable workflows, meaning that they must be independent services executed in parallel and processed simultaneously. There is a widely-used classification called Flynn’s taxonomy (Flynn, 1966) where two independent dimensions, namely “Instruction” and “Data”, are distinguished in a multiprocessor computer architecture; both of these have two possible cases: Single or Multiple. Their possible combinations determine four classes: (1) SISD - Single Instruction, Single Data, (2) SIMD - Single Instruction, Multiple Data, (3) MISD - Multiple Instruction, Single Data, (4) MIMD - Multiple Instruction, Multiple Data. SISD corresponds to the conventional mono-processor architecture (the von Neumann computer) where a single data stream is processed by one instruction stream or a single-processor computer where a single instruction is generated by a program. SIMD architecture processors execute the same instruction, and each processing unit can operate on a different data element. This architecture is particularly suitable for graphics and image processing, where a higher level of regularity is represented. In the MISD computing environment, each processor independently executes a different sequence of instructions on the data, and a single data stream is fed into a multiple processing unit. This concept has not been widely used; only one case is known, from Mellon University (1971). MIMD means that each processor has a separate program and operates on different data. Execution can be synchronous or asynchronous. Most of the modern parallel computing environments (such as supercomputers) are based on this logic.
2.3. Distributed Computing
A distributed computing environment is a software and hardware system in which computational and storage components are located on networked computers, which communicate and coordinate their actions by passing messages through “network socket” endpoints within the network. Components interact with each other to achieve a common goal. Three significant characteristics of distributed systems are the concurrency of components, the lack of a global clock and the independent failure of components (Hwang et al., 2011; Lopes and Menascé, 2016). It is clear that a distributed system is a collection of computers within the same network, working together as one larger computer. Network parameters connecting the processing nodes are determinative. Massive computational power and storage capacity have been gained due to this architecture. It should be noted that processes running in a distributed system do not share memory with each other in the same way as parallel computing systems; processes in a distributed system communicate via message queues. Two architectural models are suggested for distributed computing systems (Goldsmith, 2010; Anjomshoa et al., 2015):
The Client-Server model, where clients initiate communication or processing job(s) to the server, which distributes that request(s) to all processing and storage units, if necessary, to do the work and return the results to client. The Peer-to-Peer model, where all units involved in the distributed system act
as a client and server at the same time, with no distinction between client or server processes.
In this environment, the computers can have heterogeneous operating systems, memory sizes, storage sizes, computing capacities etc. The environment allows for different numbers of available processing nodes, in order for the system to be scalable. The number of connected nodes can be increased with the desired volume of the data, or multiple nodes can work on the same job simultaneously; hence, this capability is an appropriate solution for achieving scalability and handling Big Data. If one of the processing nodes is disabled due to a failure, this will not cause the process as a whole to fail.
2.4. Parallel Computing vs. Distributed Computing
We found no clear distinction in the literature between the concepts of parallel and distributed computing, with several studies using these definitions interchangeably. Some studies find that differences in many features can be observed in a number of areas, such as the underlying architecture of memory sharing, the connection interfaces between multiple processes and in higher levels of abstractions of areas in terms of resources and management, functionality, location of services, node architecture etc. (Riesen et al., 1998). Exact distinctions are necessary to create specific operating systems for massively parallel systems and to fully exploit their advantages. The original goal was to use the vacant resources of an existing working environment in the implementation of a distributed computing concept, and to handle the different features of processing nodes by establishing a tightly coupled form of connection. However, in massively parallel computing, there are several restrictions on this. In general, the term ‘parallel’ refers to a memory-shared multiprocessor, whereas distributed refers to multiple private-memory computers, or a geographically distributed network of computers. Distributed computing involves less coupling, and thus better fault tolerance and more availability at the cost of less performance. Hence, there is a trend towards the convergence of parallel computing and distributed computing approaches, whereby a number of workstations are coupled to form a single computer with requirements which overcome those restrictions (Kambatla et al., 2014). Another possible solution consists of workstations integrating with the network interface to access shared memory directly. The appropriate choice of a computer environment to address a given problem is critical in terms of cost, performance and available resources. 2.5. Distributed Geospatial Computing
In the Encyclopedia of GIS, Phil Yang (2008) defines distributed geospatial computing (DGC) as “geospatial computing that resides on multiple computers
connected through computer networks”. Thus, “geospatial computing communicates through wrapping applications, such as web server and web browser”. According to this definition, distributed geospatial computing occurs when geoprocessing is carried out within a distributed computing environment. In the Handbook of Research on Geoinformatics (Karimi, 2009) Yu et al. focus on a multi-agent system with an ontology for performing distributed processing of geospatial data (Yu et al., 2009). The distributed processing of geospatial data is continuously evolving along with the evolution of computer networks, although the details of the historical evolution of DGC are outside the scope of this work. However, one milestone of this evaluation process we would like to emphasize is the issue of Google Earth (https://www.google.com/earth/) in 2004 (and release in 2005) (Rosenberg, 2004; Kilday, 2005), the reason for this being that it had a significant effect on citizens’ everyday life and made geospatial applications extremely popular via wide accessibility. Furthermore, Google’s solutions still lead the processing of massive data sets, along with the development of easy-to-use interfaces (e.g. Google BigTable (Chang et al., 2006)) and also play an important role in open-source community developments. The abovementioned advances catalysed the development of cloud-based solutions, i.e. distributed systems supporting heterogeneous networks and infrastructural background, to exploit the advantages of distributed systems and to provide services on this basis for geospatial computing.
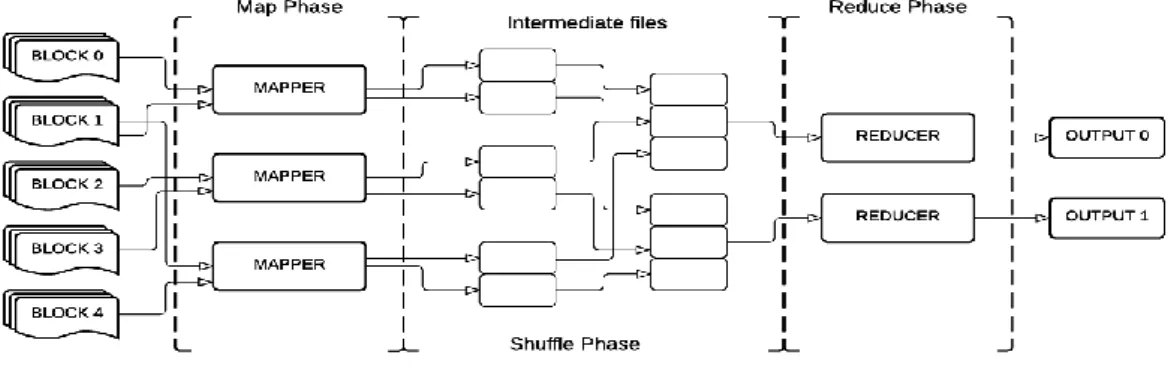
2.6. The MapReduce Model
We include a description of this recent method, which is widely used in Big Data-related research, in order to present the context and to clarify the reasons for our decision to develop a different solution. MapReduce is a programming paradigm and implementation background in a distributed processing environment for handling Big Data problems (Dean and Ghemawat, 2004; Lämmel, 2008; Berlińska and Drozdowski, 2011; Nghiem and Figueira, 2016). The programming model is divided into two phases: “Mapping” and “Reducing”. The “Map” phase is responsible for filtering or sorting data based on given keys, while the “Reduce” phase collects all the partial results and combines them to provide a final result. However, in the context of GIS processing for real applications, the “Map” phase is not fit for purpose. One of the reasons for this is that in most cases, incoming data must be pre-processed and converted into a suitable representation and format to be used by certain algorithms. In order to process data within the “Map” phase, we need to distribute data across processing nodes. However, the MapReduce paradigm was created to handle data that can be partitioned in an arbitrary manner (i.e. text), and does not take into account intrinsic characteristics such spatial dimensions or temporal conditions. For example, a large collection of satellite imagery stored in GeoTIFF files is chunked into a collection of meaningless digital file fragments, with no header and no neighbourhood information. Most of
the image processing methods are pointless in these circumstances (we give a further explanation for this in Section 4.5). In comparison to a calculation of word occurrences in a certain source, for example, the required image processing task involves far more complex solutions. Moreover, the “Reduce” phase, whereby partial results are combined into a consistent set of final results, can be extremely complex when the spatial and temporal characteristics and possible inconsistencies in the partial results are taken into account.
To summarize, the MapReduce model in GIS processing consists of a separate “Map” phase for data pre-processing, distribution and processing, and a “Reduce” phase which is responsible for collecting partial results into the final result(s) and storing them. However, both the currently available “Map” and “Reduce” implementations fail to fulfil the requirements for geospatial data processing. In view of the abovementioned limitations and the lack of available alternative solutions, we introduce IQLib, dedicated specifically to the distribution and processing of geospatial data in a distributed environment.
Figure 1: Framework processing phases in MapReduce (according to Hornung et.al)
2.7. Comparison of Existing Solutions for Raster Data Processing
In a previous study, we collected requirements for distributed processing environments from the user’s perspective, for raster data processing tasks (Olasz et al., 2016). An attempt was made to draw a technical comparison of the existing solutions in terms of the following aspects: GIS data types supported for input and output data, case studies for which the solution has been used, GIS processing tasks (executable scripts) supported, database model (if applicable), processing language supported, data management flexibility, scalability, MapReduce support, operating systems supported, and programming language used in development. Most of the systems in this survey are built on existing systems for text-based Big Data processing; therefore they support their architecture and other programming features. We would like to emphasize that the above information was collected
mainly for the purpose of raster processing; hence, other GIS solutions capable of vector and point cloud processing were not included in the comparison.
Here, we would like to highlight two main aspects that are important as they determine the developed framework. Firstly, support for the execution of existing scripts written in any language is important, since from the user’s point of view it is difficult to rewrite existing geospatial processing scripts and workflows capable of running in distributed way for another language environment. Secondly, the flexibility of data management is crucial, so that the user can have full control over data partitioning and the mechanism of distribution among processing nodes (such as the data partitioning of raster representations in specific formats). In practice, this means that users can specify, for example, the extent and environment for data processing; furthermore, they can specify the distribution method according to the nature of the job. However, it is also reasonable to hide this functionality and to provide default values depending on the use case or level of expertise.
3. INTRODUCTION OF THE NEW DISTRIBUTED PROCESSING FRAMEWORK
3.1. The IQLib Concept
IQLib was initiated by three project partners within the IQmulus project (FP7 research and development project involving a “High-Volume Fusion and Analysis Platform for Geospatial Point Clouds, Coverages and Volumetric Data Sets”;
http://iqmulus.eu). These are the Institute of Geodesy, Cartography and Remote Sensing (FÖMI), Hungary; the Institute for Applied Mathematics and Information Technologies of the National Research Council (CNR-IMATI), Italy; and the Institut National de l’Information Géographique et Forestiere (IGN), France. The main outcome of the project is the IQmulus platform. The consortium-level framework selection was based on a previous study of the most appropriate frameworks satisfying the requirements of the project as a whole (IQmulus Architecture Design, 2015).
During the first two years of development in the IQmulus project, it transpired that some of our GIS services were not compatible with the Hadoop (http://hadoop.apache.org; White, 2012) infrastructure, including the Hadoop File System (Borthakur, 2013), which was selected as a basis for the IQmulus platform by the consortium. Apache Hadoop is a distributed processing framework which allows the processing of large data sets across computer clusters (http://hadoop.apache.org; White, 2012). It contains various core modules which support large data storage (HDFS), job scheduling, resource management (Hadoop YARN), parallel processing using Hadoop MapReduce and several Hadoop-related project products (Cassandra, Spark, HBase, Hive, etc.). The Hadoop File System breaks a file into a set of individual blocks and stores these
blocks in various slave nodes in the Hadoop cluster. HDFS is not concerned with the contents of the file, so the raw files are incomprehensible to humans. HDFS requires information about the predefined block size for Hadoop.
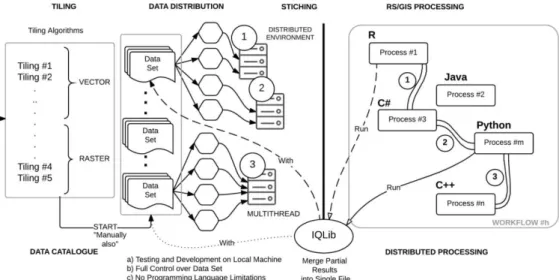
In the development of IQLib, the goal is to implement a new framework which supports various input and output data types (raster, vector and point cloud) independently from Apache Hadoop or any other module based on HDFS. The detailed requirements for IQLib are explained in the following sections. In fact, most current processing frameworks follow the same methodology as Hadoop and utilize the same data storage concept as HDFS. One of the main disadvantages from a processing point of view involves the data partitioning mechanism used by the HDFS file system and the distributed processing programming model. In most cases, the user would like to have full control over the data partitioning and distribution mechanism. Our existing processing services often cannot be redesigned to fit the MapReduce programming model due to the nature of the underlying processing logic. In this paper, we focus on the Data Catalogue module
and the Tiling and Stitching module of the IQLib conceptual framework. Furthermore, emphasis is put on the distribution, processing and association of raster data, and parallel developments in distributed point cloud processing achieved by the other consortium partners (IGN France, CNR-IMATI Italy). Figure 2 describes the architectural concept. In terms of the implementation environment, our future intention is to create a framework supporting distributed processing in R, Python or any other language used for geospatial analysis.
3.2. Introduction of IQLib
In a previous study, we carried out a feasibility study of the technological and conceptual aspects of this system. The outcome was presented in our previous paper (Nguyen Thai and Olasz, 2015), in which we described the architecture of this demo application as well as the processing results of calculating the NDVI (Normalized Difference Vegetation Index) index using Landsat 8 satellite images of Hungary. Since the processing results (in terms of response time) seemed convincing, we began to design and implement the IQLib framework. This framework aims to support the following functionalities:
storing metadata information in different data sets (containing the properties of the data itself, metadata on the distribution and association steps, and also metadata about the processing and tracking of partitioned data chunks among the nodes);
distributing data without limitations and deploying existing processing services on processing nodes;
providing different partitioning methods according to the algorithms used for image processing (for instance, image segmentation or image classification methods); and
executing the processing RS/GIS scripts in parallel.
One of our goals is to provide a data management tool to enable future users to supervise and track where and how their input data is processed and distributed, including the composition of results if required. The main IQLib modules have been designed and developed according to these requirements, and in recent months we have introduced a new module to supplement these concepts. Each module is responsible for one of the four major steps in data processing: Data Catalogue; Tiling and Stitching;Data Distribution; Distributed Processing.
The Data Catalogue module is responsible for storing metadata corresponding to survey areas. A survey area contains all the data sets that are logically related to the inspection area (or area of interest), regardless of their data format and purpose of usage. We aim to store all the available, known and useful information about these data for processing. This module is fully implemented and waiting for final approval.
The Tiling and Stitching module does exactly what its name suggests. Tiling algorithms are usually performed on raw data sets before running a specific processing service. Stitching is generally run after processing services have been successfully completed. Tiling algorithms usually process raw data, after these tiled data have been distributed across processing nodes by the data distribution component. The metadata of the tiled data set are registered in the Data Catalogue module. In this step, the parents and the lineage of tiled data are always known.
The initial conceptual plan is available for this module and the details of the implementation are being planned.
The Data Distribution module distributes data among the nodes and provides features to the users for the supervision of the data distribution, containing the functionality of the predefined distribution methods. This module is fully specified and the conceptual model is available.
The Distributed Processing module is responsible for running processing services on the tiled data set. This module is fully specified, the conceptual model is available and its implementation is ongoing.
All modules are important in the distributed processing and tracking of the lifecycle of the data.
4. IMPLEMENTATION DETAILS OF THE IQLIB MODULAR PROCESSING FRAMEWORK
4.1. Introduction of the Data Catalogue Module
Based on the needs of users and developers, we collected requirements and created a specification document for the data model. The first version of this document contains the specification of the data structures, i.e. how we intend to store metadata so that it is accessible by both users and processing services. Initially, we intended to use Geonetwork (http://geonetwork-opensource.org) for metadata storage; however, as we continued in defining and refining our data model, it became evident that it would be necessary to implement our own metadata store.
4.1.1. Design of the Data Model
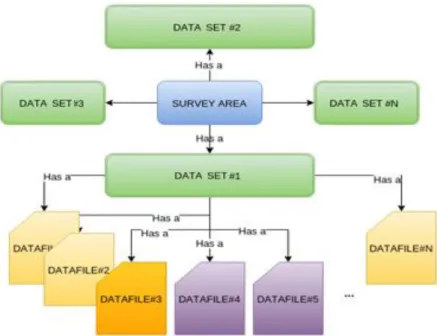
In order to organize our data, we have assembled the most common use cases in data processing along with the existing tiling algorithms. As a result, the following terms need to be introduced: “survey area”, “data set” and “data file”. A survey area
has at least one data set, depending on processing requests. Each data set has at least one data file, which may vary in size and format (Figure 3.)
Processing services access each data file using different strategies depending on their type and content. These strategies are called data access patterns (DAP) (de Smith et al., 2015; Gimond, 2016). Data access patterns can be grouped into different categories based on their locality. These groups are as follows: local (L); focal (F); zonal (Z); a combination of zonal and focal (ZF, a combination of topological and coordinate neighbourhood operations); and global (G). Along with data access patterns, we have also categorized data formats into three groups: Meshes (M), Point Clouds (P) and Raster Data (R). Table 2 shows the relationship between data access patterns and file format groups.
Table 2: Relationship between data access patterns and file groups DAP File
Type
Description
L MPR Each sample is processed independently
F M Requires access to the vertex attributes within a given edge distance N
F R Squared centred window in raster e.g. for convolutions
Z P Requires all data within a given 1D range around one coordinate of the
output vertex
Z MPR Requires all data within a more general given range around the output
vertex (e.g., 1 m spherical neighbourhood) or requires all vertices within an identical attribute.
G MPR Takes the whole file and processes it.
We also store the status of each data file, i.e. whether this is “raw”, “processed”, “tiled” or “buffer-zone”. The “tiled” and “buffer zone” categories are explained in the next section.
4.1.2. Implementation Details
The Data Catalogue module is platform-independent and available for most of the clients. The most convenient solution was to implement a web application providing RESTful web service endpoints, to which client applications can connect and utilize its functionalities. The web application itself should be as simple as possible, meaning that it should be easy to install, maintain and use.
After examining mainstream programming languages and the corresponding frameworks, we decided to use the Java programming language and the Spring MVC framework to implement the Data Catalogue module. For data storage, we considered using a graph database; the main reason for this was the speed of these solutions. The Data Catalogue module will be migrated from a relational database to a graph database when the Tiling and Stitching module is completed; until then, PostgreSQL will be used as the data storage medium.
The web application itself can be deployed on almost any Java application server. For simplicity and testing purposes, we recommend the use of Tomcat as a default application server.
4.1.3. Data Catalogue Module Operations
The Data Catalogue module is available as a standalone processing-oriented application, in which end users may store their metadata and search for them; it is specifically designed for GIS processing. During the design of the data model, we collected the most common usage patterns applied by the IQmulus project partners; the Data Catalogue module will therefore suffice for most users’ needs. One of the
most powerful features of the Data Catalogue module is that users may store their data in a graph structure, meaning that a search for tiles and end results is very fast.
The Data Catalogue module plays a central role in the IQLib processing framework, since all other modules communicate with it and use its services. The tiling and data distribution tasks inform the Data Catalogue module about which data set has been tiled and the location of newly created tiles. The Distributed Processing module also informs the Data Catalogue module about the ongoing processing
tasks on the data set and the location of partial results; later, these partial results are collected into the final result(s) and stored by the Tiling and Stitching module.
Based on the data model specification and technical solutions, two applications have been developed within the Data Catalogue module. One of these is responsible for data collection, and is called the “Data Collector”; the other is responsible for metadata storage and querying, and is called the “Metadata Catalogue”.
The Data Collector is a simple Java application, which can be run on a server where all the data are located or on any set of personal computers containing input data sets. The main goal of this component is to collect all the GIS files recursively within a specified folder and then obtain spatial metadata information on each file. As a result, a JSON metadata file is created containing all the metadata information on each file. This file is both machine- and human-readable; users should therefore only modify the hostname and survey area, as well as the data set to which they wish to add these metadata. At the end, users may upload collected metadata into the Metadata Catalogue.
The Metadata Catalogue is a web application which uses PostgreSQL for data storage. This web interface provides two approaches for applications or users; “external” applications can access its services through the REST API, while users can access its functionalities via a web-based user interface. The user interface itself also uses the REST API as an application. Figure 4 illustrates the architecture of the Data Catalogue module using the previously mentioned two components.
4.2. Tiling and Stitching Module
Tiling and Stitching is a composite module. As a prerequisite to processing large data sets in a distributed manner, the processing services require their input data to be tiled. There are many cases where intermediate or end results need to be stitched together. This step is done by stitching algorithms; these are closely related to the preceding tiling algorithm, and thus an integrated tiling and stitching module takes care of preparing and distributing data for processing services. Based on preliminary user and processing service developer requirements, we propose the following data structures for modelling the tiling aspects. The aim of tiling and stitching is to distribute a raster data set by taking into account the algorithm to be applied; as mentioned before, these algorithms may be local, focal, zonal or global, as commonly used in map algebra methods in GIS and remote sensing applications. The concept is also valid for vector and point cloud data types, but uses different implementation criteria.
4.2.1. Data Model
Firstly, we describe the data structure of a Tile. A Tile is a single area of the original data set; however, from a processing point of view, a set of Tiles does not contain all the necessary information on its neighbours and the surrounding areas. Therefore, we define the data structure in terms of buffering zones. A Buffer zone
is a collection of data around a tile, which can be used in read-only mode by a processing algorithm to edit/process the current tile related to this buffer zone. A
Buffer zone can be empty, for instance when the processing algorithm does not require any data from the area surrounding the tile (e.g. the service algorithm has
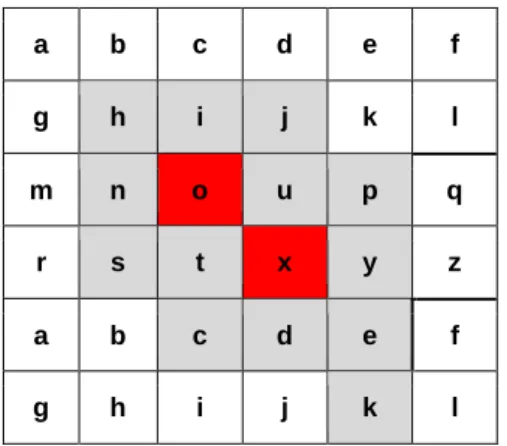
a local data access pattern). Together, a Tile and a Buffer zone form a logical entity called a Patch. A Patch may contain two components, a Tile and its related Buffer zone, depending on the tiling algorithm. As described above, there are some cases where Buffer zones are unnecessary; therefore, a simple Patch has a Tile, whereas a compound Patch contains both a Tile and a Buffer zone. As shown in Figure 5, the red tiles represent the area of interest (‘o’ and ‘x’), and the Buffer zone is represented by the grey tiles (‘h,i,j,n,u,p,q,s,y,c,d,e,k’). Together, the red and grey areas represent a Patch.
Figure 5: Data model logic of the Tiling and Stitching module
a b c d e f g h i j k l m n o u p q r s t x y z a b c d e f g h i j k l
4.2.2. Tiling and Stitching module operations
A tiling algorithm creates Tiles, Buffer zones and the corresponding Patches. After the original data set has been tiled, newly created Patches are registered in the
Data Catalogue module and distributed among processing nodes. Our intention is to provide a useful tool where the user can define both the tiling method for their purpose and the distribution process, if required. For example, independent tiles can be processed in different processing nodes, but dependent patches need to be processed together. The processing logic largely depends on the nature of the applied algorithm and the purpose of processing. A tiling algorithm usually takes three input parameters: the input data set(s) (the location of data files); the data access pattern; and the domain decomposition method (the geometry of the tiles is explicitly given, or additional parameters are provided to help the Tiling algorithm compute the decomposition). Currently, the Tiling and Stitching module supports the distribution of data via the SMB and SFTP protocols.
The IQLib Tiling and Stitching module provides a set of predefined tiling algorithms, developed by IQmulus project partners for service developers. It also supports third-party developers in joining and adding their own tiling algorithms to the system.
4.2.3. Implementation Details
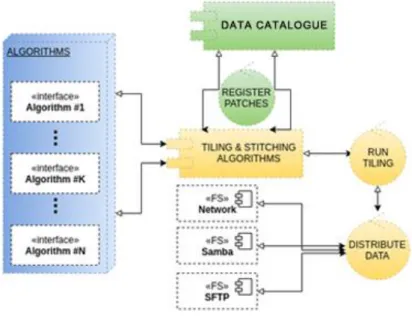
Like the Data Catalogue module, the Tiling and Stitching module is also platform-independent. Our intention was to avoid setting any limitations on Tiling and Stitching algorithm developers in terms of programming language, so that they could use the language they are familiar with (Figure 6).
Figure 6: Architecture of the Tiling and Stitching module.
4.3. Distributed Processing Module
Our system meets the user’s goals if the existing algorithms and scripts are executable in a distributed way, i.e. the system should support their execution without any requiring any further programming or adaptation. Our goal is to support the user and develop a flexible and easy-to-use interface for supervising data processing at a level of granularity which fits the user’s intention. This means putting these tools into the users’ hands, to control the distributed processing if they wish; if not, they are assisted with typical default settings based on the data type and distribution methodology. Within the IQmulus project, the partners have various services that they would like to run on a distributed system using tiled data sets.
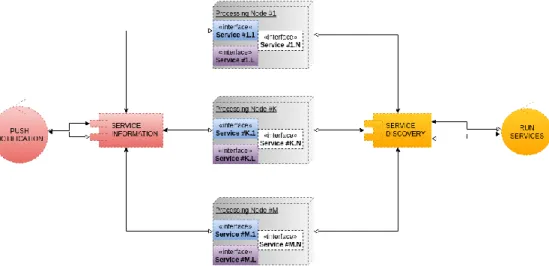
Figure 7: Architecture of the Distributed Processing module
Currently, the Distributed Processing Module is still in the design phase with the following requirements: all services should be easily deployable and maintainable on processing nodes; each processing node should be able to inform users about the currently available and running services; a logging and notification system should be developed for both error and status reports (Figure 7).
4.4. Introduction of the Data Distribution module
In recent months, we have introduced a new module which is intended to carry out the data distribution and data assimilation tasks after performing an analysis of the distributed processing nodes. This module is responsible for supervising the data distribution and provides a tool for users that includes the possible functionality of modifying the distribution. Our intention is to provide the available distribution methods as a default for the most widely used image processing tasks; however, we also take into account the further possibility of change. In the near future we intend to create an architectural concept for this module.
4.5. Example Application
As an example of a theoretical application, we describe a use case inspired by real life. The goal is the detection of buildings across an entire country, based on visible and near-infrared digital aerial imagery, a digital surface model (DSM) and a digital elevation model (DEM). The imagery is stored in collections of GeoTIFF files according to yearly survey areas, with a size of between several hundreds of gigabytes and terabytes. The DSM is stored in LAS point clouds with different tiling,
summing up the volume of the data similar to imagery (or even bigger). The geospatial processing scheme is as follows:
1. Calculate spectral indices and perform masking of possible built-up areas based on thresholds;
2. Calculate relative heights based on DSM and DEM, to perform masking based on height;
3. Carry out image segmentation on possible (pre-filtered) built-up areas; 4. Integrate spectral indices and relative heights into image segments
(building candidates);
5. Carry out further filtering and iterative refinement based on the above information;
6. Provide final building outlines as a single vector layer.
During execution in the IQLib framework, the physical location and metadata of all data sets are registered in the Data Catalogue module. Then, the details of each processing step are taken into account to determine the tiling and distribution strategies. For instance, the calculation of spectral indices, calculation of relative heights and masking are local algorithms, and can therefore be run on non-overlapping, arbitrary chunks. However, segmentation is a zonal procedure requiring neighbourhood information, and the best strategy is therefore to use overlapping chunks, with the overlap determined by the reasonable building size. Stitching is then easy and straightforward for the local methods. However, segmentation will find the same building several times, and this is likely to be in a slightly different way in overlapping chunks. These multiple representations must then be merged into the same object during stitching. All these rules are described and registered in the Data Catalogue module along with the data, and are used during processing. Then, the distribution of data among the processing nodes is carried out by the Data Distribution module, according to the logic contained in the
Data Catalogue module. The Distributed Processing module takes care of execution and timing, taking into account the logical order of processing steps and the input and output needs of each step in the workflow. Each processing step is registered in the Data Catalogue module for each data partition. Finally, the result is stitched together by the Tiling and Stitching module by reversing the Tiling step, as recorded in the Data Catalogue module.
5. CONCLUSIONS AND FUTURE WORK 5.1. Conclusion
In this paper, we study the existing distributed processing ecosystem for handling Big Geospatial Data. We find this research area to be very active in terms of the review, development and usage of existing solutions, with many implementations for predefined specific cases and application areas such as disaster management,
environmental monitoring, and earth observation data analysis and distribution. We attempt to compare the terms Big Data, Geospatial Big Data and Geospatial Data, in order to clarify the possible differences, to compare them in terms of storage and processing background for different data representations, and to collect and categorize the existing common solutions. Furthermore, we compare the characteristics of parallel and distributed computing, and include our thoughts on the MapReduce paradigm in a geospatial context. The second part of the paper provides an overview of our previous work and the implementation details of a new framework called IQLib. We introduce the main motivations leading to the decision to implement a new framework rather than using an existing solution. The main modules are introduced and briefly described, along with their technical implementation. Of these, the Data Catalogue module is currently at the highest level of implementation; hence, we provide details of the data model and data access patterns.
IQLib documentation, including the tiling and stitching methods and the Data Catalogue module,is available on Github at https://github.com/posseidon/iqlib. We have decided not to publish the source code of the Data Catalogue module until it has been reviewed and finalized by the IQmulus partners. However, the RESTFUL API is available on Heroku cloud infrastructure for all to test; feedback and suggestions are welcome and should be submitted at http://iqlib.herokuapp.com. 5.2. Future Developments
In future work, we intend to focus on further development of the framework and the processing executables for spatial analysis and the experimental benchmarking of throughput. The finalization of the Data Catalogue module and installation for testing will be completed shortly. As a next step, we intend to focus on the
Distributed Processing module and GIS raster processing scripts. Existing algorithms will be used, with minor changes, to enable running in a distributed environment. Furthermore, testing of IQlib is planned, using the following steps:
Running existing algorithms on the framework (Python, R, etc.). This means collecting and investigating raster processing algorithms for distributed processing.
Experimental execution on Big Geospatial Data (raster, vector, point cloud). We intend to create a collection of Big Geospatial Data from various sources and of different data types, to be loaded into our Data Catalogue module using their complex metadata. Tests will also be applied to algorithms in the collection.
Benchmarking (in terms of processing time). We will first establish a case study to benchmark the available non-distributed open-source and commercial frameworks. The measurement mechanism focuses on processing time. During the establishment of the benchmark, we take into account Amdahl´s law (Amdahl, 1967) which enables us to calculate the
theoretic speedup of parallelization of an algorithm to get idea where can be applied optimization. We will further investigate on the parallelization paradigms and other speed up models, together with the distribution methods for certain raster processing.
Acknowledgements
This research was co-funded by the “IQmulus” project (a High-volume Fusion and Analysis Platform for Geospatial Point Clouds, Coverages and Volumetric Data Sets) funded by the 7th Framework Programme of the European Commission, call identifier FP7-ICT-2011-8. The research was also supported by the Hungarian Institute of Geodesy, Cartography and Remote Sensing (FÖMI). We would like to thank Michela Spagnuolo, Research Director of the Institute for Applied Mathematics and Information Technologies (CNR-IMATI) for her huge efforts in creating opportunities as well as support for IQLib. We also would like to thank the thorough work and constructive remarks of our three anonymous reviewers, which greatly helped in improving our original draft.
REFERENCES
Amdahl, G.M. (1967). Validity of the Single Processor Approach to Achieving Large Scale Computing Capabilities, Proceedings of the April 18-20, 1967, Spring Joint Computer Conference, at http://doi.acm.org/10.1145/1465482.1465560, [accessed 27 March 2017].
Anjomshoa, M., M. Salleh and M. Pouryazdan (2015). A Taxonomy and Survey of Distributed Computing Systems, Journal of Applied Sciences, 15(1): 46–57.
Berlińska, J. and M. Drozdowski (2011). Scheduling divisible MapReduce computations, Journal of Parallel and Distributed Computing, 71(3): 450–459
Borthakur, D. (2013). Hadoop Distributed File System Architecture Guide, at https://hadoop.apache.org/docs/r1.2.1/hdfs_design.html, [accessed 24 March 2017].
Chang, F., Dean, J., Ghemawat, S., Hsieh C., W., Wallach, D., Burrows, A.M., Chandra, T., Fikes, A. and Gruber, R. (2006). Bigtable: A Distributed Storage System for Structured Data, Proceedings of the Seventh Symposium on Operating Systems Design & Implementation (OSDI’06) November 6-8, 2006 Seattle WA, USA.
Dean, J. and S. Ghemawat (2004). MapReduce: Simplifed Data Processing on Large Clusters, Proceedings of the Sixth Symposium on Operating Systems
Design & Implementation (OSDI’04) December 6-8, 2004 San Francisco CA, USA, : 137–150.
Di, L. (2004). Distributed Geospatial Information Services-Architectures, Standards, and Research Issues, Proceedings of The International Archives of the Photogrammetry, Remote Sensing and Spatial Information Sciences, Vol.XXXV: 187–193.
Doherty M. (2016). Copernicus: A Game Changer in Earth Observation, presented at the Conference of Integrated Space Technology Applications for Climate Change, Graz, Austria, September 2016.
Eldawy, A. and F.M. Mokbel (2015). The Era of Big Spatial Data: A Survey,
Proceedings of the International Workshop of Cloud Data Management CloudDM 2015, co-located with IEEE ICDE 2015.
Evans, H. and C. Hagen (2013). Big Data and the Creative Destruction of Today’s
Business Models, A.T. Kearney, Inc.USA
Flynn, M.J. (1966). Very high-speed computing systems, Proceedings of the IEEE, 54(12): 1901–1909.
Gimond, M. (2016). Lecture notes for Introduction to GIS and Spatial Analysis,
USA Colby College. https://mgimond.github.io/Spatial/index.html [Accessed 12 May 2016]
Goldsmith, B.C. (2010). "Distributed computing and communication in peer-to-peer networks, PhD Thesis at the University of Tasmania, Australia. 166,
Gomarasca, M.A. (2009). Basics of Geomatics, Dordrecht: Springer Science+Business Media B.V. DOI 10.1007/978-1-4020-9014-1
Hoersch B. (2016). The Copernicus Programme - a Game Changer in Earth Observation, presented at the 36th EARSeL Symposium, Bonn, Germany, Hornung T., M. Przyjaciel-Zablocki, and A. Schätzle (2016). Giant Data: MapReduce and Hadoop, at
http://www.admin-magazine.com/HPC/Articles/MapReduce-and-Hadoop [Accessed 12 May 2016]
Hwang, K., C.G. Fox and J.J. Dongarra (2011). Distributed and Cloud Computing: From Parallel Processing to the Internet of Things, Amsterdam, Netherlands: Morgan Kaufmann.
IDC (2012). Big Data in 2020, IDC iView Report at https://www.emc.com/leadership/digital-universe/2012iview/index.htm [Accessed 12 May 2016]
Igor I., A. Singleton, J. Horák and T. Inspektor (2017). The Rise of Big Spatial Data, Springer International Publishing.
IQmulus project introduction and implementation details, at http://www.iqmulus.eu [Accessed 12 June 2016].
Jewell, D., R. Dobelin Barros, S. Diederichs, L.M. Duijvestijn and M. Hammersley (2014). Performance and Capacity Implications for Big Data, IBM Corporation, International Technical Support Organization.
Kambatla, K., G. Kollias, V. Kumar and A. Grama (2014). Trends in big data analytics, Journal of Parallel and Distributed Computing, 74(7): 2561–2573.
Karimi, H.A. (2009). Handbook of Research on Geoinformatics, IGI Global.
Karimi, H.A. (2014). Big Data Techniques and Technologies in Geoinformatics, CRC Press, Taylor & Francis Group, LLC.
Kilday B., “Cover the earth,” Official Google Blog/Google Inc., 28-Jun-2005. https://googleblog.blogspot.hu/2005/06/cover-earth.html [Accessed 12 May 2016] Lämmel, R. (2008). Google’s MapReduce programming model — Revisited,
Science of Computer Programming, 70(1): 1–30.
Laney, D. (2001). 3D Data Management: Controlling Data Volume, Velocity, and Variety, Application Delivery Strategies, META Group, at http://blogs.gartner.com/doug-laney/files/2012/01/ad949-3D-Data-Management-Controlling-Data-Volume-Velocity-and-Variety.pdf [accessed 25 January 2017]. Lee, J.-G. and M. Kang (2015). Geospatial Big Data: Challenges and Opportunities,
Big Data Research, 2(2): 74–81.
Li, S., S. Dragicevic, F.A. Castro, M. Sester, S. Winter, A. Coltekin, C. Pettit, B. Jiang, J. Haworth, A. Stein and T. Cheng (2016). Geospatial big data handling theory and methods: A review and research challenges, ISPRS Journal of Photogrammetry and Remote Sensing, 115: 119–133.
Lopes, R.V. and Menascé D. (2016). A Taxonomy of Job Scheduling on Distributed Computing Systems, IEEE Transactions on Parallel and Distributed Systems, 27(12): 3412–3428.
Manyika, J., Chui, M., Brown, B., Bughin, J., Dobbs, R., Roxburgh C. and Byers A.H. (2011). Big data: The next frontier for innovation, competition, and productivity, McKinsey & Company.
Nghiem, P.P. and Figueira S.M. (2016). Towards efficient resource provisioning in MapReduce, Journal of Parallel and Distributed Computing, 95: 29–41.
Nguyen Thai, B. and Olasz A. (2015). Raster data partitioning for supporting distributed GIS processing, The International Archives of the Photogrammetry, Remote Sensing and Spatial Information Sciences, Volume XL-3/W3: 543–551.
Olasz, A., Nguyen Thai B. and D. Kristóf (2016). A New Initiative for Tiling, Stitching and Processing Geospatial Big Data in Distributed Computing Environments,
ISPRS Ann. Photogramm. Remote Sens. Spatial Inf. Sci., III-4: 111–118.
Riesen, R., Brightwell R. and Maccabe A.B. (1998). Differences Between Distributed and Parallel Systems, Technical report. Albuquerque, New Mexico. digital.library.unt.edu/ark:/67531/metadc626693/m1/1 [Accessed 7 August, 2017] Rosenberg J., (2004) “Power of 2,” Official Google Blog / Google Inc., 27 Oct.2004. https://googleblog.blogspot.com/2004/10/power-of-2.html [Accessed 7 August, 2017]
Sivarajah, U., M.M. Kamal, Z. Irani and V. Weerakkody (2016). Critical analysis of Big Data challenges and analytical methods, Journal of Business Research, 70: 263–286.
Smith J., M. de, Goodchild M. F. and Longley A. P.. (2015). Grid Operations and Map Algebra, Geospatial Analysis - A comprehensive guide to Principles, Techniques and Software Tools. Geospatial Analysis - 5th Edition, 2015.pp 748
http://www.spatialanalysisonline.com/HTML/?operations_on_single_and_multi.ht m [Accessed 7 August, 2017]
Wang, C., F. Hu, X. Hu, S. Zhao, W. Wen and C. Yang (2015). A Hadoop-based distributed framework for efficient managing and processing Big Remote Sensing Images, ISPRS Annals of Photogrammetry, Remote Sensing and Spatial Information Sciences, II-4-W2: 63–66.
White, T. (2012). Hadoop: The Definitive Guide, Sebastopol, CA: O’Reilly Media,
Inc. USA
Yang, C., W. Li, J. Xie and B. Zhou (2008). Distributed geospatial information processing: sharing distributed geospatial resources to support Digital Earth,
Yang, C.P. (2008). Distributed Geospatial Computing (DGC), in Shekhar, S. and H. Xiong (Eds.). Encyclopedia of GIS, Boston, MA: Springer US, pp. 246–249.
Yu, G., L. Di, W. Yang, P. Zhao and P. Yue (2009). Multiagent Systems for Distributed Geospatial Modeling, Simulation and Computing, in Handbook of Research on Geoinformatics, University of Pittsburgh, USA, Idea Group Publication, pp. 196–204.