Master thesis
Efficiency drivers in microfinance institutions
By
Erlend Meberg & Mirsad Krpo
The master thesis is carried out as a part of the education at University of Agder and is therefore approved as such. However, this does not imply that the University answers for the methods that are used or the conclusions that are drawn.
Supervisor: Roy Mersland
The University of Agder, Kristiansand
II
ABSTRACT
This study attempts to identify drivers for efficiency in Micro Finance Institutions (MFIs) and determine their effect on the overall cost-efficiency of MFIs. The study used cross sectional data of 377 MFIs from 74 countries. Multivariate regression analysis was applied in order to find the results. Operational expense to portfolio, operational expense to assets and cost per credit client were used as efficiency measurements, 13 hypotheses were proposed and 17 variables were studied. Our results revealed that all except for two variables had a significant effect on one or more of the efficiency measurements. Credit officer productivity, cost per employee, loan outstanding average and credit officer ratio had a strong significant effect on all measurements. Our findings suggest that MFIs should increase their credit officer
productivity and decrease the personnel expenses per employee in order to increase the overall cost-efficiency. Moreover, the MFIs should put more of their staff into income generating activities. Our findings also indicate that the MFIs should focus on more cost-efficient operations to avoid increased average loan amount and mission drift. Performance pay had no significant effect on the MFIs overall efficiency, which indicates that the MFIs incentive schemes motivate other performance measures than cost-efficiency. Modified incentives schemes should be considered to improve the cost-efficiency of MFIs.
III
ACKNOWLEDGEMENT
We would like to express profound gratitude to our advisor, Phd Roy Mersland, for his invaluable support, encouragement, supervision and useful suggestions throughout this thesis. His moral support and continuous guidance enabled us to complete our work successfully. We are also highly thankful to professor Jochen Jungeilges, for much appreciated advices
concerning our statistical work.
Special appreciation goes to my parents, Mustafa and Indira Krpo for their love, support and assistance throughout my life and study. I wish to say a big thank you to my sister Aida and my grandmother Zehra Cupina for being there whenever I needed them.
Mirsad Krpo
I would like to thank my mother Eva, and my father Jarl Andre, for their love and support throughout my life and study. I also wish to thank my brothers, Steffen and Nicolai for their friendship and for our close relation. I am as ever, especially indebted to Elisabeth for her love and inspiration. Thanks for holding out with me finish this thesis. Finally, I want to dedicate this thesis to the very most precious, my son Theodor.
IV
TABLE OF CONTENTS
ABSTRACT ...II ACKNOWLEDGEMENT ... III TABLE OF CONTENTS ... IV LIST OF TABLES ... VI LIST OF FIGURES...VII LIST OF ABBREVATIONS ... VIII1.1 Motivation ... 1
1.2 Main objective of the study ... 3
1.3 Structure... 3
2. A MICROFINANCE OVERVIEW ... 5
2.1 The concept of microfinance... 5
2.2 Microfinance clients ... 6
2.3 Providers of microfinance ... 7
2.4 Products and services... 8
2.5 The outreach and impact of microfinance ... 11
3. EFFICIENCY THEORY AND HYPOTHESIS ... 13
3.1 Efficiency theory... 13
3.2 Efficiency in MFIs... 15
3.3 Measuring efficiency ... 17
3.4 Efficiency drivers, hypotheses and variables presentation... 19
4. RESEARCH METHODOLOGY ... 31
4.1 Research Method ... 31
4.2 Data collection Method... 32
4.3 Sample ... 33
4.4 Model presentation... 35
4.5 Data analyzing tools ... 37
V
5.1 Regression diagnostics ... 39
5.2 Descriptive statistics... 48
5.3 Regression results and discussion ... 56
5.4 Additional analyses and robustness checks ... 67
5.5 Summary of the models ... 73
6. CONCLUSIONS, IMPLICATIONS AND NEED FOR NEW RESEARCH EFFORTS ... 74
VI
LIST OF TABLES
Chapter twoTable 2-1: Highlights from 891 MFIs ... 11
Chapter three Table 3-1: Variables summary ... 30
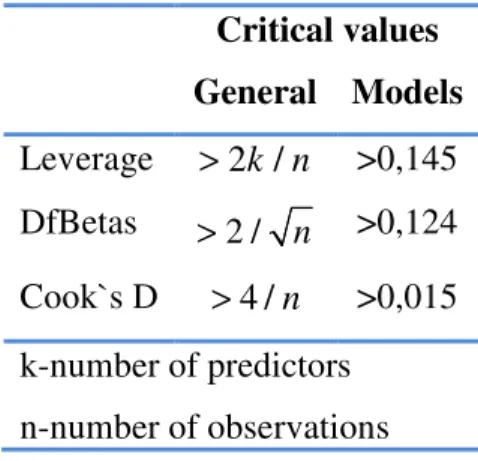
Chapter five Table 5-1: Critical values for unusual and influential data ... 40
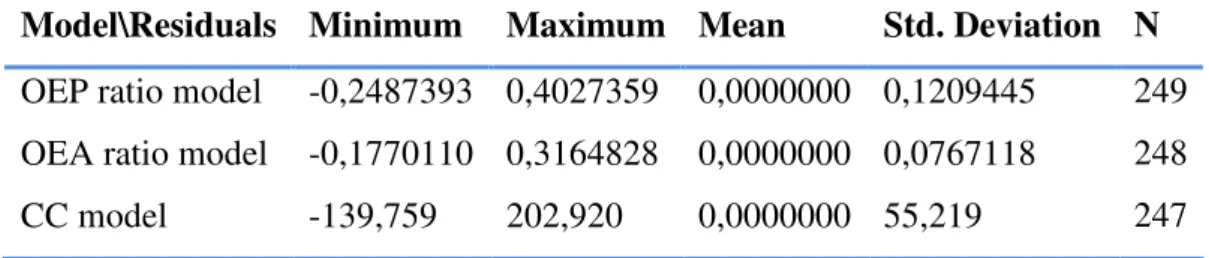
Table 5-2: Descriptive statics for the model residuals ... 41
Table 5-3: Serial correlation... 41
Table 5-4: Heteroskedasticity in the OLS models ... 42
Table 5-5: Heteroskedasticity in the WLS models... 44
Table 5-6: Critical values for detecting multicollinearity ... 44
Table 5-7: Skewness and kurtosis of the residuals... 46
Table 5-8: Kolmogorov-Smirnov test for the OLS models... 46
Table 5-9: Skewness and kurtosis of the residuals from the transformed models ... 47
Table 5-10: Kolmogorov-Smirnov test for the transformed models... 47
Table 5-11: Descriptive statistics for the dependent and independent variables ... 48
Table 5-12: Regression results from the OEP ratio model... 59
Table 5-13: Regression results from the OEA ratio model ... 64
Table 5-14: Regression results from the CC model ... 65
Table 5-15: Only significant variables from the initial regression models are included ... 68
Table 5-16: Regression results of the Weighted Least Squared models ... 69
Table 5-17: Regression results of the transformed models ... 70
Table 5-18: Regression results from OLS models with data from year -1 ... 71
VII
LIST OF FIGURES
Chapter twoFigure 2-1 Providers of microfinance services ... 7
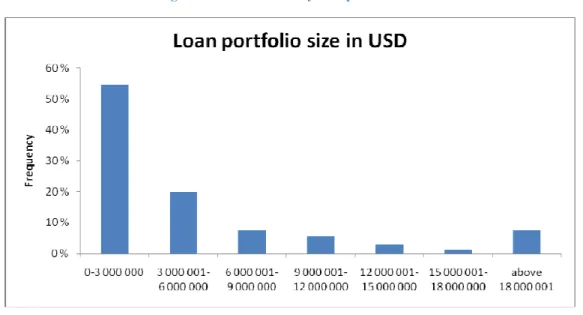
Chapter four Figure 4-1: MFIs sorted by loan portfolio size ... 34
Figure 4-2: MFIs sorted by regions... 34
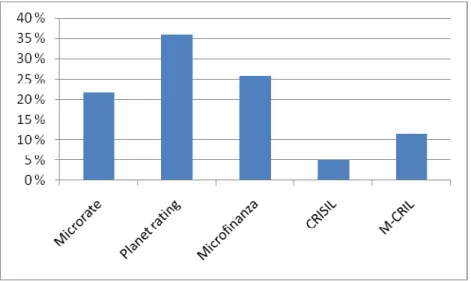
Figure 4-3: MFIs sorted by rating agencies ... 35
Chapter five Figure 5-1: Variance of the residuals for the OEP ratio model... 43
Figure 5-2: Distribution of the residuals from the OEA ratio model ... 45
Figure 5-3: Distribution of the residuals from the transformed OEA ratio model... 47
Figure 5-4: Frequency of the OEP ratios and the transformed OEP ratios ... 50
Figure 5-5: Frequency of the OEA ratio and the transformed OEA ratio... 50
Figure 5-6: Frequency of the costs per client and the transformed cost per client ... 51
Figure 5-7: Frequency of the credit officer productivity... 51
Figure 5-8: Frequency of the market competition... 52
Figure 5-9: Frequency of the MFIs age... 53
Figure 5-10: Frequency of the costs per employee ... 54
Figure 5-11: Frequency of the average outstanding loan amounts ... 54
Figure 5-12: Frequency of the credit officer ratios ... 55
VIII
LIST OF ABBREVATIONS
CC - Cost per Credit client
CE - Cost per Employee
CGAP - Consultive Group to Assist the Poor COProd - Credit Officer Productivity
CO - Credit Officer Ratio
EECA - Eastern Europe and Central Asia
IL - Individual Lending
LA - Latin America
LOA - Loan Outstanding Average
MC - Market Competition
MENA - Middle East and North Africa MFI - Microfinance Institutions
MIX - Microfinance Information Exchange, Inc OEA - Operating Expense to Assets
OEP - Operating Expense to Portfolio OLS - Ordinary Least Squared
p.a - per annum
PerP - Performance Pay PureFS - Pure Financial Service
SG - Solidarity Groups
UaR - Urban and Rural USD - United States Dollar
VB - Village Banking
1
1. INTRODUCTION
1.1MOTIVATION
As microfinance has developed from being small and narrow donor dependent activity into becoming an industry, more focus has been put on the need for efficient operations
(Baumann, 2004; Hermes, Lensink, & Meesters, 2008; Qayyum, 2006). There is a
proliferated knowledge about the problems of inefficiency in the microfinance industry, and many MFIs strive to increase their efficiency. However, few studies are actually testing whether the efficiency drivers, as claimed by the literature, have a significant effect on the overall efficiency of MFIs. This thesis responds to the need for more knowledge of what is affecting the MFIs overall efficiency, focusing on operational costs.
MFIs are characterized by its dual mission of serving the poor and also being financial sustainable (Begona Gutiérrez-Nieto, Serrano-Cinca, & Mar Molinero, 2007c
; Helms, 2006).They promote financial services to poor and low income people who are often ignored by commercial banks and other lending institutions, even though poor and low income people tend to have promising investments ideas than can be profitable(Gateway, 2009; Hollis & Sweetman, 1998; Ledgerwood, 1998; Robinson, 2001). This is due to the fact that poor people often have little or no collateral to back up the loan (Ledgerwood, 1998). Microcredit Summits (2007) annual report estimated that about 133 million credit clients are served worldwide and the number is increasing rapidly. Yet, only a fraction of the need is covered. It is estimated that about 3 billion people would benefit from microfinance services(Helms, 2006).
Microfinance institutions are improving the every-day life for millions of people around the world, and it has in the latest years been fronted as the “silver bullet” in the fight against poverty (Karnani, 2008) At the same time, being self-sustainable is a major challenge in the industry and many of the MFIs are depending on donors(R Mersland & Strøm, 2008a). Many argue that depending on donations is only a short-term solution and MFIs can only exist in the long run, providing beneficial financial services to the poor, if the MFIs can liberate from donors and become self-sustainable (Arsyad, 2005; Maddison, 2006). A recent study of 704 MFIs conducted by the Microbanking Bulletin (2007) reveals that 41% are not financially self-sustainable and rely on donor support. The microfinance industry is far from being “donor free”, and some might argue that it never will be. Regardless of having a donor
2 dependent industry or not, present donors still want to know that resources are used in an efficient way. Efficient use of resources and focus on efficiency in MFIs is important to obtain self-sustainability and become independent from donors. Increased competition among MFIs is also starting to force efficiency higher up on the agenda. Additionally, commercial banks have become more interested in providing microfinance services due to the high levels of profitability among some MFIs in the recent years (Hermes, et al., 2008). Rhyne and Otero (2006) state that MFIs have to increase their efficiency in order to remain in business.
Another reason to focus on efficiency can be found in Mersland and Strøm (2008a). They suggest that cost efficient MFIs are needed to avoid mission drift. Increasing profit leads to an increase in average loan size which crowds out poorer clients, leading to mission drift
(Freixas & Rochet, 2008). If an MFI increases cost-efficiency more than average profit, we should not expect mission drift (R Mersland & Strøm, 2008a). Nieto et.al (2007c
)find in their analyses that the majority of socially efficient MFIs are also financially efficient. In other words, MFIs focusing on social objectives should also focus on financial efficiency.
Providing small financial services involve high transaction costs in terms of screening, monitoring and administrative costs (Hulme & Mosley, 1996). MFIs seeking financial sustainable operations have to charge high interest rates to cover the extra costs providing small loan amounts (CGAP, 2009c), which are far from being competitive against interest rates in commercial banks. The average cost of credit in developing countries is still much higher than in developed countries. Yet, what is more important than being competitive, is that poor and low income people would benefit from a less expensive credit. Gonzalez (2007) reports that operational costs represent about 2/3 of charges to borrowers. Since operational costs are the largest component of interest rates, attention should be emphasized towards identifying their drivers and quantifying them in order to improve efficiency in MFIs. To demonstrate why a focus on efficiency and operational costs is important regarding the loan rate, we are presenting the loan rate R as a function of profit, deposit rate and administrative costs. Building upon Hulme and Mosley (1996, p. 19), the MFIs profit function may be written:
π = (R−D )−
∑
(
R pj+aj)
∑
Xj3 where R is 1+ the loan rate; D is 1+the deposit rate,
j p
is the default rate; j
a is administrative costs; and
j X
is the loan number j. The last sum is the MFIs loan portfolio.
Solving for the loan rate, we find that the loan rate is a function of profit, deposit rate and administrative costs: j j j j j Σa π D R= + + ΣX (1-Σp ) (1-Σp ) (1-Σp )
It is reasonable to assume that profit seeking will lead to mission drift, hence increased profit is not preferred on behalf of higher loan rate (R Mersland & Strøm, 2008a). We can also assume that donor free and self-sufficient MFIs have a deposit rate equal to a subsidized free market rate. The loan rate function reveals that reducing administration costs is a crucial factor for reducing loan rate. According to our loan rate function we can state that a high loan rate can be explained by an inefficient industry.
Concerning donor dependencies, increased competition and excessive loan rates, it is crucial for the MFIs to become more efficient, but the question is how? By studying the effect of efficiency drivers, decision makers can acquire a better knowledge of where to put in effort to increase the MFIs efficiency, hence it makes our study relevant. This thesis is contributing by studying 17 variables regarding cost-efficiency - some of them barely been tested before. Moreover, by using a large global dataset with information from 379 MFIs in 74 countries, it gives validity to the results (Roy Mersland, 2009a).
1.2MAIN OBJECTIVE OF THE STUDY
The main objective of this study is to identify efficiency drivers and determine their effect on the overall efficiency of microfinance Institutions (MFIs), focusing on operational costs. This will involve indentifying elements that might affect the overall efficiency and study how these elements really affect the overall efficiency of MFIs.
1.3STRUCTURE
This thesis is made up of six chapters, including the introduction chapter. Chapter two is an overview of the microfinance industry, presenting the concept of microfinance, participants, product and services, outreach and impact. Chapter three deals with the theoretical
4 efficiency in MFIs and efficiency drivers are presented. The chapter also presents the
hypotheses and the variables used. Research methodology and methods are presented in chapter four following by chapter five in which efficiency drivers are analyzed and results are presented and discussed. Finally, we bring our study to a conclusion in chapter six.
5
2. A MICROFINANCE OVERVIEW
This chapter gives an overview of the microfinance industry, which includes the concept of microfinance, participants, product and services, outreach, and a discussion about the true impact of microfinance.
2.1THE CONCEPT OF MICROFINANCE
Microfinance is based on the idea that poor and low income people with no access to financial services through the ordinary formal financial sector, because of their limited influence and limited possibilities, still have a valuable use of financial services (Ledgerwood, 1998).
One recognized definition that is often referred to, is the one used by Robinson (2001, p. 9): “Microfinance is defined as small-scale financial services-primarily credit and savings-provided to individuals and groups at the local levels of developing countries, both rural and urban”. A similar but more concise definition is used by Gateway (2009): “Microfinance is financial services for poor and low-income clients.” These definitions do not include the development objectives of microfinance, only the financial objectives. Yet, the definitions serve our purpose, focusing on the financial side of microfinance. We have decided to use the definition by Gateway (2009) throughout this thesis.
Many poor and low-income people have access to informal financial services such as commercial moneylenders, typically at a very high cost to the client. The nominal interest rates for small one-day loans can range from 5 percent to more than 20 percent per day (Robinson, 2001). Microfinance promoters highlight that access to microfinance services can reduce risk, raise productivity, diversify income opportunities, increase income, and improve the quality of poor people’s lives and those of their dependents (Robinson, 2001). A common recommendation for MFIs is that they should be financially self-sufficient, independent from subsidies and locally managed (Ledgerwood, 1998). Many of the microfinance providers are struggling financially, but there are a growing number of well-documented success stories of MFIs operating in areas like rural Bangladesh, urban Bolivia or rural Mali. They are all in a strong contrast to the non sustainable and costly state-run specialized financial institutions (Ledgerwood, 1998). Data from the Microbanking Bulletin reports that 63 of the world's top
6 MFIs had around 2.5% return on total assets, after adjusting for inflation and subsidies (MIX, 2008).
In the last years, more attention has been put on poor and low income people’s latent financial needs and their benefit of convenient, flexible and reasonably prized financial services. The industry has developed from microcredit, offering only loans, into microfinance, offering a much broader range of financial products such as microcredit, savings, insurance, money transfers and other financial products (Armendariz de Aghion & Morduch, 2005; Gateway, 2009). Actually, some argue that microfinance is an outdated term also, because of the change from being a marginal and narrow financial assistance, into becoming a commercial industry with a potential market of around 3 billion people (Helms, 2006).
2.2MICROFINANCE CLIENTS
Why do poor people demand microfinance? Rutherford (2000) argues that the main reason is that people need access to lump sums of money. There are particularly three reasons why they need such lump sums:
- Life cycle events: Dowries, funerals, religious feasts, rites, marriage etc.
- Emergencies: Health care, loss of work, climatic incidents, live stock diseases, loss of home (e.g. bulldozing in slum areas) etc.
- Opportunities, either business opportunities or other types of opportunities: Buy land or a TV, fluctuation in food prices (e.g. grains), livestock, machinery, bribes to get hold of opportunities, start a business, increase a business etc.
Promoters of microfinance face a great challenge in reaching people suffering from poverty, not only because of the variety of clients and their needs, but also for the variety of other poor people and potential clients (Robinson, 2001). Despite the variety, we have chosen to use “poor and low income people” from Helms (2006) as a collective term for people that
microfinance promoters try to reach. Helms (2006) points out some general characteristics of microfinance clients:
- Most clients come from moderately poor and vulnerable non-poor households, with some clients from extreme-poor households also participating
7 - Programs that explicitly target poorer segments of the population generally have a
greater percentage of clients from extreme-poor households
- Destitute households are outside the reach of microfinance programs
2.3PROVIDERS OF MICROFINANCE
There is a variety of microfinance providers ranging from informal financial arrangements to formal financial institutions (Helms, 2006). MFIs are a generic term for microfinance
providers normally incorporated as member-based cooperatives, Nonprofit organizations or shareholder firms (R Mersland, 2009b). The spectrum of financial service providers are presented in table 2-1.
Figure 2-1 Providers of microfinance services
Informal Member based NGOs Formal financial institutions Friends and family Moneylenders Saving collectors Traders ROSCAs ASCAs CVECAs FSAs SHGs Cooperative financial institutions
NGOs NBFIs State-owned banks, including postal banks
Rural banks Specialized MFI banks
Full-service commercial banks Note: ROSCAs = Rotating savings and credit associations; ASCAs = Accumulating savings and credit associations; CVECAs = Caisses Villageoises d´Epargne et de Crédit Autogérées; FSAs = Fiancial service associations; SHGs = self-help groups; NGOs = Nongovermental organizations; NFBI = nonbank financial institution.
Source: (Helms, 2006)
The Informal sector is the most common way to access financial service for poor and low-income people. Informal providers consist of friends and family, moneylenders, deposit collectors, pawnbrokers, traders, processors, input suppliers and informal member based schemes (Helms, 2006). Being informal means that it does not apply any bank law nor general commercial law, and any disagreement with the informal bank system cannot be solved by the legal system (Ledgerwood, 1998). Members-based organizations like CVECAs, FSA, SHGs and cooperative financial institutions are building on the informal system, and
8 they both share some similarities, especially on the use of clients own savings as the main source of fund. The main difference is that member-based organizations are organized in a more formal way or promoted by formal organizations.
Between the informal arrangements and the formal financial institutions we find NGOs, which are important contributors to the microfinance market. NGOs are often associated for featuring social missions, but in the last ten years the trend has been in a more commercial direction. The rational explanation for this is often referred to as “seeking sustainability”. Many of the NGOs are often donor dependent and high cost operational. In order to be more self-sufficient, many NGOs are separating the microfinance operations from other services, or transforming the organisation into regulated financial institutions. NGOs have been pioneers when it comes to innovative solutions for reaching increasingly poor and vulnerable groups and pushing the poverty frontier (Helms, 2006).
Formal financial institutions are charted by the government and are subject to banking regulations and supervision (Ledgerwood, 1998). Formal financial institutions consist of NBFIs, state-owned banks and postal banks, rural banks, specialized microfinance banks and full-service commercial banks. Especially state-owned banks have an unfortunate history in the microfinance market, but in spite of all the challenges have many formal financial
institutions, inclusive state-owned banks enormous potential for making financial system truly inclusive. The main advantages are larger size, wide branch networks, wide range of services, and funds to invest in banking systems and skills (Helms, 2006).
2.4PRODUCTS AND SERVICES
Credit service
Microcredit or small-scale lending is probably the most well-known service provided by MFIs. The MFIs lend out credit, mostly for productive purposes but also for consuming, and other purposes, to people that normally do not have access to loans from the formal financial market (Ledgerwood, 1998). MFIs have in general three ways of lending out money, either to individuals, groups or village banks. An individual loan methodology can be explained as credit lend out to individuals that is not member of a group with joint liability for the loan repayment. By combining the methods for lending decisions from formal financial institutions
9 and informal sector lenders, the MFIs has manage to successfully developed effective models for individual lending (Ledgerwood, 1998). Group lending is another loan methodology and consists of groups of people who have a joint interest to enter the financial market. Clients are organized into small groups of 5-10 members and given individual loans within the groups. All members share a joint liability for each loan which substitutes the requirements of collateral. The group lending model has met some critics because of situations where groups tend to exclude the poorest because of the pressure to repay the loan (Hulme & Mosley, 1996). The third loan methodology is the “Village Banking model”. MFIs organize clients into larger groups between 30-100 members and lend out credit to the group itself rather than to individuals, and the group is given the responsibility to distribute credit out to each member (Ledgerwood, 1998).
Saving service
Micro-saving or small-scale saving is provided by the MFIs to enable poor and low-income people to save money safe, and to get some return on their money. It is common to distinguish between two types of savings, compulsory savings and voluntary savings. Compulsory
savings works as a collateral for the loan received, and it can also be considered as a part of a loan product rather than an actual savings product. These strings attached to compulsory savings have met some criticism and dissatisfaction, much because of the locked access to the funds (Armendariz de Aghion & Morduch, 2005; Ledgerwood, 1998). Voluntary savings is the other saving type. It is provided by the MFIs to borrowers and also non borrowers, and it is a lot more user-friendly service then compulsory savings. However, voluntary savings struggles with high administrative complexity and costs, especially for smaller saving amounts, and the MFIs face many challenges on their way of offering voluntary savings (Ledgerwood, 1998). Ledgerwood (1998) points out that savings are useful to:
- Demonstrate the value of savings practice to borrowers.
- Serve as additional guarantee mechanism to ensure the repayment of loans. - Demonstrate the ability of clients to manage cash flow and make periodic
contributions.
10
Insurance service
Micro-insurance is provided by the MFIs to enable poor and low-income people reducing their financial risk, in cases like illness, injuries, extreme weather or fatalities. The most common products offered by the MFIs are life insurance and health insurance, and to some extend property and crop insurance. Life insurance has until now been the most successful insurance product (Armendariz de Aghion & Morduch, 2005). It has not been easy
developing insurance products that fit the needs of poor people, and also makes it economical sufficient for the MFIs. One of the main challenges is to overcome problems of adverse selection and moral hazard. Governmental attempts have turned out to be inefficient and largely non remunerative and informal mechanism has been a very costly alternative. Micro-insurance products does not have the same widespread as microcredit and micro-lending, but there is a growing demand by the poor and low-income and it is expected to be offered more extensively by the MFIs in the future (Ledgerwood, 1998).
Credit cards and payment services
Credit cards and payment services are in an early phase of development and to this date only offered by a few MFIs, anticipated to be a lot more recognized in the future. Offering credit cards is a step in the right direction of giving poor and low-income people simplified and user-friendly financial services, with expected advantages such as streamline operations and an ongoing line of credit, enabling them to supplement their cash flow according to their needs. The MFIs can also benefit from it, expecting lower administrative and operating costs. Yet, it is still early to say if it is going to be a success or not. Payment service includes check cashing and check writing privileges, money transfer and remittance of funds within and across countries. The MFIs offering payment services do not require larger transaction amounts such as formal financial institutions often do (Ledgerwood, 1998).
Nonfinancial service
Some MFIs also provide poor and low-income people with nonfinancial service, meaning social intermediation, enterprise development and other social services such as health,
nutrition, education and literacy training. One argument for mixing financial and nonfinancial service is that economical disadvantages often are accompanied by social disadvantages. However, it is a great challenge to make nonfinancial services profitable, and except for some service fees, nonfinancial services mostly depend on subsidies. Another problem is that many
11 MFIs integrate nonfinancial services with financial service, which makes it difficult to
measure and control the self-sufficiency of the financial services (Ledgerwood, 1998)
2.5 The outreach and impact of microfinance
There have been several attempts to count the number of credit clients served by MFIs worldwide. Christen (2004) estimates the total number of credit clients to be 152 millions. WSBI counted 190 million credit clients in 2005, but they also included savings banks in their estimate. Microcredit Summits (2007) annual report presented an estimate of 133 million credit clients worldwide. They also reported that almost 90 percent of those clients are served by only 67 institutions. Microbanking bulletin (2008) are summing up highlights from 890 MFIs, reaching over 64 million clients. The highlights are presented in table 2-2.
Table 2-1: Highlights from 891 MFIs
Offices (‘000) Employees (‘000) Borrowers (‘000) Depot Accounts (‘000) Loan Portfolio (USD ‘000 000 Deposit (USD ‘000 000) Africa 4 35 5 183 8 036 2 419 1 9848 Asia 23 200 43 294 11 769 6 744 1 163 ECA 3 39 2 387 3 891 7 776 3 296 LAC 9 77 11 374 9 816 13 820 8 637 MENA 2 16 2 244 9 1 040 55 Globe 42 366 64 482 33 520 31 798 15 098
Source: (Mix & eXchange, 2007)
Note: BRI is not included in this survey. Its conclusion would bring global deposits and deposits accounts to the same scale as the lending side.
Microfinance has in the latest years been fronted as the “silver bullet” in the fight against poverty. However, there are some disagreement about the overall effect and the beneficial extend of microfinance (Dichter, 2003). Karnani (2008) has analyzed macroeconomic data and argues that microfinance can actually impact the country’s economy in a less good way compared to job creation and tax revenue. Further he argues that poor people and the society as well will be better off if they are offered a place of employment rather than being pushed into entrepreneurship. Morduch (1998) found no evidence in his survey to support claims that the microfinance programs in Bangladesh increase consumption levels or increase educational enrolments for children relative to levels in the control villages. He says “Tens of millions of dollars worth of subsidized resources support these programs and the question now is
12 whether these benefits are justified by their substantial costs.” A few studies have also found that the burden of dept could have a negative impact on poverty reduction (Hulme & Mosley, 1996; McGuire & Conroy, 2000). Microfinance has also been criticized for not having the ability to reach the poorest of the poor, providing services not suitable for their needs (CGAP, 2009b), and Skarlatos (2004) argues that social needs must be ensured before poor people can benefit from microfinance services.
However, it is a wide agreement about the positive impact on the every-day life of millions of poor and low income people. Copestake et.al (2001) found from a case study in Zambia that it was a positive link between microfinance participation and household growth. They also found that 52% of the borrowers that where asked, had improved their overall quality of life. Some positive impacts that microfinance have on poor and low income people are pointed out (CGAP, 2009b):
- Increasing income and smooth out cash flows. - Building up assets.
- Reducing vulnerability and allow household to better planning for the future. - empowering women and improve their status within the family and the community.
13
3. EFFICIENCY THEORY AND HYPOTHESIS
This chapter presents the theoretical framework applied for the study, which includes a review of efficiency theory and a discussion about the efficiency in MFIs. The chapter also propose hypothesis and define variables.
3.1EFFICIENCY THEORY
Bank literature pays a great deal of attention to the performance of banks (Athanassopoulos, 1997; Bala & Cook, 2003; Brockett, Cooper, Golden, Rousseau, & Wang, 2004; Dekker & Post, 2001; Hartman, Storbeck, & Byrnes, 2001; Kuosmanen & Post, 2001; Luo, 2003; J. M. Pastor, Pérez, & Quesada, 1997; Pille & Paradi, 2002; Schaffnit, Rosen, & Paradi, 1997). This is because better performing financial institutions may improve cost, revenue and financial results. Most researchers review banking literature and theory when studying efficiency in microfinance institutions (Begoña Gutiérrez-Nieto, Serrano-Cinca, & Mar Molinero, 2007b; Lafourcade, Isern, Mwangi, & Brown, 2005; Qayyum, 2006). MFIs efficiency performance can be measured by same financial performance measures applied in the bank literature (Brau & Woller, 2004).
Economic theory assume that production takes place in an environment in which managers attempt to maximize profits by operating in the most efficient manner possible (Evanoff & Israilevich, 1991). The competitive model suggests that firms that fail to do so will be driven away by more efficient ones. Efficiency is using available resources in such a way that we maximize production of goods and services (O'Sullivan & Sheffrin, 2003). A system can be called economically efficient if:
- Nothing can be made better off without making something else worse off. - More output cannot be obtained without increasing the amount of inputs. - Production proceeds at the lowest possible per-unit cost.
The overall efficiency of banks can be decomposed into scale efficiency, scope efficiency, technical efficiency, and allocate efficiency. Scale efficiency deals with operation in the range of constant return to scale. The potential productivity a bank would gain by achieving optimal
14 size of the firm. Scale economies are when average costs decline as bank output rises. This results from spreading fixed costs over greater volume of output (DB Humphrey, 1990). Economies of scale primarily refer to supply-side changes. Still, it is important to be aware of limits. Miller and Noulas (1996) find that the majority of banks in USA are too large, having moved into the region of decreasing return to scale. Scope efficiency deals with operation in different diversified areas, where producing two or more product lines in one firm is less costly than to produce them separately (Panzar & Willig, 1981). Economies of scope refer to demand side change such as increasing/decreasing scope of/and distribution of different products. Technical efficiency represents the capacity and willingness of an economic unit to produce the maximum attainable output from a given set of input and technology (Koopmans, 1951). Allocate efficiency occurs when inputs are combined in optimal proportions (Evanoff & Israilevich, 1991).
The shareholders of a bank have right to claim profits, and it is in their interest to maximize profit. This can be achieved by maximizing revenue and/or by minimizing costs. If the assumptions under perfect competition hold, we are forced to exclude revenue maximizing which makes profit maximizing equivalent to minimizing costs. Berger and Mester (1997) suggest cost efficiencies as one of the most important economic efficiency concepts. Perfect competition can hardly be fulfilled in reality due to regulations and imperfect competition. Yet, the competition is getting harder in the microfinance market. An MFIs cost function can be represented by Berger and Mester (1997):
ln C = f w y z v( , , , )+ ln µc + ln∈c
Where C is the variable costs, f denotes some functional form, w is the vector of prices of variable inputs, y is the vector of quantities of variable outputs, z is the quantities of any fixed net puts, v is the set of environmental or market variables that may affect performance, µc is
the inefficiency factor that may raise costs above the best practice level, and
∈
cis the Random error plus measurement error and luck that may temporarily give banks higher/lower cost. By using the cost function of a MFI denoted as MFIb it can compare its efficiency level against the cost function of a best practice MFI producing the same output bundle under the same conditions. The following function can be applied (A. N. Berger & Mester, 1997):15 min min exp ( , , , ) exp ln exp ( , , , ) exp ln b b b b C f w y z v uc b EFF b b b b b b C f w y z v uc ∧ ∧ ∧ = × = ∧ ∧ ∧ = ×
The numerator explains the estimated cost that it is need for MFIb to produce its output vector if it was efficient as the best practice MFI facing the same exogenous variables (w,y,z,v). The denominator explains the true cost of MFIb. For example, a MFI with a cost-efficiency of 0.70 would indicate that it is wasting 30% of their costs, being only 70% effective compared to the best practice MFI. The ratio ranges from
[ ]
0,1 .3.2EFFICIENCY IN MFIS
Microfinance is considered an important poverty alleviation tool. However, providing credit to the poor and low income people generally proves to be a very costly activity and providers of microfinance services are often loss making and not financially sustainable (Murdoch, 2000). This is partly due to the high transaction costs in terms of screening, monitoring of borrowers and related back-office administrative costs (Hulme & Mosley, 1996). Poor and low income people lend smaller amounts of money and the individual transactions are
relatively small. A typical loan size can be 50 USD or even less for some institutions (Hardy, Holden, & Prokopenko, 2003). Moreover, poor and low income people have limited
possibilities to inform about their creditworthiness and put forward collateral. Focus on decreasing transaction costs should be emphasized for the MFIs in order to increase
profitability and become self-sufficient. Transaction costs arise primarily due to the limits of human ability to process information. “Despite whatever intentions economic actors may have to act rationally and far-sighted, the limitations on gathering, processing and communicating information constrain how rationally individuals can act” (Macher & Richman, 2008, p. 3). There are three main sources of transaction costs. First of all individuals are limited in their ability to plan for the future. They lack the knowledge, foresight or skill to plan for all contingencies that may arise (Simon, 1957). Second,
16 contracting parties have difficulties developing a common language to describe the actions and states of the world. This is often due to lack of information (Hart, 1995). Third, it is often difficult for parties to communicate their plans in such a way that a uniformed third party (e.g. a court) can reasonably enforce them (Lewis & Sappington, 1991).
Lack of modern technology, particularly in remote and rural areas, is a huge challenge for MFIs regarding cost-effective operations. Low population density, poor communication infrastructure and remoteness combined with low technology is associated with high transaction costs and covariant risks (Bank, 2003; Johnson, Malkamaki, & Wanju, 2005 ). However, if the MFIs can manage to make use of technological developments such as credit cards, ATMs, cell phones and internet, they can reduce costs and operate in a more efficient way (Hermes, et al., 2008). Fortunately, modern technology has expanded rapidly in
developing countries. For example, 82 percent of the last 2 billion cell phones were sold in developing countries (Pasricha, 2008). Purchase transactions using credit cards (instead of cash) have also been growing fastest in developing countries (Honohan & Beck, 2007).
Being self-sustainable is a major challenge in the microfinance industry, and many of the MFIs are depending on donors (R Mersland & Strøm, 2008a). A self-sustainable MFI is able to repay the opportunity costs of all inputs and assets with its generated income (Chaves & Gonzalez-Vega, 1996). Many argue that is only a short-term solution depending on donors, and MFIs can only exist in the long run if they can liberate from donors and become self-sustainable (Arsyad, 2005; Maddison, 2006). It is also argued that the solution to expand MFIs globally depends on MFIs becoming self-sufficient (Drake & Rhyne, 2002; Robinson, 2001). Research suggests that presence of subsidies increases MFI costs because it removes pressure from the management that would otherwise force them to increase efficiency
(Armendariz de Aghion & Morduch, 2005; Valentina Hartarska, Caudill, & Gropper, 2006a). Hardy et.al (2003) argues that subsidies should be restricted to only one-time support to cover the start-up costs in MFIs since ongoing support is likely to increase moral hazard and poor management. Nevertheless, donors have played an important key role in the microfinance industry, especially in the start-up of MFIs, funding the systems and staff capacity (CGAP, 2003a). Most donors are also monitoring the MFIs to verify that their donations are used in accordance with their wishes, and this can help improve the performance of MFIs (Fama, 1983).
17 Poor and low income peoples lack of collateral and the high cost of providing small loans in remote and rural areas are reflected in high nominal interest rates provided by the MFIs (Armendariz de Aghion & Morduch, 2005; CGAP, 2009c). Low efficiency can make interest rates higher than necessary and attention to reducing operating costs should be emphasized in order to achieve competitive interest rates (CGAP, 2003a). We demonstrated earlier in the introduction, building upon Hulme and Mosley (1996, p. 19), that the loan rate is much affected by the MFIs administrative cost. Gonzalez (2007) reports that operational costs represent about 2/3 of charges to borrowers, making them the largest component of the interest rates. Attention should be emphasized towards identifying their drivers and
quantifying them in order to improve efficiency in MFIs. Increased efficiency can contribute to decrease the cost of credit to the poor and low-income people, making lending more beneficial.
3.3MEASURING EFFICIENCY
Coelli (2005, p. 5) states that “If information on prices is available, and a behavioral assumption, such as cost minimization or profit maximization, is appropriate, then performance measures can be devised which incorporate this information.” Efficiency performance measures are indicating how well an institution is managing its operations. They are providing information about the rate at which MFIs generate revenue in order to cover their expenses (Ledgerwood, 1998). By comparing their efficiency performance over time and against competitors, MFIs can determine how well they are exploiting their resources and where to make improvements in their operations. While productivity indicators reflect the amount of output per unit of input, efficiency indicators take into account the cost of inputs and/or the price of outputs (Microrate & Bank, 2003). We are focusing on the MFIs
operational cost which can be defined as: “expenses related to the operation of the Institution, including all the administrative and salary expenses, depreciation and board fees” (Microrate & Bank, 2003, p. 16). Operating cost have also been studied in the bank literature by
Athanassoupoulos (1997), Pastor (1999),Worthington (1998), Laeven (1999). Three
frequently used measures of cost-efficiency will be presented in the following. These will be our dependent variables when identify efficiency drivers and determine their effect on the overall efficiency of MFIs.
18
Operating expense to portfolio ratio
Operating expenses to portfolio ratio (OEP ratio) can be used as a measure of cost-efficiency and it is frequently used in the microfinance literature (Ledgerwood, 1998). The OEP ratio indicates the cost needed for the MFI to operate one unit of its portfolio. The ratio ranges from 0 to 1 where a ratio close to zero indicates a highly efficient MFI. Considering the size of the portfolio, larger MFIs can compare its cost level with smaller MFIs. Ahmed and Munir (2006) and Gonzalez (2007) use the OEP ratio in their papers on financial efficiency, and the rating agencies highlight the ratio in their reports. The following variable is used as a measure of the OEP ratio (Roy Mersland, 2009a):
Operating expense OEP ratio =
Average gross portfolio
Operating expense to asset ratio:
The operating expense to asset ratio (OEA ratio) indicates the cost needed for the MFI to operate one unit of its assets. The ratio ranges between 0 and 1. The MFIs assets can include cash, bank deposits, investments, fixed assets or portfolio. MFIs that have a large amount of its capital in non productive assets such as fixed assets, land or property can be less efficient in helping the poor since it is the loan portfolio that poor and low-income people benefit from. Gonzalez (2007) finds that there is a strong relationship between cost reduction and gross loan portfolio to assets. His research implies that a 10 percent increase in gross loan portfolio to assets yields a 7 percent decrease in costs. Vanguri (2008) suggests from his research on capital allocation in MFIs, that allocating more capital towards loan portfolio will yield better returns. Berger and Humphrey (1997) review 130 studies on financial institutions and suggest that banks that have high loans to assets ratios tend to have higher profit efficiency. The value of assets has been included in financial efficiency models by Luo (2003), Seiford and Zhu (1999) . In the banking industry, the ratio of operating expenses to the value of total assets is an accepted indicator of unit operating costs (D Humphrey, Willesson, Bergendahl, & Lindblom, 2006). The following variable is used as a measure of the OEA ratio (Roy Mersland, 2009a):
Operating expense OEA ratio =
19
Cost per Credit client
Cost per credit client (CC) or cost per borrower indicates the average cost of providing an active credit client (Microrate & Bank, 2003). It is different from the two other efficiency measures since it is not a ratio but an absolute value measured in USD. Donors and investors pay special attentions to the cost per client since it indicates the cost of reaching out to one more client. However, measuring efficiency only by looking at the cost of maintaining an active credit client can give an incomplete picture. A low indicator can indicate that MFIs are putting little resources into screening and monitoring borrowers. In their paper on financial performance in Africa, Lafourcade et.al (2005), use cost per borrower as a measure of efficiency. Their findings conclude that MFIs achieve higher efficiency by keeping cost per borrower low. This is also supported by Ahmad and Munir (2006) and Mersland and Strøm (2008a). UNCDF (2005) states that efficiency should preferably be measured through cost per borrower. The following variable is used as a measure of the dependent variable (Roy
Mersland, 2009a):
Operational expense CC =
Credit clients
3.4EFFICIENCY DRIVERS, HYPOTHESES AND VARIABLES PRESENTATION
This section presents a literature review and a discussion about the efficiency drivers. We are also presenting our hypotheses and the variables we are using to measure efficiency drivers. This section also explains the concept of using statistical hypothesis and dummy variables.
In statistical theory a hypothesis is an unproven proposition or supposition that tentatively explains certain facts or phenomena. A hypothesis is a statement, an assumptions about the nature of the world (Zikmund, 2000, p. 459). The classical hypotheses consist of a null hypothesis and an alternative hypothesis, generally notated as Η0 for the null hypothesis and
A
Η for the alternative hypothesis. A Null hypothesis is typically not the expected results. It is often a conservative statement, expecting changes in the results to be entirely due to random errors. The purpose for a null hypothesis is to provide an opportunity to nullify it. In our study we will have null hypothesis stating that the tested efficiency driver actually has no effect on the MFIs overall efficiency. The alternative hypothesis, expected to be the true one, state that the tested efficiency driver has an effect on the MFIs overall efficiency (Greene, 2003;
20 Studenmund, 2006; Zikmund, 2000). Regression models, analysis and hypothesis testing will be presented later in the following chapters.
Applying dummy variables can be useful in order to explain if a sample meets a particular condition or not. It has two distinct levels which are coded 0 and 1 (Studenmund, 2006; Zikmund, 2000).
A dummy variable D = 1 if the th observation meets a particular condition 0 otherwise i i
As an example, if we want to know the gender of a person, we can make use of a dummy variable equal 1 for female and 0 otherwise. Both genders are explained by one variable; if it is not a female, then it has to be male. The event not explicitly represented by a dummy variable, the omitted condition, forms the basis against which the included conditions are compared (Studenmund, 2006, p. 222). Dummy variables can also be useful to represent variables with more than two alternatives. For example, if we want to measure if it is a child, adult or elderly person, it would be wrong to have one variables ranging from 0 to 2. We have no reason to think that if an elderly is equal to 2 it is then twice the size of an adult equal to 1. The solution would be to create two dummy variables, one to explain if it is a child (or
otherwise), and another one to explain if it is an adult (or otherwise). The third alternative whether it is an elderly (or otherwise), will be explained by comparing the two included variables.
Credit officer productivity
Credit officer or loan officer productivity states the number of credit clients per loan officer in a MFI. A credit officer can be defined as “personnel whose main activity is direct
management of a portion of the loan portfolio”(Microrate & Bank, 2003, p. 22). Arsyad (2005) suggests that the efficiency of MFIs increases if they can manage to increase credit officer productivity. Increasing average loan size or number of clients per credit officer will increase credit officer productivity. A positive and very significant impact on efficiency is also supported by Luzzi and Weber (2006). However, too many clients per credit officer may result in higher loan losses (Ledgerwood, 1998). In line with Luzzi and Weber (2006) and Arsyads (2005) findings we propose the following hypothesis:
21 Hypothesis 1: Credit officer productivity
0
1 :
Η Η1Ais not true.
A
1 :
Η Increased credit officer productivity has a positive effect on the MFIs overall efficiency.
The following variable is used as a measure of credit officer productivity (Roy Mersland, 2009a):
Total number of credit clients COProd =
Total number credit officers
Competition
In the recent years competition among MFIs has increased rapidly. Additionally, commercial banks have become more interested in providing microfinance services due to the high levels of profitability among some MFIs in the recent years (Hermes, et al., 2008). It is reasonable to believe that the microfinance industry and especially the clients will gain from increased competition. However, it seems to be some disagreements about the effect on the MFIs efficiency. Gorton and Winton (2003) argues that competition may undermine the long-time customer relationship, and lead to time consumption and increased cost in order to keep the customer and maintain the relationship, which suggests that increased market competition will decrease the efficiency in MFIs. Moreover, Luzzi and Weber (2006) show that number of competitors has a strong negative influence on financial performance. Also, McIntoch (2005) argues that entrance of competitors in the Ugandan microfinance market led to a decline in loan repayment and exit of larger borrowers. This is also supported by similar findings in Bolivia (Sengupta & Aubuchon, 2008), and Thailand (Ahlin & Townsend, 2007). However, in the recent years institutions have started to share information about borrowers, which has led to strengthen in dynamic incentives and an increase in the client base. The MFIs seem to adjust to the increased competition. Mersland and Strøm (2009d) find a significant increase in performance with an increase in competition, since new entrants force the MFIs to drive down cost and increase efficiency in order to survive in the market. Similar findings were reported by the Asian development bank’s research on MFIs in the Philippines (Fernando & Nimal, 2004). This is also supported by Rhyne and Otero (2006) and Nickell et.al (1997). Based on
22 the preceding discussion we expect the market competition to have an effect on the MFIs overall efficiency. Yet, we are uncertain about the direction. The following hypothesis is presented.
Hypothesis 2: Market competition
0
2 :
Η Η2Ais not true.
A
2 :
Η Market competition has an effect on the MFIs overall efficiency.
The variable used in this study to measure market competition is made up of subjective judgments based on general competition information provided in the rating reports. It is only a rough guide to the relative competition pressure in the microfinance markets. The market competition scale is ranging from 1 to 7 points, where 1 is little or no competition and 7 is high competition (Roy Mersland, 2009a). There are two subjective judgments of the MFIs market competition in the dataset, so we have decided to use the average value of those two. The following formula is used as a measure of market competition:
Market competition I + Market competition II MC =
2
Pure financial service
Most MFIs are specialized into only providing financial services, while others also provide non-financial services such as social intermediation, enterprise development, health, nutrition, education and literacy training (Ledgerwood, 1998). Luzzi and Weber (2006) suggest that number of services will affect financial performance, but they are not able say anything about the direction of this influence. Lensink and Mersland (2009c) find that MFIs only offering financial services are more efficient than MFIs combining financial services with social services. In accordance with the findings of Lensik and Merlsand (2009c) we propose the following hypothesis:
Hypothesis 3: Pure financial services
0
3 :
Η Η3Ais not true.
A
3 :
23 The following variable is used (Roy Mersland, 2009a):
1 if the MFI only provide financial services PureFS = 0 otherwise Age
CGAP (2009a) suggest three reasons why older MFIs are more efficient then younger MFIs; higher numbers of loans may drive scale economies, higher average loan sizes may improve the cost structure, and more knowledge about customers may streamline processes. Gonzales (2007) shows that MFI efficiency is strongly related to age and that efficiency increases substantially over the years. Still, he implies that growing beyond 2000 customers has no significant efficiency gain that can point in the direction of scale economies. This can be explained by a learning curve. When the customer base is build up, and most internal processes have been tested and improved the trend begins to level off. Moreover, Coleman (2007) finds that ageing MFIs increase loan losses because they have to grant credit to new customers who may not be as creditworthy as its present customer-base. In line with what CGAP (2009a) suggest we propose the following hypothesis:
Hypothesis 4: Age 0 4 : Η Η4Ais not true. A 4 :
Η MFIs increase their overall efficiency when ageing.
MFIs age can be calculated by subtracting the year of start-up with MFI activities from the year of rating. The following variable is used for studying age as an efficiency driver:
rated start-up Age = Year -Year
Loan methodology
MFIs have as explained in chapter two in general three ways of lending out money, either to individuals, groups or village banks. Hermes et.al (2008) find results indicating that group lending is less costly due to reduced information costs attended with the joint liability
arrangement. This is also supported by Hartarska et.al (2006a). On the other hand, individual lending method yields the highest average profit and it is largely favorable considering the
24 high loan size per borrower (Cull, Demirguc-Kunt, & Morduch, 2007; R Mersland & Strøm, 2008a). It is important to notice that individual lending increases the cost per client but
reduces the OEP and OEA ratio. It is more expensive to service a larger loan than a small one. In other words, individual lending reduces costs relatively, but not in absolute terms. In line with Cull et.al (2007) and Mersland and Strøm (2008a) findings we propose the following hypothesis:
Hypothesis 5: Loan methodology
0
5 :
Η Η5Ais not true.
A
5 :
Η Individual lending will decrease OEP and OEA ratio and increase cost per client compared to group and village lending.
Many MFIs provide both individual lending and group lending, but only the main loan methodology is registered in our variables. We have converted one variable ranging from point 1 to 3 (1 for Village banking, 2 for Solidarity group lending and 3 for individual lending), into two dummy variables. The following definitions are used:
1 if the main loan methodology is village banking VG =
0 otherwise
1 if the main loan methodology is solidarity group lending SG =
0 otherwise
The following dummy variable will be excluded from the model:
1 if the main loan methodology is individual lending IL =
0 otherwise
Urban versus rural markets
MFIs can roughly operate in urban or rural markets, or both. It is reasonable to expect higher input prices in urban areas, especially on labor, which should suggest a less efficient market to operate in. However, lower technology and lower population density in rural makes should suggest otherwise. Luzzi and Weber (2006) find that rural intervention is positive for the
25 outreach but negative for the financial performance of the MFIs. This indicates that MFIs operating in rural areas are less efficient then MFIs operating in urban areas. In accordance with Luzzi and Weber (2006) we propose the following hypothesis:
Hypothesis 6: Urban versus rural markets
0
6 :
Η Η6A is not true.
A
6 :
Η Urban markets are the most efficient markets for the MFIs to operate in.
We have converted one variable ranging from point 1 to 3 (1 for urban areas, 2 rural areas and 3 for urban and rural areas) into two dummy variables. The following definitions are used:
1 if the MFI is operating in urban areas Urban =
0 otherwise
1 if the MFI is operating in rural areas Rural =
0 otherwise
The following dummy variable will be excluded from the model:
1 if the MFI is operating in urban and rural areas UaR = 0 otherwise Performance pay
Some MFIs pay the credit officers based on their financial performance (Roy Mersland, 2009a). Therefore it is reasonable to expect that performance pay improve the efficiency of MFIs. Holtmann (2002) asserts that highly productive MFIs often have incentive schemes. Yet, the designs of the schemes are different among MFIs. Holtmann (2002, p. 2) says: “There is little dispute among microfinance practitioners that well-designed staff incentive schemes can have positive and powerful effects on the productivity and efficiency of MFI operations.” However, he also point out that incentives schemes in MFIs have little empirical research to rely on. After introducing a performance-based bonus system for the loan officers, productivity improved significantly and now stands at the top of the industry with 644
26 can relate to increased efficiency. Based on Holtmann (2002) and Farrington (2000) we state the following hypothesis:
Hypothesis 7: Performance pay
0
7 :
Η Η7A is not true.
A
7 :
Η Performance pay has a positive effect on the MFIs overall efficiency
The following variable is used (Mersland):
1 if the MFI is offering performance pay PerP =
0 otherwise
Personal expenses per employee
Personnel expenses are one of the main components of operational costs. Low salary costs increases efficiency and decreases OEP ratio. Arsyad (2005) shows that low salary costs leads to higher efficiency. This is also supported by Hermes et.al (2008). However Cull et.al (2007) finds that labor costs are positively correlated with financial performance indicating that increasing labor costs increases efficiency. This can be due to high monitoring and screening of clients that lend larger amounts. In accordance with Arsyad (2005) and Hermes et.al (2008) we propose the following hypothesis:
Hypothesis 8: Cost per employee
0
8 :
Η Η8Ais not true
A
8 :
Η Lower cost per client will increase the MFIs overall efficiency.
The variable is calculated by using the following formula (Roy Mersland, 2009a):
Personell cost CE =
27
Average outstanding loan
Mixmarket defines average outstanding loan amount as: “the outstanding principal balance of all of the MFI’s outstanding loans including current, delinquent and restructured loans, but not loans that have been written off. It does not include interest receivable”. MFIs incur high costs due to the high transaction costs in terms of screening, monitoring of borrowers and related back-office administrative costs (Hulme & Mosley, 1996). In order to be able to cover these costs, MFIs are often tempted to increase loan size. Gonzales (2007) implies that increasing loan size makes lending more efficient. Further, he suggests that loan size is one of the main drivers of OEP. Similar results are found in Hartarska et.al (2009). The number of loans outstanding is used as an output by Berger and Humphrey (1997) and Tortosa-Ausina (2002). Mersland and Strøm (2008a) indicate that inefficient MFIs need to shift their loan portfolios towards larger average loans in order to increase efficiency. It is important to notice that increased LOA increases the cost per client but reduces the OEP and OEA ratio. It is more expensive to service a larger loan than a small one. In other words, increasing loan outstanding average reduces costs relatively, but not in absolute terms. Based on the findings we propose the following hypothesis:
Hypothesis 9: Loan outstanding average
0
9 :
Η Η9Ais not true.
A
9 :
Η Higher LOA will decrease OEP and OEA ratio and increase cost per client.
The variable used to study the effect of average outstanding loan amount is calculated by using the following formula (Roy Mersland, 2009a):
Gross outstanding portfolio LOA =
Number of active credit clients
Credit officer ratio
Credit officers are those that have direct relationship with the clients. They identify clients, screen them and give follow-up and monitoring. The higher the share of the staff being credit officers, the more efficient the MFI should be. For example, Baumann (2004) uses credit officer ratio as a measure of productivity in his paper on performance of MFIs in South
28 Africa. Similarly Microrate and Bank (2003) suggest using the credit officer ratio when analysing the efficiency of MFIs. In line with Baumann’s (2004) findings we propose the following hypothesis:
Hypothesis 10: Credit officer ratio
0
10 :
Η Η10A is not true.
A
10 :
Η Higher credit officer ratio will increase the MFIs overall efficiency.
The variable us calculated by using the following formula (Roy Mersland, 2009a):
Total number of credit officers CO =
Total number of employees
MFI Size
The size of an MFI can be measured by its total assets. Humphrey (1987) finds evidence that as size of an financial institution changes, so does average cost of operations implying that efficiency increases from economies of scale. They are able to spread costs over a larger volume (DB Humphrey, 1990). However, Gonzales (2007) finds that there are limits to scale economies suggesting that scale economies in MFIs have a U-form where little efficiency effect comes from increased scale after reaching 2000 customers. Munir and Ahmad (2006) find that size of a MFI is significant and positively correlated with efficiency measures implying that as size of an MFI increases, costs decrease due to scale of economies. In line with Munir and Ahmad (2006) among others we propose the following hypothesis:
Hypothesis 11: MFI size
0
11 :
Η Η11Ais not true
A
11 :
Η MFI size has a positive or negative effect on the MFIs overall efficiency
Size of the MFI states the size of the MFIs measured by logarithm of total assets. The following definition is used:
29
(
)
Size = log Assets
Control variables
Human development index (HDI) indexis a measure of human development in each country. It measures the average achievements in a country based on three dimensions of human development; Health, knowledge and life standard measured by the GDP per capita (Nations, 2007). We believe that the HDI variable can balance the USD purchasing power between countries. A country with high USD purchasing power is expected to have a low HDI. Zeller et.al (2000) among others used the HDI index in their research.
Regional control variablesstatethe MFIs operating region. We add regional control variables to our regression models to see if there are differences in the efficiency between regions. Regional control variables are also used in research by Hartarska and Nadolnyak (2007) and Zacharias (2008). We converted the country variable found in the dataset into five dummy variables, sorted by regions. The following definitions are used:
1 if the MFI is operating in Eastern Europe or Central Asia EECA =
0 otherwise
1 if the MFI is operating in Middle East or North Africa MENA =
0 otherwise
1 if the MFI is operating in Asia Asia =
0 otherwise
1 if the MFI is operating Africa Africa =
0 otherwise
The following dummy variable will be excluded from the model: 1 if the MFI in Latin America
LA =
0 otherwise
30 Table 3-1: Variables summary
Variable(s) Definition Hypotheses
Dependent variables
OEP ratio (Operating expense to portfolio ratio) Operating expense / Average outstanding portfolio OEA ratio (Operating expense to assets ratio) Operating expense / Average outstanding assets CC (Cost per credit clients) Operating expense / Credit clients
Independent variables
COProd ( Credit officer productivity) Credit clients / Credit officers - MC (Market Competition) (Market competition I + market competition II) / 2 + or - PureFS (Pure Financial Service) Dummy variable (1,0) -
Age year rated - year started -
VB (Village Banking) Dummy variable (1,0) + and -* SG (Solidarity Groups) Dummy variable (1,0) + and -* IL (Individual Lending) Dummy variable (1,0) -
Urban Dummy variable (1,0) -
Rural Dummy variable (1,0) +
UaR (Urban and Rural) Dummy variable (1,0) + PerP (Performance Pay) Dummy variable (1,0) - CE (Cost per employee) Personnel cost / Employees + LOA (Loan Outstanding Average) Average outstanding loan amount / Credit clients - and +* CO ratio (Credit officer ratio) Credit officers / Total employees -
Size Log of assets -
Control variables
HDI (Human Development Index) HDI
MENA Dummy variable (1,0) EECA Dummy variable (1,0) LA Dummy variable (1,0) Asia Dummy variable (1,0) Africa Dummy variable (1,0)
+ if the independent variable increases (decreases) then the dependent variables increases (decreases). - if the independent variable decreases (increases) then the dependent variable increases (decreases). Lower dependent variables indicate higher efficiency.