Institute of Crop Science and Rescource Conservation - Phytomedicine
Detection, identification, and quantification of fungal
diseases of sugar beet leaves using imaging and
non-imaging hyperspectral techniques
Inaugural-Dissertation zur
Erlangung des Grades Doktor der Agrarwissenschaften
(Dr. agr.)
der
Hohen Landwirtschaftlichen Fakultät der Rheinischen Friedrich-Wilhelms-Universität zu Bonn vorgelegt am 04.11.2010 von Anne-Katrin Mahlein aus Ansbach
Referent: Prof. Dr. H.-W. Dehne Koreferent: Prof. Dr. H. Goldbach Tag der mündlichen Prüfung: 20.01.2011 Erscheinungsjahr: 2011
Abstract
Plant diseases influence the optical properties of plants in different ways. Depending on the host pathogen system and disease specific symptoms, different regions of the reflectance spectrum are affected, resulting in specific spectral signatures of diseased plants. The aim of this study was to examine the potential of hyperspectral imaging and non-imaging sensor systems for the detection, differentiation, and quantification of plant diseases. Reflectance spectra of sugar beet leaves in-fected with the fungal pathogens Cercospora beticola,Erysiphe betae, and Uromyces betae causing Cercospora leaf spot, powdery mildew, and sugar beet rust, respectively, were recorded repeatedly during pathogenesis. Hyperspectral data were analyzed using various methods of data and image analysis and were compared to ground truth data. Several approaches with different sensors on the measuring scales leaf, canopy, and field have been tested and compared. Much attention was paid on the effect of spectral, spatial, and temporal resolution of hyperspectral sensors on disease record-ing. Another focus of this study was the description of spectral characteristics of disease specific symptoms. Therefore, different data analysis methods have been applied to gain a maximum of information from spectral signatures.
Spectral reflectance of sugar beet was affected by each disease in a characteristic way, resulting in disease specific signatures. Reflectance differences, sensitivity, and best correlating spectral bands differed depending on the disease and the developmental stage of the diseases. Compared to non-imaging sensors, the hyperspectral non-imaging sensor gave extra information related to spatial resolu-tion. The preciseness in detecting pixel-wise spatial and temporal differences was on a high level. Besides characterization of diseased leaves also the assessment of pure disease endmembers as well as of different regions of typical symptoms was realized. Spectral vegetation indices (SVIs) related to physiological parameters were calculated and correlated to the severity of diseases. The SVIs differed in their sensitivity to the different diseases. Combining the information from multiple SVIs in an automatic classification method with Support Vector Machines, high sensitivity and specificity for the detection and differentiation of diseased leaves was reached in an early stage. In addition to the detection and identification, the quantification of diseases was possible with high accuracy by SVIs and Spectral Angle Mapper classification, calculated from hyperspectral images. Knowledge from measurements under controlled condition was carried over to the field scale. Early detection and monitoring of Cercospora leaf spot and powdery mildew was facilitated.
The results of this study contribute to a better understanding of plant optical properties during disease development. Methods will further be applicable in precision crop protection, to realize the detection, differentiation, and quantification of plant diseases in early stages.
Kurzfassung
Pflanzenkrankheiten wirken sich auf die optischen Eigenschaften von Pflanzen in unterschiedli-cher Weise aus. Verschiedene Bereiche des Reflektionsspektrums werden in Abhängigkeit von Wirt-Pathogen System und krankheitsspezifischen Symptomen beeinflusst. Hyperspektrale, nicht-invasive Sensoren bieten die Möglichkeit, optische Veränderungen zu einem frühen Zeitpunkt der Krankheits-entwicklung zu detektieren. Ziel dieser Arbeit war es, das Potential hyperspektraler abbildender und nicht abbildender Sensoren für die Erkennung, Identifizierung und Quantifizierung von Pflan-zenkrankheiten zu beurteilen. Zuckerrübenblätter wurden mit den pilzlichen Erregern Cercospora beticola, Erysiphe betae bzw. Uromyces betae inokuliert und die Auswirkungen der Entwicklung von Cercospora Blattflecken, Echtem Mehltau bzw. Rübenrost auf die Reflektionseigenschaften erfasst und mit optischen Bonituren verglichen. Auf den Skalenebenen Blatt, Bestand und Feld wurden Messansätze mit unterschiedlichen Sensoren verglichen. Besonders berücksichtigt wurden hierbei Anforderungen an die spektrale, räumliche und zeitliche Auflösung der Sensoren. Ein wei-terer Schwerpunkt lag auf der Beschreibung der spektralen Eigenschaften von charakteristischen Symptomen. Verschiedene Auswerteverfahren wurden mit dem Ziel angewendet, einen maximalen Informationsgehalt aus spektralen Signaturen zu gewinnen.
Jede Krankheit beeinflusste die spektrale Reflektion von Zuckerrübenblättern auf charakteristische Weise. Differenz der Reflektion, Sensitivität sowie Korrelation der spektralen Bänder zur Befallsstär-ke variierten in AbhängigBefallsstär-keit von den Krankheiten. Eine höhere Präzision durch die pixelweise Er-fassung räumlicher und zeitlicher Unterschiede von befallenem und gesundem Gewebe konnte durch abbildende Sensoren erreicht werden. Spektrale Vegetationsindizes (SVIs), mit Bezug zu pflanzen-physiologischen Parametern wurden aus den Hyperspektraldaten errechnet und mit der Befallsstärke korreliert. Die SVIs unterschieden sich in ihrer Sensitivität gegenüber den drei Krankheiten. Durch den Einsatz von maschinellem Lernen wurde die kombinierte Information der errechneten Vegeta-tionsindizes für eine automatische Klassifizierung genutzt. Eine hohe Sensitivität sowie eine hohe Spezifität bezüglich der Erkennung und Differenzierung von Krankheiten wurden erreicht. Eine Quantifizierung der Krankheiten war neben der Detektion und Identifizierung mittels SVIs bzw. Klassifizierung mit Spektral Angle Mapper an hyperspektralen Bilddaten möglich.
Die Ergebnisse dieser Arbeit tragen zu einem besseren Verständnis der optischen Eigenschaften von Pflanzen unter Pathogeneinfluss bei. Die untersuchten Methoden bieten die Möglichkeit in Anwen-dungen des Präzisionspflanzenschutzes implementiert zu werden, um eine frühzeitige Erkennung, Differenzierung und Quantifizierung von Pflanzenkrankheiten zu ermöglichen.
List of Abbreviations
ANN. . . Artificial Neural Networks
ARI. . . Anthocyanin Reflectance Index
ATCOR4. . . Atmospheric/Topographic Correction Algorithms for Airborne Sensors 4
BGI2. . . Blue/Green Index 2
BRDF. . . Bidirectional Reflectance Distribution Function
Car. . . Carotenoids
Chla. . . Chlorophyll a
Chlb. . . Chlorophyll b
Chltotal. . . total Chlorophyll
CLS. . . Cercospora leaf spot
DMSO. . . Dimethylsulfoxide
ECa. . . apparent Electrical Conductivity
FWHM. . . Full Width at Half Maximum
GIS. . . Geographic Information System
GPS. . . Global Positioning System
GS. . . Growth Stage
HyMap. . . Hyperspectral Mapper
IDW. . . Inverse Distance Weighting
LAI. . . Leaf Area Index
LIBSVM. . . Library for SVMs
mCAI. . . Modified Chlorophyll Absorption Integral
MCARI. . . Modified Chlorophyll Absorption Reflectance Index
mND. . . Modified Normalized Difference Index
MNF. . . Minimum Noise Fraction
mSR. . . Modified Simple Ratio
ND. . . Normalized Difference Index
NDVI. . . Normalized Difference Vegetation Index
NIR. . . Near Infrared Reflectance
OSAVI. . . Optimized Soil Adjusted Vegetation Index
PA. . . Precision Agriculture
PM. . . Powdery mildew
PRI. . . Photochemical Reflectance Index
PSND. . . Pigment Specific Normalized Difference
PSSR. . . Pigment Specific Simple Ratio
REP. . . Red Edge Position
RGB. . . Red Green Blue
ROI. . . Region of Interest
ROSIS. . . Reflective Optics Systems Imaging Spectrometer
RRE. . . Reflectance at inflection point
SAM. . . Spectral Angle Mapper
SBR. . . Sugar beet rust
SG. . . Sum Green Index
SIPI. . . Structure Insensitive Pigment Index
SLU. . . Spectral Linear Unmixing
SR. . . Simple Ratio
SV. . . Sum VIS Index
SVI. . . Spectral Vegetation Indices
SVM. . . Support Vector Machines
SWIR. . . Shortwave Infrared Reflectance
VIS. . . Visible reflection
Contents
Abstract i
Kurzfassung ii
List of Abbreviations iii
1 INTRODUCTION 1
2 LITERATURE REVIEW 5
2.1 Precision Agriculture . . . 5
2.2 Precision crop protection and monitoring of plant diseases . . . . 7
2.3 Optical sensor systems . . . 8
2.4 Reflection of vegetation . . . 10
2.5 Hyperspectral sensors for disease detection . . . 15
2.6 Analysis of hyperspectral data . . . 17
2.7 Host-pathogen model . . . 20
2.8 Disease management of foliar sugar beet diseases . . . 22
3 MATERIAL AND METHODS 25 3.1 Organisms . . . 25 3.1.1 Plants . . . 25 3.1.2 Pathogens . . . 25 3.2 Plant cultivation . . . 25 3.2.1 Controlled conditions . . . 25 3.2.2 Field experiment . . . 26
Contents
3.3 Production and inoculation of pathogens . . . 27
3.3.1 Cercospora beticola . . . 27
3.3.2 Erysiphe betae . . . 28
3.3.3 Uromyces betae . . . 28
3.4 Assessment of plant physiological and physiochemical parameters 29 3.4.1 Disease assessment . . . 29
3.4.2 Microscopic investigations . . . 29
3.4.2.1 Stereo microscopy . . . 29
3.4.2.2 Scanning electron microscopy . . . 30
3.4.3 Pigment assessment . . . 30
3.4.3.1 SPAD-meter measurements . . . 30
3.4.3.2 Extraction of leaf pigment . . . 30
3.4.3.3 Measurement of pigment concentrations . . . 31
3.5 Sensor systems/Hyperspectral measurements . . . 31
3.5.1 ASD FieldSpecPro FR/ASD FieldSpecPro JR . . . 31
3.5.2 Hyperspectral camera system ImSpector V10E . . . 33
3.5.2.1 Technical setup . . . 34
3.5.2.2 Normalization and preprocessing of hyperspec-tral data . . . 36
3.5.3 Airborne sensors . . . 36
3.6 EM 38 soil sensor . . . 37
3.7 Data analysis . . . 37
3.7.1 Development of spectral signatures . . . 37
3.7.2 Spectral vegetation indices . . . 38
3.7.3 Spectral Angle Mapping classification . . . 41
3.7.4 Machine learning . . . 42
3.7.5 Geo-referenced maps . . . 43
Contents
4 RESULTS 45
4.1 Etiology of sugar beet diseases . . . 46
4.1.1 Disease progress on leaf scale . . . 46
4.1.2 Disease progress on canopy scale . . . 48
4.1.3 Temporal and spatial symptom development . . . 48
4.1.4 Modifications of leaf structure during pathogenesis . . . . 52
4.1.5 Effect of foliar diseases on leaf pigment content . . . 53
4.2 Differentiation of foliar diseases based on spectral signatures of infected leaves . . . 56
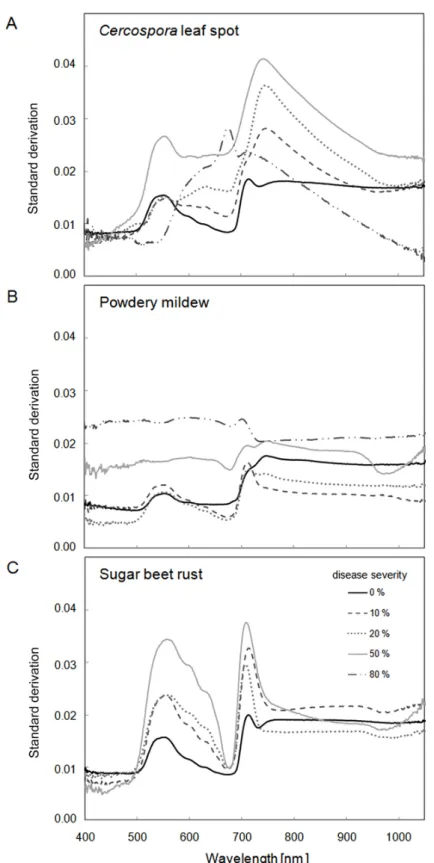
4.2.1 Impact of foliar diseases on the spectral reflectance of sugar beet . . . 56
4.2.2 Selection of disease-specific wavelengths . . . 67
4.3 Spectral vegetation indices as indicators of plant status and their correlation to diseases . . . 73
4.3.1 Effect of disease progression on spectral vegetation indices 73 4.3.2 Combination of spectral vegetation indices for disease identification . . . 79
4.4 Detection and classification of plant diseases with Support Vector Machines based on spectral vegetation indices . . . 83
4.4.1 Dichotomous classification between healthy and diseased sugar beet leaves . . . 84
4.4.2 Multi-class classification among healthy leaves and leaves with specific disease symptoms . . . 85
4.4.3 Classification of healthy leaves and leaves inoculated with fungal pathogens at early stages of pathogenesis . . . 85
4.5 Hyperspectral imaging for disease detection, identification, and quantification . . . 88
4.5.1 Pixel-wise attribution of spectral signatures during dis-ease development . . . 88
Contents
4.5.1.2 Changes in spectral signatures during pathogenesis89
4.5.2 Spatial illustration of vegetation indices during disease
development . . . 92
4.5.2.1 Binary classification of healthy and diseased leaf
tissue by spectral vegetation indices . . . 96
4.5.3 Spectral angle mapper classification for the assessment of foliar leaf diseases from hyperspectral images and its
ability to distinguish multiple disease symptoms . . . 100
4.6 Monitoring of plant diseases on the field scale using remote
sens-ing technologies . . . 109
4.6.1 Spatial soil heterogeneity . . . 109
4.6.2 Progress of Cercospora leaf spot and powdery mildew . . 110
4.6.3 Impact of plant diseases on sugar beet biomass . . . 112
4.6.4 Multi-temporal and multi-sensoral monitoring of diseases . 113
5 DISCUSSION 119
6 SUMMARY 143
1.
INTRODUCTION
Von Witzke et al. (2008) recently demonstrated that the worldwide demand for agricultural products exceeds the supply; hence there is a need to manage the worldwide production of agricultural commodities more efficiently. The potential yield of crops is affected by different stresses (e.g. pest, weed, nutrition deficiencies or water stress), which can reduce the production capacity. Oerke and Dehne (2004) indicated that the impact of diseases, insects, and weeds represents a potential annual loss of 40% of world food production.
Traditional agricultural management practices assume parameters in crop fields to be homogeneous, thus the output of pesticides and managing actions is not in relation to the demands (Steiner et al., 2008). Due to high control costs and the environmental impact of fungicides, a site-specific application accord-ing to precision agriculture techniques is of high interest. Precision agriculture – integrating different modern technologies like sensor, information, and man-agement systems – aims to match agricultural input and practices to the spatial and temporal variability within a field. Thus, a better use of resource and an avoidance of great differences in yield quality and quantity due to small-scale site-specific differences can be attained.
Considering that the occurrence of diseases depends on specific environmental factors and that diseases often exhibit a patchy distribution in fields, remote sensing techniques could be useful in identifying primary disease foci and areas differing in disease severity in the field (Franke and Menz, 2007; Franke et al.,
sensor devices, application maps may be generated to manage agricultural fields in due consideration of spatiotemporal disease heterogeneities. Site-specific ap-plications of pesticides, according to precision agriculture strategies result in a potential reduction in pesticide use, and thus can reduce the economical expenses and ecological impacts in agricultural crop production systems ( Geb-bers and Adamchuk, 2010). Gerhards and Christensen (2003) have shown that precision agriculture has the potential to reduce the application of herbicides. With online weed detection by image analysis and a map-based GPS-controlled patch spraying, the herbicide output was diminished in winter cereals against dicotyledonous weeds by 60% and for monocotyledonous weeds by 90%. To bring these practices forward to a site-specific application of fungicides, further research has to be implemented. As a basis, automatic disease detection has to be optimized.
Various indicators suggest that a detection, differentiation, and quantification of fungal diseases based on reflectance measurement would be feasible. If a symptom or a disease is detectable by naked eye, it should be measurable with a sensor, recording the reflectance of the symptom different from that of healthy tissue. Crucial points in sensor detection of biotic and abiotic stress factors, in particular of plant diseases, are the sensitivity and the specificity of the devices. Sensitivity denotes the ability of a sensor to detect various changes at a certain time. The specificity is characterized by classifying the change causing agent, or to discriminate between different possible causes. Stress causing agents, and likewise different plant diseases often cause similar symptoms and changes in plant physiology (Nutter et al., 1990; Stafford, 2000). As the primary effects of different diseases to the plant biochemistry and physiology vary, different wavebands should be suitable for detection. However, not only plant pathogens cause chloroses and reduce the chlorophyll content.
A detailed understanding of plant physiological processes depending to a spe-cific disease, as well as knowledge of sensor-object interaction is indispensable.
1. INTRODUCTION
To implement hyperspectral sensors in threshold-orientated decision making systems, the sensor system has to have the capability for disease quantifica-tion. Beside the differentiation of stress factors and plant diseases among each others, hyperspectral sensors have to allow a pre-symptomatic detection of dis-ease infection, to intervene with proper management strategies, like time- and site-specific fungicide application.
This study aims at exploring the potential of non-invasive hyperspectral sen-sor systems from remote sensing science for the detection of plant diseases. Experiments were carried out on sugar beet plants and their foliar pathogens
Cercospora beticola, Erysiphe betae, and Uromyces betae to investigate the use of imaging and non-imaging hyperspectral sensors referring to the following questions: Do plant diseases have specific spectral signatures useful for disease identification? Is an early detection of infection by pathogens possible? What is the potential of sensors to differentiate among leaf diseases? Is a quantification of plant diseases at different stages possible?
Specific spectral signatures of leaves, diseased with Cercospora leaf spot, pow-dery mildew, and sugar beet rust, caused byCercospora beticola,Erysiphe betae, and Uromyces betae, respectively, have been evaluated and compared during disease development. The three disease causing pathogens differ in their way of life and in their interaction with the host plant sugar beet. Thus, hyper-spectral data of three differing host-pathogen systems have been assessed and comparatively analysed.
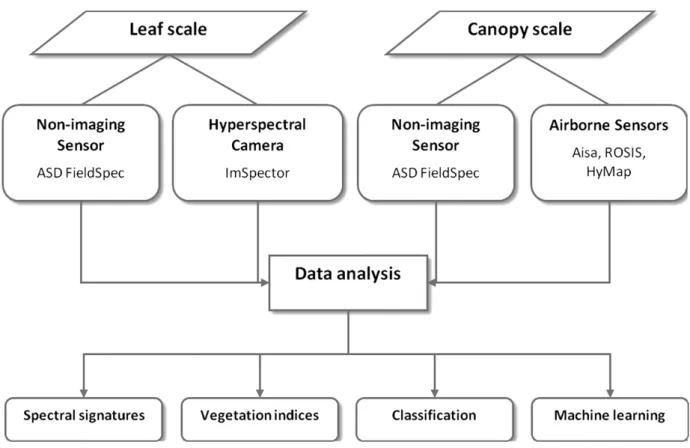
The sensitivity and specificity of hyperspectral sensing for disease detection is influenced by several factors. Hence, different approaches with different sensor-devices on different measuring scales have been tested and compared (Fig. 1.1). Observing the leaf and canopy level, much attention was paid on requirements on the spectral, spatial, and temporal resolution of hyperspectral sensors for disease detection. Experiments with different sensor systems have been made on the leaf and canopy level under controlled conditions and in the field. One focus
of this study was the comparison of non-imaging and imaging hyperspectral sensors for their suitability of disease detection and for a detailed description of spectral characteristics of disease specific symptoms. Until now disease-specific spectral vegetation indices or the analysis of hyperspectral data for disease detection are not available. Therefore, different data analysis methods have been applied to gain a maximum of information from spectral signatures. In an interdisciplinary approach with the Institute of Geodesy and Geoinfor-mation, University of Bonn, an optimization of data analysis methods and the development of disease specific spectral indices for an early detection and differ-entiation of fungal diseases have been realized. This PhD work was embedded in the Research Training Group 722 ’Use of Information Techniques for Pre-cision Plant Protection’ funded by the German Research Foundation (DFG) from 2007 to 2010.
Figure 1.1:Concept of data assessment and data analysis on different scales with specific hyperspectral sensors.
2.
LITERATURE REVIEW
2.1 Precision Agriculture
The use of innovative technologies collectively named ’Precision Agriculture’ is a promising approach to optimize agricultural production of crops. In field crop production precision agriculture methodologies are applied to site-specific ap-plication of fertilizer or pesticides, automatic guidance of agricultural vehicles, product traceability, on-farm research or management of production systems (Gebbers and Adamchuk, 2010). Recently precision agriculture also enhances management decisions in livestock production, pasture management, viticul-ture, and horticulture (Gebbers and Adamchuk, 2010; Schellberg et al., 2008). Precision crop production aims to match agricultural input and practices to the spatial and temporal variability within a field, instead of managing an entire field based on a hypothetical average. Small-scale site-specific differences can lead to great differences in yield and quality, thus a better use of resources to preserve the quality and quantity of agricultural products with respect on environmental resources is essential (Gebbers and Adamchuk, 2010).
The philosophy behind precision agriculture is not only including a direct eco-nomical optimization of agricultural production, it also stands for a reduction of harmful outputs into environment and non-target organisms. In particular a contamination of water, soil, and food resources with pesticides has to be min-imized in crop production (Bongiovanni and Lowenberg-Deboer, 2004). With
2.1. Precision Agriculture
this aim, site-specific fertilizer application was the first successfully implementa-tion in 1988, soil sampling, yield mapping, and site specific herbicide applicaimplementa-tion succeeded (Adamchuk et al., 2004; Gerhards and Oebel, 2006; Stafford, 2000). Against the background of food security and sustainable production, adequate technologies are fundamental for this agricultural practice (Zhang et al., 2002). The implementation of information-based management systems into crop pro-duction since the mid 1980s implies a huge potential to modernize the agricul-tural practice. Since then different techniques for the characterization of soils and crops have been engineered and included into decision making systems. To name the most important ones, precision agriculture integrates different tech-nologies like global positioning systems (GPS), geographic information systems (GIS), as well as different kind of sensors and therefore it demands a high level of expertise (Kühbauch and Hawlitschka, 2003; Stafford, 2000).
For the future an information-driven crop production as a combination of geospatial and agricultural data management will encourage the actual utiliza-tion of precision agriculture applicautiliza-tions (Nash et al., 2009; Reichardt et al.,
2009). Current research on precision agriculture for crop production focuses on the development of sensors for remote detection of crops and soil in real time. Relevant field parameters like soil properties, topography, water status, crop micro-climate, nutritional status, weeds, and pests and diseases as well as yield can be monitored and estimated. Integration of different remote sensing techniques and image analysis in combination with a global positioning system will be an essential step towards online application.
Still one limiting factor of a successful use of precision agriculture is the in-terpretation of properties derived from sensor data, rather than the collection of relevant data (Schellberg et al., 2008). The interpretation of information and its implementation into robust decision support systems will improve the acceptance and implementation of precision agriculture techniques.
2. LITERATURE REVIEW
2.2 Precision crop protection and monitoring of plant
diseases
Precision crop protection is a demanding challenge within precision agriculture and offers high potential to reduce the costs and environmental impact of fungi-cide use. According to the characteristics of plant diseases, a site-specific crop management requires a high density of spatial and temporal information with regard to the status of any crop growth-relevant parameter. The disease moni-toring and decision-making process is the fundamental origin for a site-specific managing of spatially and temporally variable diseased field sites (Steineret al.,
2008).
Currently two different approaches for site specific fungicide application are un-der examination; indirect decision-making by assessing canopy density or crop growth stage (Dammer et al., 2008; Scotford and Miller, 2005) or direct dis-ease detection (West et al., 2003). These modern methods in plant production and crop protection are closely related to innovative technologies. Near-range and remote sensing, like hyper- and multispectral sensors or thermography in precision pest management possess multiple opportunities to increase the pro-ductivity of agricultural production systems and to reduce the environmental burden from pesticides. Real-time decision based on the information of the sensing system- ’spray or don’t spray’ can control cultural practices (Stafford,
2000). Due to high control costs and the environmental impact of fungicides, a site-specific application according to precision farming techniques – i.e. monitor and manage spatially-variable fields site-specifically (Stafford,2000) – is of high interest. Therefore, a precise, reproducible, and time-saving disease monitoring method is essential (Bock et al., 2010; Hillnhuetter and Mahlein, 2008; Sted-dom et al., 2005). Remote sensing technologies are one basic tool of precision agricultural practice which can provide an alternative to visual disease assess-ment (Nutteret al., 1990). Westet al.(2003) have provided a detailed overview
2.3. Optical sensor systems
of the sensor-based detection of stress. The variety/nature of a to monitored phenomenon and its environmental circumstances thereby defines the required sensor specifications (e.g. spatial and spectral resolution; temporal availability). Many researchers have shown the potential of remote sensing techniques in the area of agriculture (Combal et al., 2002; Doraiswamy et al., 2003; Galvao et al., 2009; Kruse et al., 2006; Oppelt and Mauser, 2004; Thenkabail et al.,
2000) and also in the field of plant disease detection. E.g. Franke and Menz
(2007), Huang et al. (2007), Moshou et al. (2004), Steddom et al. (2005), and
Zhang et al. (2003) have proven the potential of spectral sensor systems for the detection of fungal diseases. To implement these sensors into precision plant protection technologies, they have to be robust, low-cost, and preferably real-time sensing (Zhang et al., 2002).
2.3 Optical sensor systems
Innovative sensor systems can provide detailed and highly resolved information on crop systems and single plants. Different sensor types can assess different characteristics/parameters of the targeted objects, depending on signal-object interactions. Chaerle and van der Straeten (2001) gave a detailed overview on various sensor types used for assessing plant physiological parameters. Encour-aging approaches are measurements based on thermal characteristics (Jones and Schofield, 2008; Lenthe et al., 2007; Oerke et al., 2006), chlorophyll fluo-rescence (Buschmann and Lichtenthaler, 1998; Chaerle et al., 2007a; Rascher et al., 2000), and reflectance of plants (Oppelt and Mauser, 2004; Peñuelas and Filella, 1998; Ustin et al., 2009). As thermal response and modifications in photosynthesis of plants largely lack diagnostic potential for the identification of plant diseases, more sophisticated sensor systems have to be developed. The present work focuses on the use of non-imaging and imaging hyperspectral sen-sors for the detection, identification, and quantification of plant diseases. Most
2. LITERATURE REVIEW
of the optical sensor systems originate from geographical or remote sensing sci-ence, but there are various approaches in literature to implement these sensors into plant science.
The sensor evolution in remote sensing started from multispectral sensors to hy-perspectral sensors and upcoming to ultraspectral sensors (Meigs et al., 2008). These technically complex devices provide a multiplicity of information over the covered spectral range. But depending on the measured object and aim just few regions of the spectral range are of interest. Narrow spectral bands of hy-perspectral sensors with a spectral resolution up to 1 nm are highly correlated to each other, redundant information is being measured. Likewise, understand-ing of spectral characteristics of the object and of signal-object interaction is elementary for optimization of remote sensing sensors for disease detection. Currently reflectance sensors are classified on their spatial scale, on their spec-tral resolution, and by their way of data assessed, i.e. imaging or non-imaging sensors (Melesse et al., 2007). Each sensor system covers a different scale, for example airborne or spaceborne far-range systems with a smaller spatial resolu-tion, or near-range sensing systems with maximal spatial resolution. The maxi-mal spatial resolution is defined by the minimum size of one pixel and hence the smallest identifiable symptom or structure. Technological advances in sensor development, in particular progress from multispectral broadband sensors to hyperspectral narrowband sensors have drastically increased the quantity and quality of available information.
The way of data recording is essential for data interpretation and analysis. Non-imaging sensors measure the averaged reflectance over a defined area (depending on the field of view of the sensor), a detailed inference of the reflectance source or pure object reflectance is not feasible (Mahlein et al., 2010; Steiner et al.,
2008). Further to non-imaging spectroradiometers, hyperspectral cameras facil-itate the detection of both, spectral and spatial information of an object. The information of a hyperspectral image is based on the spatial X- and Y-axes and
2.4. Reflection of vegetation
a spectral Z-axis, which allows a more detailed and allocated interpretation of the signal object interaction. Each spatially located pixel of an image contains the information of several wavelengths (Fig. 2.1). The use of hyperspectral imaging systems in plant pathology or in disease severity assessment is still in the state of research.
Figure 2.1: Structure of a hyperspectral image data cube of a sugar beet leaf with spatial dimensions X and Y, and the continuous spectrum with 210 reflectance values for an image-pixel from the spectral dimension Z.
2.4 Reflection of vegetation
After various processes of absorption, reflection, and scattering in the atmo-sphere, approximately 40% of the solar flux impacts to earth surface (Brooks and Miller, 1963; Lacis and Hansen, 1973). This electromagnetic radiation interacts with surfaces in different ways. The main interactions are I) absorp-tion, i.e. the process by which energy of a photon is taken up by matter; II) transmission, the process of light passing through matter; and III) reflectance,
2. LITERATURE REVIEW
the process by which incident illumination reacts with matter and returns back from its surface, converted to radiant energy (Baranoski and Rokne,2001). The reflectance is calculated by the ratio of radiant energy reflected from a surface to the radiant energy incident on the surface and is therefore independent of illumination variation (Lillesand and Kiefer, 2000).
Plant - sunlight interaction
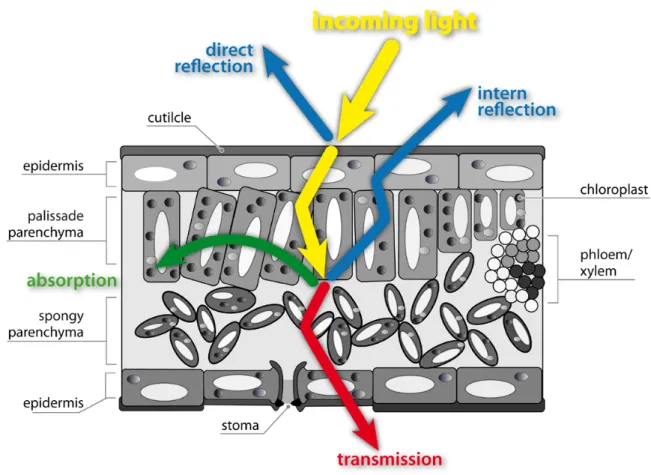
In the interaction between sunlight and plant tissue, solar radiation is the en-gine of photosynthetic processes and therewith the source of life on earth. The attenuation of light insight plant leaves results from complex absorption and scattering processes, influenced by the biochemical composition and morpho-logical characteristics of the leaf tissue (Fig. 2.2; Govaerts et al., 1996). Leaf reflectance of sunlight in the visible (VIS, 400 to 700 nm), near infrared (NIR, 700 to 1100 nm) and short wave infrared (SWIR, 1100 to 2500 nm) are driven by multiple interactions: radiant energy absorption induced by leaf chemistry, scattering of light as a result of leaf surface and internal cellular structures, and radiant energy absorption induced by leaf water content (Fig. 2.3; Carter and Knapp, 2001; Jacquemoud and Ustin, 2001).
The VIS range is characterized by low reflectance, due to absorption by photo-active plant pigments. The chlorophyll amount in the parenchyma and spongy mesophyll controls the level of light absorption (Govaerts et al., 1996). Chloro-phyll a and chloroChloro-phyll b absorb blue (400 to 495 nm) and red light (620 to 700 nm), and transfer the absorbed energy into the photosynthetic electron chain (Curran, 1989; Gamon and Surfus, 1999; Sims and Gamon, 2002). Carotenoids absorb blue light (400 to 495 nm) and contribute this energy to the photosyn-thetic system as well (Sims and Gamon, 2002). Furthermore carotenoids have a trapping function to diminish light-induced damages by absorbing light in the UV-region (Merzylak et al., 2008). Anthocyanins which have functions in photoprotection against UV light, osmotic regulation, and warming (Archetti et al.,2009;Gouldet al.,1995;Leeet al.,2003) have an absorption maximum at
2.4. Reflection of vegetation
Figure 2.2:Reflection, absorption, and transmission processes in the interaction between sunlight and plant leaves.
550 nm. The transition from VIS to NIR is specified by the so called red-edge, the reflectance slope between 680 and 750 nm (Filella and Peñuelas, 1994). The reflectance in the NIR is mainly dominated by leaf internal structure, leaf anatomy, and by the characteristics of the epidermal surface (e.g. wax com-pounds, hairs, etc) (Jensen, 2002). High reflection in this region is influenced by direct reflection on the leaf surface and multiple internal scattering processes within the leaf tissue (Jacquemoud and Ustin,2001). Govaertset al.(1996) em-phasized that the epidermis plays an important role in determining the overall bidirectional reflectance of leaves. Leaf biochemical compounds like cellulose, lignin and carbohydrates causes minor absorption in this region (Fig. 2.3; As-ner, 1998; Curran, 1989). Two weak water absorption bands around 970 and 1200 nm are also characteristic for the NIR (Curran, 1989).
2. LITERATURE REVIEW
Leaf reflectance in the SWIR region is mainly influenced by strong water ab-sorption bands at 1200, 1400, 1940, and 2400 nm. Likewise, abab-sorption of structural compounds like cellulose, lignin, starch, and protein occurs in the SWIR (Fig. 2.3; Asner, 1998; Curran, 1989).
Measurements on the canopy scale are additionally effected by several envi-ronmental factors. As a consequence of the complexity of canopy structure, the leaf area, the leaf angle distribution (planophile or erectophile stands), and the fraction of plant organs as green foliage, stems, florescence or reproductive organs impact reflectance patterns (Jackson and Pinter,1986; Jacquemoud and Baret, 1990). Gitelson et al. (2002) emphasized that eminently reflectance in the NIR depends on factors such as canopy architecture, cell structure and leaf inclination and is thus more species-specific than reflectance in VIS, governed mainly by pigment content. Shadow, bidirectional effects, and soil background may interfere with the canopy reflectance as well (Biliouriset al.,2007;Gitelson et al., 2002; Oppelt and Mauser, 2004; Pinty et al., 1998). Phenological stages of plants may also have an impact on spectral reflectance as well, as Delalieux et al. (2009) demonstrated in multi-temporal observations of apple plants. The function described by the ratio of the intensity of reflected light to the illuminated light for each wavelength forms the leaf/canopy spectral signature (Carter and Knapp, 2001; Jones et al., 2003; West et al., 2003). Consequently, biophysical and biochemical attributes of vegetation can be concluded from reflectance spectra.
Optical methods like hyperspectral imaging and non-imaging sensors have been proved to be a useful tool to detect changes in plant vitality (Apan et al.,
2005; Hatfield et al., 2008; Nilsson,1995; Pinter et al., 2003; West et al., 2003). Hence, spectral reflectance measurements are applicable for non-destructive assessment of the physiological status of vegetation (e.g. pigment content, leaf area), and in order to discriminate crop species or to detect the impact of stress like plant diseases, drought stress or nutrition deficiencies (Blackburn, 1998b,a,
2.4. Reflection of vegetation
Figure 2.3: Vegetation reflectance spectrum with leaf reflectance influencing factors in the VIS, NIR, and SWIR and absorption characteristics of biochemical plant components (Curran,1989;Jensen,2002, both modified).
2007; Gitelson et al., 2002, 2003; Moran et al., 1997; Richardson et al., 2001). Nonetheless, an interpretation of spectral reflectance measurements without knowledge on spectral behaviour of leaves is impossible.
2. LITERATURE REVIEW
2.5 Hyperspectral sensors for disease detection
Several studies have shown a convincing ability of reflectance measurements in discriminating between healthy and stressed plants. Disease symptoms often result from physiological changes in plant metabolism brought about by the pathogen (Apan et al., 2005; Nilsson, 1995; Oerke et al., 2006). The impact of plant diseases on the physiology and phenology of plants, however, varies with the host-pathogen interaction and may cause modifications in pigments, water content, and tissue functionality of plants or in the appearance of pathogen-specific structures (Gamon and Surfus, 1999; Jing et al., 2007; Pinter et al.,
2003). All these individual impacts may alter the spectral pattern of plants. Knowledge on the physiological effects of diseases on the metabolism and tissue structure of plants is therefore essential for the hyperspectral discrimination of healthy and diseased leaf and canopy elements (Moran et al., 1997).
The best results for the detection of diseases were obtained in the VIS and NIR range of the spectrum. Steddom et al. (2005) demonstrated that multispectral disease evaluation can be used effectively to measure necrosis caused by Cer-cospora leaf spot in sugar beets. A detection of rhizomania in sugar beet fields was also feasible (Steddomet al.,2003). Using a quadratic discriminating model based on reflectance,Bravoet al. (2003) could classify yellow rust infestation on winter wheat with a reliability of 96%. Yellow rust decreases the chlorophyll a concentration, which leads to an increase in canopy reflectance in the VIS range and a decrease in the NIR (Jing et al., 2007). Larsolle and Muhammed (2007) computed disease-specific spectral signatures of Drechslera tritici-repentis in-fected spring wheat. Other researchers successfully used spectral data to detect
Magnaporthe grisea on rice (Kobayashiet al., 2001), Phytophthora infestans on tomato (Zhanget al.,2002),Venturia inaequalis on apple trees (Delalieuxet al.,
2007), yellow rust in wheat (Huang et al., 2007), and Dothistroma septospora
on pine trees (Coops et al., 2003). Damages to crops caused by virus diseases (Naidu et al., 2009) or insects (Board et al., 2007; Carrol et al., 2008;Xu et al.,
2.5. Hyperspectral sensors for disease detection
2007;Yang et al., 2007) could also be detected using spectral sensors. However, most of these studies used airborne data for the discrimination between mature disease symptoms and healthy leaves at an advanced level of infection.
The detection of a specific plant disease and the discrimination between healthy and diseased plants was the main focus of several research groups. To bring this research forward into field, there are still some difficulties and open ques-tions. First, from the technical side it is still open, which spatial and spectral resolution is required and following which sensor systems harbours the opti-mal specifications for disease detection (Steiner et al., 2008). Second, an early detection, even before visible symptoms appear, was realized only by few work-ing groups uswork-ing different technical and analytical approaches (Bravo, 2006;
Chaerle et al.,2007b; Rumpf et al., 2010). Third, the assessment of the disease severity or quantification of diseases has to be implemented in further studies.
Larsolle and Muhammed (2007) classified disease severity from hyperspectral reflectance in wheat and barley, compared to visual assessments using a near-est neighbour classifier with an accuracy of 86.5%. Fourth, the sensor system should be able to differentiate between different kinds of stresses, especially different diseases. Most stress factors, such as diseases, nutrient deficiency or water stress induce symptoms with little distinguishing spectral characteristics (Stafford, 2000). Recently Moshou et al. (2006) discriminated between yellow rust infection and nitrogen deficiency and Qin et al. (2009) – using hyperspec-tral near range imaging – differentiated citrus canker from different kinds of citrus diseases on grapefruit.
Since most of the published studies have used non-imaging hyperspectroscopy, the application of hyperspectral imaging focusing on spectral information of disease symptoms is limited. Bravo et al. (2003) used in-field spectral images for an early detection of yellow rust infected wheat, Nansen et al. (2009) an-alyzed hyperspectral data cubes for the detection of insect-induced stress in wheat plants, and Polder et al. (2010) have combined different optical
sen-2. LITERATURE REVIEW
sors for the detection of tulip breaking virus. By now, hyperspectral imaging is more widespread in the field of monitoring fruit/food security and quality.
Balasundaram et al. (2009) and Qin et al. (2009) developed a hyperspectral imaging approach to detect canker lesions on citrus fruits. In other studies hyperspectral imaging has been successfully applied for quality assessment of pickling cucumbers, maize kernels, poultry carcasse or apples (Ariana et al.,
2006; Nansen et al., 2008; Park et al., 2007; Xing et al., 2007). Though the use of reflectance measurements in plant pathology research started about 20 years ago, this is still a new technology, not fully tested or adapted to the needs of plant disease detection and severity assessment (Bock et al., 2010).
2.6 Analysis of hyperspectral data
Characteristic for the use of non-imaging hyperspectrometers and especially of hyperspectral imaging systems is the recording of high amounts of information on the object acquired at the same time. Since large amounts of data also implies enormous file sizes and computing times, the analysis of hyperspectral data is a complex domain, and different approaches can be used to obtain the results.
Reflection of contiguous wavebands of electromagnetic radiation by an object re-sults in a spectral signature, the basis of hyperspectral data analyses. Anomalies or differences between spectral signatures can be distinguished by calculating difference spectra, ratios or derivations (Carter and Knapp,2001;Pietrzykowski et al., 2006; Richardson et al., 2001; Smith et al., 2004; Xu et al., 2007). Dif-ferent parts of the spectral signatures can be correlated to biochemical or bio-physical characteristics (Blackburn, 1998b,a, 2007; Carter and Spiering, 2002;
Delalieux et al., 2005; Fourty et al., 1996; Gitelson et al., 2001, 2002; Jacque-moud et al., 1995; Le Maire et al., 2004; Richardson et al., 2001; Ustin et al.,
2.6. Analysis of hyperspectral data
database called LOPEX, including spectral reflectance data of over 50 plant species and their corresponding biochemical constituents like lignin, proteins, cellulose, starch, chlorophyll, or water. Jacquemoud and Baret (1990) devel-oped the well established model PROSPECT describing leaf optical properties from 400 nm to 2500 nm. Le Maire et al. (2004) tested and established sev-eral leaf chlorophyll vegetation indices using this leaf-radiatic transfer model to determine the chlorophyll content.
Spectral vegetation indices
Based on the understanding of these principles and by using further results of analytical investigations, spectral algorithms, based on specific wavelengths of spectral signatures of vegetation, have been developed (Blackburn, 1998b;
Carter and Miller, 1994; Gamon and Surfus, 1999; Haboudane et al., 2004;
Laudien et al., 2003; Peñuelas et al., 1997). Spectral vegetation indices (SVIs) are widely used for monitoring, analyzing, and mapping temporal and spatial variation in vegetation (Gitelson et al., 2002). By calculating ratios of several bands at different ranges of the spectrum, SVIs result in a reduction of data dimension, which may be also useful in effective data analysis for disease dis-crimination. They are highly correlated to several biochemical and biophysical plant parameters indicating plant health or vitality and form the basis for many remote sensing applications in crop management. As pigment concentrations provide information on the physiological state of leaves, pigment-specific SVIs may be useful in detecting stresses caused by fungal diseases.
Several approaches have shown that vegetation indices are related to character-istics of crops and in principal they have the potential to detect plant diseases (Hatfield et al., 2008; Thenkabail et al., 2000). E.g., Graeff et al. (2006) used hyperspectral reflectance for the detection of powdery mildew (Blumeria grami-nis sp. tritici) and take-all disease (Gaeumannomyces graminis sp. tritici) of wheat, Jing et al. (2007) correlated the severity of yellow rust to SVIs, Laudien et al. (2003) developed a modified chlorophyll absorption integral for
Rhizocto-2. LITERATURE REVIEW
nia late rot detection in sugar beet, and Delalieux et al. (2005) used vegetation indices for the assessment of apple scab due to Venturia inaequalis. Steddom et al. (2005) calculated SVIs from multispectral data from sugar beet fields and compared these indices to disease severity, visually rated by plant pathologists. Since indices commonly used in remote sensing of vegetations are not disease-specific, the development of disease specific indices could improve the specificity and sensitivity of SVIs for disease detection.
Classification algorithms
In remote sensing applications, many classification and change detection tech-niques have been developed to obtain maximal information from hyperspectral data and images. Classification is a procedure of assigning a spectral signa-ture to a characteristic group or class, and confines these groups from each other, respectively. The classes can be predefined (supervised classification) or non-predefined (unsupervised classification). Change detection is the process of identifying differences in the state of a spectral signature by observations at different times (Singh, 1989). Since disease epidemiology and symptom de-velopment is causing temporal and spatial changes in vegetation reflectance, most classification techniques from remote sensing applications are likely to be useful for the detection of disease-induced spectral changes. Principal compo-nent analysis (PCA), spectral mixture analysis (SMA), spectral angle mapper (SAM), and machine learning methods like artificial neural networks (ANN) or support vector machines (SVM) are the most common methods used for data analysis. Although all these algorithms have their own specifications and merits, there is not a single approach which is optimal for all applications (Lu et al., 2004).
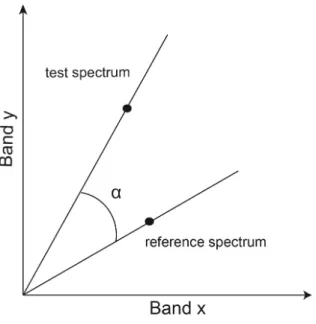
The Spectral Angle Mapper is a supervised classification algorithm, comparing the spectral similarity between image spectra to reference spectra (Kruse et al.,
1993). This method calculates the spectral angle between image spectra and reference spectra in an n-dimensional space, whereas n is the number of
hyper-2.7. Host-pathogen model
spectral bands of the spectral range. Small spectral angles correspond to high similarity, large spectral angles to less similarity. Given spectra from a visually classified pixel can be used as reference spectra from a spectral library. Based on the number of reference spectra, classification of pixels can be processed simultaneously. The accuracy of SAM algorithms is assessed by comparing the classification result with actual disease data (ground truth). The SAM classifier is a common tool in geographical analyses of hyperspectral data for land cover classification (Dennisonet al.,2004), to study ecosystem processes (Ustinet al.,
2004), and for the classification of urban surface cover (Segl et al., 2003).
2.7 Host-pathogen model
Sugar beet (Beta vulgaris L. var. altissima) is a member of the Chenopo-diaceae. The biannual plant forms a fleshy taproot accumulating assimilates like polysaccharides or nitrogen compounds. Sugar beet was first cultivated for sugar production in Europe in the eighteenth century (Van Cleef, 1915). Sugar from sugar beet accounts for 30% of the world’s sugar production. Sugar extraction is a highly developed process and high performance varieties from plant breeding may provide high sugar yields. But foliar fungal diseases are se-rious threats in worldwide sugar beet production. Cercospora beticola (Sacc.),
Erysiphe betae (Vanha) Weltzien and Uromyces betae (Persoon) Lev., causing
Cercospora leaf spot (CLS), powdery mildew (PM), and sugar beet rust (SBR), respectively, are the most relevant fungal leaf pathogens causing losses in yield quantity and quality (Wolf and Verreet, 2002). Disease-specific symptoms of the leaf pathogens cause destruction of the leaf tissue. The sugar beet pro-ductivity is highly influenced by solar radiation captured by the crop canopy (Jaggard et al., 2009). Losses are primarily attributed to a reduction in the photosynthetically active leaf area, and secondly to a subsequent reversion of assimilate allocation from the roots to form new foliage. A reduction in root
2. LITERATURE REVIEW
weight and in the sugar fraction of harvested roots is the consequence (Franc,
2010). Infection process, leaf colonization and spread of each pathogen have specific optima for environmental factors – temperature, relative humidity, leaf wetness – and host-intrinsic factors like nutritional status or ontogenetic status. A heterogenic attribution of the pathogens in the growing area and even a spa-tial and temporal variability within a field may be monitored (Mahlein et al.,
2009; Wolf and Verreet, 2002).
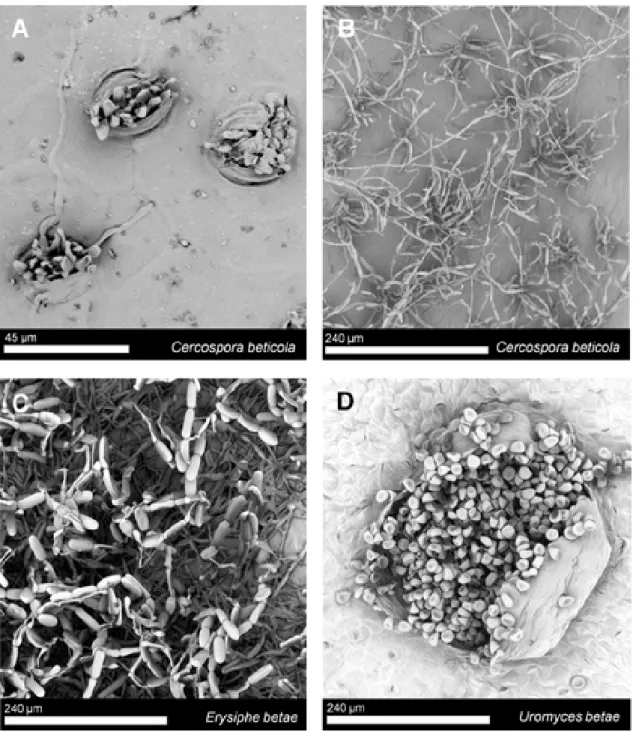
The three foliar diseases are associated with typical symptoms. The perthotrophic pathogen C. beticola causes leaf spots with a reddish brown mar-gin of typically 2 to 5 mm diameter (Franc, 2010; Weiland and Koch, 2004;
Wolf and Verreet, 2002). Under high temperature conditions and high relative humidity the leaf spots coalesce to form large necrotic areas (Vereijsssen et al.,
2006). Pathogenicity of C. beticola-isolates is associated with the synthesis of the pathotoxin cercosporin (Daub and Ehrenshaft, 2000). Causing yield losses approaching 40%, Cercospora leaf spot is the most important foliar disease in sugar beet production (Lartey et al., 2010).
The biotroph pathogen E. betae relies on the functional metabolism of sugar beet tissue as a nutrient source (Francis, 2002). Characteristic symptoms of powdery mildew are white, fluffy mycelia, which covers the upper and lower site of the leaf. At mature infestation, leaf chlorosis and necrosis can be observed. An inhibition of photosynthetic CO2 assimilation and a decrease of quantum efficiency of light use is also reported (Gordon and Duniway, 1981; Magyarosy et al., 1976). Losses up to 30% can occur under dry and hot conditions during summer. Characteristic for powdery mildew is a fast spread by wind inside the crop stand and across different growing regions (Wolf and Verreet, 2002). The basidiomycete U. betae also is an obligate biotroph plant pathogen. Typ-ical symptoms of sugar beet rust are small pustules (0.5 to 1.5 mm), often encircled by a chlorotic ring, irregularly distributed over the leaves. Reddish-brown uredospores are released after rupturing the epidermal layer. Moderate
2.8. Disease management of foliar sugar beet diseases
climate with temperatures around 20 ◦C and relative humidity up to 100% are supporting conditions for infection. Thus river and cost regions are imperiled areas (Wolf and Verreet, 2002).
2.8 Disease management of foliar sugar beet diseases
Yield quality and quantity are significantly influenced by crop stand manage-ment, in particular by disease control. Foliar diseases of sugar beet are com-monly controlled by planting resistant cultivars, crop rotation, or by multi-ple fungicide applications. Since nonchemical, preventive alternatives like host plant resistance and crop rotation do not provide adequate disease control, fungicides are the most important tool for managing foliar diseases ( Ioanni-dis and KaraoglaniIoanni-dis, 2010). Strategies of chemical control must be based on alternation of fungicides with different modes of action, use of products with mixtures of fungicides differing in the mode of action, and on a threshold-orientated management based on an accurate monitoring of the disease pressure (integrated disease management).
Detailed knowledge on the epidemiology of foliar pathogens and their impact on sugar yield has led to the development of several forecast and decision sup-port systems like the IPM-model Sugar Beet (Wolf, 2001), CERCBET (Racca and Jörg, 2007), ProPlant (Frahm et al., 1996), or BEETCAST (Pitblado and Nichols, 2005). The implementation of these systems has shifted fungicide ap-plications from ’calendar based’ spraying to a precise fungicide application con-sidering multiple factors. These factors include disease susceptibility of sugar beet cultivar, planting date, weather data, micro-climate of the canopy, leaf wet-ness duration, inoculum level of pathogens, disease assessment and monitoring as well as characteristics of the fungicides (Windels, 2010; Wolf and Verreet,
2010). The success of these programs, however, demands a high level of engage-ment and of awareness of the farmer. Automation of disease assessengage-ment using
2. LITERATURE REVIEW
optical sensor systems can be useful in order to improve existing forecast mod-els. Considerations of temporal and spatial heterogeneities of diseases in field would be just two future trends according to precision agriculture. A precise, reproducible, objective, and time saving monitoring process is a further benefit.
3.
MATERIAL AND METHODS
3.1 Organisms
3.1.1 Plants
Sugar beet plants (Beta vulgaris, L.), cultivar Pauletta (KWS GmbH, Einbeck, Germany), were used as experimental plants.
3.1.2 Pathogens
Cercospora beticola (Sacc.)
Erysiphe betae (Vanha)
Uromyces betae (Persoon) Lev.
All pathogens originated from the pathogen collection of INRES - Phy-tomedicine and were collected from the experimental field site Bonn Poppels-dorf, Germany.
3.2 Plant cultivation
3.2.1 Controlled conditions
Sugar beet seeds, cultivar Pauletta were pre-grown in small pots and were piqued when the primary leaves had fully developed. For different experimental
3.2. Plant cultivation
setups, sugar beet plants were cultivated in different pots. Seedlings were trans-ferred into a commercial substrate (Klasmann-Deilmann GmbH, Germany) in plastic pots (∅13 cm; ∅17 cm) for experiments on the leaf level. For exper-iments on canopy level, sugar plants were grown in plant boxes (80 x 120 x
60 cm) in a soil mixture of 50% commercial substrate, 30% C-horizon and 20% sand, or in quadratic big pots (20 x 20 x 30 cm). Plants were cultivated in a controlled environment at 23/20 ◦C (day/night), 60 ± 10% relative humid-ity (RH) and a photo-period (> 300 µmol m−2 s−1) of 16 h per day. Plants were watered as necessary and fertilized weekly with 100 ml of a 0.2% solution of Poly Crescal (Aglukon GmbH, Düsseldorf, Germany). Plants were used for the experiments after reaching growth stage (GS) 16 (BBCH scale; Meieret al.,
1993). Control plants without fungal inoculation were kept healthy by applying the fungicide VegasR, (Spiess-Urania, Germany; cyflufenamid 51.3 g/l,
appli-cation rate 650 µl/l) two days before inoculation of the other plants. In order to avoid an unintentional infection of plants inoculated with C. beticola and
U. betae, respectively, with powdery mildew, the selective fungicide FortressR
(Dow AgroScience Ltd., United Kingdom; quinoxyfen 250 g/l, application rate
650 µl/l) was applied two days before inoculation.
3.2.2 Field experiment
A field experiment was conducted at the research station Klein-Altendorf (50◦36055.300 N, 7◦000.1000 E) of the University of Bonn in the growing season 2008. Sugar beet plants, cultivar Pauletta were sown on the 24th of April with
1 unit/ha. Three herbicide applications were undertaken to avoid the influ-ences of weeds on sugar beet plant growth and canopy reflectance (10th of May, Betanal ExpertR
, Bayer CropScience, Mohnheim, Germany, phenmedipham
75 g/l, desmedipham 25 g/l, ethofumesat 151 g/l, application rate 1 l/ha, beetixR
, Stähler GmbH & Co.KG, Stade, Germany, metamitron 696 g/l, ap-plication rate 1.5 l/ha; 20th of May, Betanal ExpertR + beetixR, application
3. MATERIAL AND METHODS
rate 1.25 l/ha+1.5 l/ha; 28th of May, Betanal ExpertR
+ beetixR
, application rate 1.25 l/ha + 2 l/ha). The field was fertilized with 8.5 kg/ha nitro chalk on the 6th of April before sugar beet was sown. At the 20th of June sugar beet plants were fertilized with 8.5 kg/ha epsomite. Insecticide was applied on the 20th of June to avoid leaf damages caused by insects (Karate ZeonR
, Syngenta Agro GmbH, Maintal, Germany, lambda-cyhalothrin 100 g/l, application rate
75 l/ha). The field size was about 3 ha with a homogeneous flat topography. The field was divided into two treatments (Fig. 3.1); plot A without fungi-cide application in order to monitor the occurrence of fungal diseases within the growing season, plot B was treated at GS 39 with the fungicide Spyrale (Syngenta Agro GmbH, Maintal, Germany, difenoconazol 100 g/l; fenpropidin
375 g/l, application rate 1 l/ha) to avoid fungal infections.
Figure 3.1: Field experiment, Klein-Altendorf 2008; plot A without fungicide application, plot B was treated with fungicides to avoid fungal infections of sugar beets.
3.3 Production and inoculation of pathogens
3.3.1 Cercospora beticola
Inoculum of C. beticola, causal agent ofCercospora leaf spot was obtained from heavily infected sugar beet leaves that were stored at room temperature after
3.3. Production and inoculation of pathogens
slowly drying. For sporulation the leaves were wetted and incubated for 24 h
under 100% relative humidity (RH). The spores were washed off with tap water with one droplet of Tween 20 per l. The spore suspension was adjusted to
40000 spores per ml and was sprayed onto the upper and lower side of the leaves. After inoculation, the plants were covered with plastic bags to create 100% RH at 25/20 ◦C (14/10 hours day/night) for48 h. For further incubation, plastic bags were removed and the plants were transferred to 23/20 ◦C (14/10 hours day/night) and 60±10% RH.
3.3.2 Erysiphe betae
E. betae, causing powdery mildew of sugar beet was preserved on vital sugar beet plants in the greenhouse. For inoculation, heavily infested plants were used as an inoculum source of E. betae. Before these plants were transferred into an inoculation chamber, old conidia-spores were removed from the leaves by agitating. Young, virulent conidia were formed within 24 h and were used for inoculation. Healthy plants were placed under the infested plants in a chamber where a ventilator ran for 5 seconds in order to distribute E. betae conidia evenly on the leaf surfaces. Plants were left overnight and were subsequently transferred to a greenhouse at 23/20 ◦C (14/10 hours day/night) and60±10%
RH, separated from the other plants in order to avoid unintentional infections of healthy plants.
3.3.3 Uromyces betae
Spores of U. betae, the pathogen causing sugar beet rust, were harvested from sporulating uredia and stored at 8 ◦C. For inoculation a suspension of U. betae
urediniospores in tap water (with one droplet of Tween 20 per l), with 40000
spores per ml, was prepared and sprayed onto the upper and lower side of sugar beet leaves. The plants were covered with plastic bags for 48 h (100% RH)
3. MATERIAL AND METHODS
and were incubated in a climate chamber at 19/16 ◦C (14/10 hours day/night). After removing the plastic bags, the plants were transferred to 23/20 ◦C and
60±10% RH.
3.4 Assessment of plant physiological and physiochemical
parameters
3.4.1 Disease assessment
In greenhouse experiments, disease severity was assessed daily after inoculation according to Wolf and Verreet (2002). For measurements on the leaf scale, the percentage of diseased leaf area of the measured leaf in relation to healthy leaf tissue was estimated visually. For powdery mildew infected plants, the percentage of leaf area covered with white fluffy mycelium in relation to total leaf area was recorded. For canopy scale measurements, the diseased leaf area of plant canopy was classified. Furthermore digital RGB images of the leaves were taken. On the field scale, ground truth data, in particular incidence (= % plants/leaves infected) and severity (= % leaf area affected) of diseases were collected at 50 sample points and geo-referenced.
3.4.2 Microscopic investigations
3.4.2.1 Stereo microscopy
A Leica MZ16 F stereomicroscope (Leica Microsystems, Wetzlar, Germany) was used for monitoring the symptom development of C.beticola, E. betae, and
U. betae during pathogenesis. Images were taken daily after inoculation with a fitted digital camera. The images were saved using the programm ’Discus’ (Technisches Büro Hilgers, Königswinter, Germany).
3.4. Assessment of plant physiological and physiochemical parameters
3.4.2.2 Scanning electron microscopy
Scanning electron microscopic observations were obtained using a Phenom scan-ning electron microscope (FEI Europe, Eindhoven, Netherlands) with a 5 kV
thermionic source and a backscattered electron detector1. Freshly harvested leaves from inoculated sugar beet plants were sputter coated at 30 mA for 100 seconds with platinum.
3.4.3 Pigment assessment
The concentration of sugar beet leaf pigments, which is related to plant vitality and absorption of solar light, was assessed during the progress of diseases.
3.4.3.1 SPAD-meter measurements
A Minolta SPAD-502 meter (Minolta Camera Ltd., Osaka, Japan), was used for non-destructive assessment of leaf chlorophyll content. The instrument de-termines the relative amount of chlorophyll present, by measuring the trans-mittance of the leaf at two wave bands (600 to 700 nm and 400 to 500 nm). The dimensionless SPAD-units are proportional to the amount of chlorophyll.
3.4.3.2 Extraction of leaf pigment
Destructive chlorophyll a and b and carotenoid extraction was performed daily after inoculation of pathogens. Five leaf discs with a diameter of 1 cm were collected from the centre of sugar beet leaves, beside the middle leaf vein for each treatment. The content of chlorophyll a, chlorophyll b, total chlorophyll as well as of carotenoids was determined using the method of Hiscox and Is-raelstam (1979). Leaf disc were weighted and the pigments were extracted in 99% dimethylsulfoxide (DMSO) for 24 h in the dark.
1
3. MATERIAL AND METHODS
3.4.3.3 Measurement of pigment concentrations
Absorption of the extract was measured at 470 nm, 645 nm and 663 nm with a double beam UV/VIS spectrophotometer, Uvikon 933 (BioTek Instruments, USA). Pigment concentrations were calculated according to Hiscox and Israel-stam (1979): 1. Chla [µg Chl/g] = solvent[ml] weighted sample[g]·(12.7·A663−2.79·A645) 2. Chlb [µg Chl/g] = solvent[ml] weighted sample[g]·(20.7·A645−4.62·A663) 3. Chltotal [µgChl/g] = solvent[ml] weighted sample[g]·(17.9·A645+8.08·A663)
4. Car [µg Car/g] = solvent[ml]
weighted sample[g]·4.37·A470−0.0143·Chla−0.454·Chl
b
3.5 Sensor systems/Hyperspectral measurements
For the acquisition of hyperspectral information from sugar beet leaves various non-imaging and imaging sensor systems were used.
3.5.1 ASD FieldSpecPro FR/ASD FieldSpecPro JR
Spectral reflectance was measured with two different handheld non-imaging spectro-radiometers, the ASD FieldSpecPro FR and the ASD FieldSpecPro JR (Analytic Spectral Devices (ASD), Boulder, USA). The spectral range of the ASD FieldSpecPro is from 350 nm to 1100 nm. Because the reflectance spectra data were noisy at the extremes, only values between 400 to 1050 nm were analyzed. The spectral sampling interval was automatically interpolated from 1.4 nm to 1 nm steps using a linear equation by the RS3 spectral acquisition
3.5. Sensor systems/Hyperspectral measurements
software (Analytic Spectral Devices (ASD), Boulder, USA). The spectral range of the ASD FieldSpecPro JR is from 350 to 2500 nm. The sampling inter-val is 1.4 nm from 350 to 1050 nm and 2 nm for the range 1050 to 2500 nm. Resultant reflectance values were afterwards interpolated by the RS3 software to 1 nm steps. Spectral jumps between the spectrometer’s detectors were re-moved using the ASD ViewSpecPro software (Analytic Spectral Devices (ASD), Boulder, USA). The instruments were warmed up for 90 min previous to mea-surement to increase the quality and homogeneity of spectral data. Instrument optimization and reflectance calibration were performed prior to sample ac-quisition. The average of 25 dark-current measurements was calibrated to the average of 25 barium sulphate white reference (Spectralon, Labsphere, North Sutton, NH, USA) measurements. For measurements on the leaf scale, a plant probe foreoptic with a leaf clip holder was used. The contact probe foreoptic has a 10 mm field of view and an integrated100 W halogen reflector lamp. The internal light source enables constant and reproducible illumination conditions. Thus, the integration time was adjusted to 17 ms per scan constantly. Finally, reflectance spectra were obtained by determining the ratio of recorded sample data to data acquired for the white reflectance standard. Each sample scan represented an average of 25 reflectance spectra. Because reflectance spectra were assessed under constant light and temperature conditions with the plant probe foreoptic, pre-processing to smooth the spectrum and to reduce signal noise was not necessary.
In each treatment (inoculated and non-inoculated sugar beet leaves), spectra from 15 plants and 2 leaves per plant from the adaxial leaf surface were taken. To realize a multi-temporal measurement, the sugar beet leaves were signed and the leaf clip was placed in the middle of the leaf beside the middle leave vein. Reflectance of leaves was measured with the ASD FieldSpecPro FR daily after inoculation, with the ASD FieldSpecPro JR 0, 7, 14, and 21 days after inocula-tion (dai). Measurements on the canopy level were conducted in a dark room. A pistol grip foreoptic was used and mounted on a tripod, 50 cm above the
3. MATERIAL AND METHODS
target canopy. To realize constant and homogeneous illumination conditions, three ASD-Pro-Lamps (Analytic Spectral Devices (ASD), Boulder, USA) sur-rounded the target area. Sugar beet plants, grown in boxes were placed under the optic and, using a field of view of 25◦, two areas of each plant box could be measured. For reflectance normalisation a barium sulphate white reference was centred under the pistol grip optic on the same level with the sugar beet canopy. Reflectance spectra were obtained with an integration time of 134 ms per scan, 25 averaged reflectance spectra resulted in one sample scan. Each sample scan was repeated five times, the plant boxes were measured daily from day 0 to day 21 after inoculation. The Savitzky-Golay filter (Savitzky and Golay, 1964), a simplified least square procedure was applied afterwards, in order to smooth the spectrum and to reduce the signal noise. A filtersize of 32 and polynomial degree of 4 were used as parameters for the Savitzky-Golay filter.
3.5.2 Hyperspectral camera system ImSpector V10E
Hyperspectral images were taken in a dark chamber using the hyperspectral imaging system ImSpector V10E (Spectral Imaging Ltd., Oulu, Finland), with a spectral range from 400 to 1000 nm (Fig. 3.2). The ImSpector V10E system is a line scanner with a spectral resolution up to 2.8 nm. The maximal image size of the sensor slot results in 1600 pixels per line with a sensor pixel size of 0.0074 mm. Limited by the distance between target and sensor system (0.60 m), a spatial resolution of 0.019 mm per pixel could be achieved. To obtain images from the target, a mirror scanner was mounted in front of the objective lens. The maximal field of view of the mirror scanner is 80◦. Using the software SpectralCube (Spectral Imaging Ltd., Oulu, Finland) the angle of the mirror scanner as well as the spectral and spatial resolution could be adapted manually to the target. Images on leaf level were taken with spectral binning 4 and spatial binning 1, on canopy level with spectral binning 4 and spatial binning 2. Frame rate and exposure time was adjusted to the chosen
3.5. Sensor systems/Hyperspectral measurements
binning and to the target. The camera system was focused manually to a calibration bar (Spectral Imaging Ltd., Oulu, Finland) with black rhombi on a white background, placed in the same distance to the camera as the target. During measurements constant illumination intensity was provided by ASD-Pro-Lamps (Analytic Spectral Devices (ASD), Boulder, USA) radiating a near-solar light spectrum. The distance between lamps and the leaf target was 50 cm with a vertical orientation of 45◦, between lamps and canopy target 80 cm. For subsequent calculation of reflectance, three images were grabbed. To examine the sensor sensitivity, a dark current image by closing an internal shutter of the camera and an image of a white reference bar (Spectral Imaging Ltd., Oulu, Finland), with the same horizontal size and on the same level like the target area were recorded, both with the same exposure time. Subsequently an image of the target area was recorded with improved exposure time.
Figure 3.2: Manual positioning XY-frame and hyperspectral sensor system ImSpector V10 with the mirror-scanner, surrounded by six ASD-Pro-Lamps. The XY-frame was developed by the technical service of the Institute of Agricultural Engineering, University of Bonn.
3.5.2.1 Technical setup
The hyperspectral sensor system ImSpector V10 was mounted on a manual po-sitioning XY-frame, developed by the technical service of the Institute of
Agri-3. MATERIAL AND METHODS
cultural Engineering, University of Bonn surrounded by six ASD-Pro-Lamps (Analytical Spectral Devices Inc., Boulder, USA), placed in a dark chamber (Fig. 3.2)2. In order to realize optimal and reproducible illumination and con-stant measurement conditions the plants were moved into the dark chamber. Starting two days after inoculation, hyperspectral images were taken daily until 21 dai. All measurements were recorded between 8:00 and 12:00 AM in order to reduce the effect of diurnal physiological changes in plant processes. For image acquisition on the leaf level, the pots with sugar beet plants were placed on mobile tables (0.8 m x 0.8 m, four plants per table) 2 dai. According to Chaerle et al. (2007a), the fifth fully developed leaf pair of each sugar beet plant was fixed horizontally on a frame between a grid patterns made of two layers of rubber laminated mesh wire (Fig. 3.3). The frame and the grid pattern were coated with a black, matte colour to reduce the reflectance of the material. The mesh wire largely avoided movements of leaves which were subdivided into equally-sized squares (2 x 2 cm) on the images.
Figure 3.3: Schematic diagram of sugar beet leaves fixed under a grid pattern. Two leaves per plant were chosen for multi-temporal hyperspectral imaging and were measured consecutively.
2