Cloud Supported Building Data Analytics
Ioan Petri1, Omer Rana3, Yacine Rezgui1, Haijiang Li1,Tom Beach1 Mengsong Zou2, Javier Diaz-Montes2 and Manish Parashar2
1School of Engineering, Cardiff University, UK
2 Rutgers Discovery Informatics Institute, Rutgers University, USA 3School of Computer Science & Informatics, Cardiff University, UK
contact author:[email protected]
Abstract—With increasing availability of instrumented in-frastructures in built environments, it is necessary to under-stand how such data will be stored, processed and analysed in a timely manner. Many “smart cities” applications, for instance, identify how data from building sensors can be combined together to support applications such as emergency response, energy management, etc. Enabling sensor data to be transmitted to a Cloud environment for processing provides a number of benefits, such as scalability and elastic provisioning of computational resources – as the total data size may not be known apriori. In this application-based case study, we describe the integration of an in-building sensor network (both for sensing and actuation) with a distributed Cloud environment. Energy optimisation in buildings represents a class of problems that requires significant computational resources and generally is a time consuming process. We describe the use of Cloud computing for efficiently running and deploying EnergyPlus simulations with sensor data in order to fulfil a number of energy related objectives for buildings. We describe and evaluate the establishment of such a sensor based application using a CometCloud implementation with data collection from a real building pilot. Although our focus is on a single application, the general architecture and analysis carried out can be generalised to other similar scenarios.
Keywords-Sensor Application, Cloud Computing, Comet-Cloud, EnergyPlus, Energy Efficiency.
I. INTRODUCTION
Recent research has revealed that buildings are the single largest contributor to global warming. Energy usage in built environments has grown in the last 20 years due to the growing demand for building, its services and comfort levels. This increase may be explained by the increasing tendency of the general population to spend more time in buildings, coupled with an increase in the global population, thereby leading to higher energy consumption. As these underlying factors are not attenuating, energy efficiency in buildings represents a prime objective for energy policy at regional, national and international levels. Studies have also indicated that although people and organisation are often aware of the benefits of using energy more efficiently, a variety of social, cultural, and economic factors often prevent them from doing so [1], [2]. Building controls and sensors have the potential to enable their users to be come more “active” consumers of energy (through smart metering, for instance).
Centralised building controls are often used to enable in-teractions between the different sensors, actuators, and con-trollers to perform appropriate control actions. Intelligent buildings have embedded monitoring and control equipment and the potential to reduce energy use along with operations and maintenance expenses, while improving comfort levels. For achieving an equilibrium in terms of consumption and comfort, these systems typically necessitate the deployment of a wide range of sensors (e.g., temperature, CO2, zone airflow, daylight levels, occupancy levels, etc.), which are, in turn, integrated through an Energy Management Control System (EMCS) and an array of electronic actuators, termi-nal unit controllers to process sensor outputs, and control set-points. In particular, sensor systems can enable building energy simulations – enabling users to optimise various associated aspects of building use over time.
Various types of sensors are used to monitor energy efficiency levels within a building, such as: (i) new solid-state meters for accurate usage levels, (ii) environmental sensors for measuring temperature, relative humidity (RH), carbon monoxide (CO), and carbon dioxide (CO2), (iii) temperature measurements using both mechanical (e.g., ther-mally expanding metallic coils) and electrical means (e.g., thermistors, metallic resistance temperature detectors (RTD), thermocouples, digital P-n junctions, infrared thermocou-ples) provide sufficient accuracy. When dealing with large buildings such as sport facilities, the accuracy of these sensors is often questioned, largely because of the significant drift that occurs after initial calibration. In some building, there are specific requirements for sensors when monitoring CO2 concentration, air flow, humidity, etc and these sensors are more expensive to use and deploy [7].
Energy optimisation demonstrates a real time use of sen-sor data, where a number of parameters need to be optimised based on a particular building representation. Based on such real-time readings from sensors it has become possible for building facility managers to take decisions in order to reduce energy consumption. As sensors can provide readings within an interval of 15-30 minutes, it is necessary for any simulation/ optimisation to also be carried out over a similar interval. Thus, the efficiency of the optimisation process depends on the capacity of the computing infrastructure
available.
There has also been a significant recent focus on the integration of sensor networks with decentralised distributed systems based on the emergence of various network and IP-based technologies. Cuzzocrea et al. [24] provide a survey of various sensor-based applications that make use of Cloud infrastructure to carry out data analytics and decision sup-port. Such “Sensor Clouds” enable users to collect, access, process, visualise, archive, share and search large amounts of sensor data from different applications. Sensor clouds also facilitate the sharing of sensor resources by different users and applications under flexible usage scenarios, for instance, a single multi-purpose sensor (i.e. one able to measure multiple parameters around its vacinity) may be re-used by multiple applications at different time period. Sensor clouds also provide users with a mechanism to handle sensor devices as part of a general purpose resource management system, thereby allowing scheduling and allocation systems to treat these as resources that can be allocated to users based on a variety of different scheduling strategies. Such sensor clouds can help to provision service instances automatically, to monitor sensors assets/resources and to control sensors via the use of a Web-based interface [13], [6].
Resource elasticity and scalability offered through Cloud computing enables researchers to explore complex problems in energy optimisation that are otherwise impractical or impossible to address [19], [18]. We describe how a Cloud-based infrastructure can be used to scale out energy simulation of a built environment – using a distributed Cloud infrastructure. Our deployment enables resources to be utilised across two physically separated Cloud environ-ments connected over the Internet. We make use of an open source Cloud platform, called CometCloud, that aligns well with the requirements of our simulation – carried out using a whole building energy simulation package (often employed by architects, engineers and researchers), called EnergyPlus. This time-step based simulation package can be used to model heating, cooling, lighting, ventilation and other energy flows within a building. In this paper we present how a CometCloud-based federated system can be efficiently used for running and deploying EnergyPlus simulation based optimisation in order to fulfil a number of energy related objectives. We develop a CometCloud infrastructure (in the UK and the US) to explore different scenarios where EnergyPlus simulations, seeded through sensor-based data, are processed. The reminder of this paper is organised as follows: sections I, II and III outline the development and use of Sensor Clouds, providing a key motivation for our research and analysing several related approaches. Section IV presents the model we make use of and explaining how CometCloud system has been utilized in our scenario. The evaluation of our implemented system is presented in section VI. We conclude and identify future work in section VII.
II. RELATED WORK
Recently researchers have investigated the integration of WSNs (Wireless Sensor Networks) with large-scale dis-tributed computing infrastructures to support data analy-sis and decision support. Examples include an integration architecture of Cloud computing and WSNs [8], Sensor-Web [9], SensorGrid [10], [11], [12], the Sensor-Cloud infrastructure [13], the BodyCloud architecture [16] and use of wireless sensors in buildings [17] etc.
In [8], a SaaS architecture for sensor network analyti-cal services is proposed. It is implemented atop a PaaS layer (e.g. Google App Engine , Microsoft Azure) and is organized into three layers: (i) sensor data management, focusing on the collection of sensor data streams from a SN gateway; (ii) filtering and analysis operations which involve the execution of processing workflows according to the pipe-and-filter paradigms; (iii) filter management, visualization and notification processes, which respectively allow for the definition and management of the processing filter chain, the visualization of the analyzed data and generation of notification events to a user or a subsequent process.
Chu et al. [9] propose the Open Sensor Web Architec-ture (OSWA) – an OGC (Open Geospatial Consortium) standards-compliant software infrastructure for providing service-oriented access to and management/ integration of sensors created by NICTA/Melbourne University. OSWA is designed around the conventional computing Grid layers: fabric, services, development and application. Specifically, the OSWA-based platform provides a number of sensor ser-vices such as sensor notification, collection and observation; data collection, aggregation and archive; sensor coordination and data processing; faulty sensor data correction and man-agement; sensor configuration and directory service. These services can be made use of various applications that involve collection of spatial data.
SensorGrid is a Grid framework for providing approxi-mate answers to aggregate queries on summarized sensor network data based on data compression and approximation paradigms. Aggregate queries are the basis for achieving Online Analytical Processing (OLAP) over sensor network readings in Data Grid environments. OLAP has a number of interesting applications for eScience, covering aspects such as visualization of scientific data, multi- dimensional analysis of data streams, privacy of multi-dimensional data [10], [11], [12], etc.
In [13], the authors propose a Sensor-Cloud infrastructure which can manage physical sensors accessible over a net-work. The Sensor-Cloud Infrastructure virtualizes a physical sensor on the Cloud computing platform, enabling such vir-tual sensors to be dynamically grouped and provisioned on-demand, primarily through a portal server interacting with the provisioning server, performing resource management and a monitoring server, monitoring real/virtual sensors.
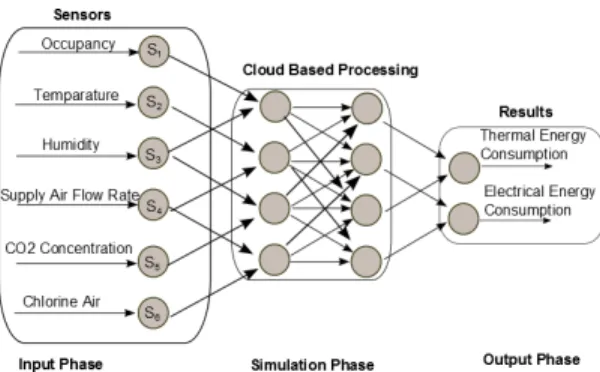
Figure 1: Sensor based deployment
SAaaS [14] is a cloud-enabled SaaS architecture for the management of wireless sensor and actuator networks (WSAN). SAaaS is a software stack that implement the following main functionalities: use of specialist (W)SNs, smartphones or other devices endowed with sensors and/or actuators, and their enablement for interoperation and man-agement in a cloud environment. It also enables exploita-tion of volunteer-based methods for node involvement, along with interfaces for federating SAaaS Clouds, either volunteer-based or those at a commercial organisation.
Our focus is on understanding how a Sensor Cloud could be constructed for a particular application use case. We focus on EnergyPlus and make use of an actual deployment to describe how data is captured, processed and analysed using an elastic (and distributed infrastructure).
III. APPROACH
Energy efficiency practises include passive design strate-gies which generally focus on building shape and orienta-tion, passive solar design, and the use of natural lighting. To improve efficiency and enable more active monitoring of buildings, energy management systems have been developed that provide advanced controls such as motion sensors and other wireless sensors that allow more detailed monitoring to be carried out with a higher frequency of data capture. Such sensors also enable an automatic and instant distribution of receiver-tailored and pre-processed information (raw data, consumption trends, deviation alarms, etc.). Smart meter sensors can perform triggered measurement and record of electricity, water, or gas consumption at different levels within a built environment/ facility (sub-metering) and allow for remote access to the consumption data (e.g.using Power Line, GSM, or standard wired communication protocols). In such systems, it is also possibly to dynamically alter the rate at which data capture takes place.
As the time associated with carrying out the energy optimisation process represents a key aspect, both facility managers (i.e. those responsible for managing the built environment) and infrastructure providers (i.e. those pro-viding the data analytics and networks platform) aim to minimise time and generate optimised set-points (identifying
particular control objectives that need to be met by the facility managers). The time parameter is also important in real-time optimisation where delays can bring additional costs for the facility managers especially when build related parameters (such as temperature, occupancy, etc.) are fre-quently changing. The complexity of this process increases depending on the size of the facility involved – such as a sports facility considered in this paper. In the context of this work, users are represented by building facility managers interested to minimise a number of objectives related to energy. Such users are interested in running the optimisation process and to obtain the required results in a limited time period. In practice, such an optimisation process will require multiple executions of an optimisation package, such as EnergyPlus, with different parameter ranges. We consider two key parameters here: (i) Complexity of the building model has a direct impact on the overall simulation time; (ii)Simulation period, i.e. the time interval over which the energy optimisation is carried out – can range from 1 week to 1 year, for instance. Similarly, the cloud system must comply with two parameters:
• Time-to-complete: An optimisation plan needs to be
completed by a particular time deadline. Assuming that sensors can deliver readings every 15 minutes, the optimisation process also needs to be carried out over an equivalent period. Each new execution uses as input the last configuration of the building and set points (for various control outputs) associated with the building.
• Results quality: An optimisation process, as identified in this study, consists of a number of EnergyPlus sim-ulations. Depending on the complexity of the building and the period to simulate, a time interval is associated with each optimisation process. If suitable computa-tional resources are not available, it may become nec-essary to sacrifice the quality of results and complete only a part of the required rounds of simulation in order to comply with the time deadline. Returning a partial optimisation result may have a twofold impact: (i) reduces the number of resources needed to carry out the simulation/ optimisation; (ii) influences the accuracy of the energy optimisation plan undertaken by facility managers.
For instance, if a computing resource provider decides to stop the optimisation process after a certain number of simulations – lower quality results will need to be returned to the user.
A. CometCloud
Our cloud system is built on top of CometCloud [20]. CometCloud is an autonomic computing engine based on the Comet [21] decentralized coordination substrate, and supports highly heterogeneous and dynamic cloud/grid/HPC infrastructures, enabling the integration of public/private
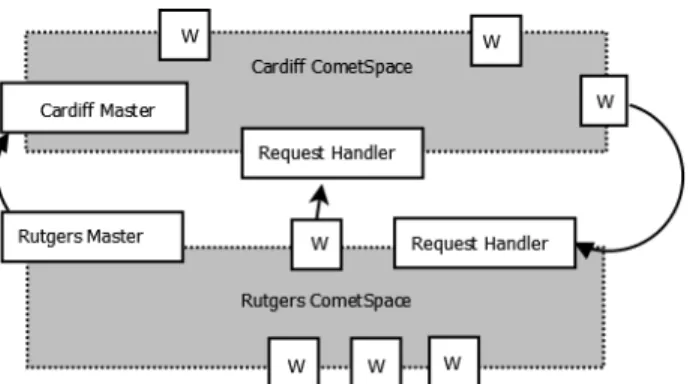
Figure 2: Cloud deployment between Cardiff and Rutgers Universities
clouds and autonomic cloudbursts, i.e., dynamic scale-out to clouds to address extreme requirements such as heterogeneous and dynamic workloads and spikes in de-mands [22], [23]. For the CometCloud system we consider that the tuple-space running at a site has a number of available workers and a master that receives requests: (i) locally – identifying tasks received from users at the same site; (ii) distributed – requests from remote users at the other site – via the use of a request handler. Figure 2 shows the deployment used in this scenario – as illustrated, computing resources at two sites are used (through a number of workers (W) at the Cardiff and Rutgers sites). Each worker in this case runs and EnergyPlus instance (described in section III-B), with requests management between sites coordinated through theRequest Handlers.
Conceptually, CometCloud is composed of a program-ming layer, service layer and infrastructure layer. The in-frastructure layer uses a dynamic self-organizing overlay to interconnect distributed resources of various kind and offer them as a single pool of resources. It enables resources to be added or removed from the infrastructure layer at any time as well as robustly deal with disconnects and failures. An information discovery and content-based rout-ing substrate is built on top of the overlay. This routrout-ing engine supports flexible content-based routing and complex querying using partial keywords, wildcards, or ranges. It also guarantees that all peer nodes with data elements that match a query/message will be located. The service layer provides a range of services to support autonomics at the programming and application level. This layer supports a Linda-like [22] tuple space coordination model and pro-vides a virtual shared-space abstraction as well as asso-ciative access primitives. Dynamically constructed transient spaces are also supported to allow applications to explicitly exploit context locality to improve system performance. Asynchronous (publish/subscribe) messaging and event ser-vices are also provided by this layer. The programming layer provides the basis for application development and management. It supports a range of paradigms including
the master/worker/BOT. Masters generate tasks and work-ers consume them. Mastwork-ers and workwork-ers can communicate via the virtual shared space or using a direct connection. Scheduling and monitoring of tasks are supported by the application framework. The task consistency service handles lost/failed tasks.
B. Energy Plus Application
EnergyPlus has been demonstrated to provide an effi-cacious tool for running energy simulations [3], [5]. This energy analysis software package enables thermal load sim-ulations, enabling an architect, engineer or facilities manager to carry out building performance simulations. Such simu-lations can include a pre-defined “run period” and involve the integrated coupling of building envelope (generally con-sidered as the physical separator between the interior and exterior environments of a building), lighting/daylighting, Heating, Ventilation AirConditioning (HVAC), service water heating and on-site energy generation (through solar panels and other sources). Based on a user description of a building, EnergyPlus can calculate the heating and cooling loads necessary to maintain thermal control setpoints, conditions throughout an secondary HVAC system and coil loads, and the energy consumption of primary plant equipment. In EnergyPlus, inputs and outputs are specified by means of ASCII (text) files. On the input side, there are two files:
• the Input Data Dictionary (IDD) that describes the types (classes) of input objects and the data associated with each object;
• the Input Data File (IDF) that contains all the data for a particular simulation.
• the Weather Data File (EPW) that contains all the data for exterior climate of a building.
In addition, EnergyPlus can be used as an energy sim-ulation engine employing a simultaneous load/system/plant simulation methodology. In load calculation, various meth-ods are available to calculate heat conduction through en-velopes and then a heat balance method for zone load. Moreover, EnergyPlus makes use of a modular, loop-based method to simulate HVAC systems which helps accelerate the modelling of a construction process [15]. Through the use of a Setpoint Manager in EnergyPlus, many different kinds of variables – such as supply air temperature and chilled water supply temperature can be controlled and this function enables the implementation of a supervisory control capability.
From a computational perspective, depending on the size of the building, the number and range of parameters being considered, EnergyPlus requires significant computational resources to execute. For relatively smaller building models (with a small number of surfaces, zones, and systems), which do not require large amount of computer memory, processor speed is generally more significant than I/O. For large models, main memory and internal cache have a greater
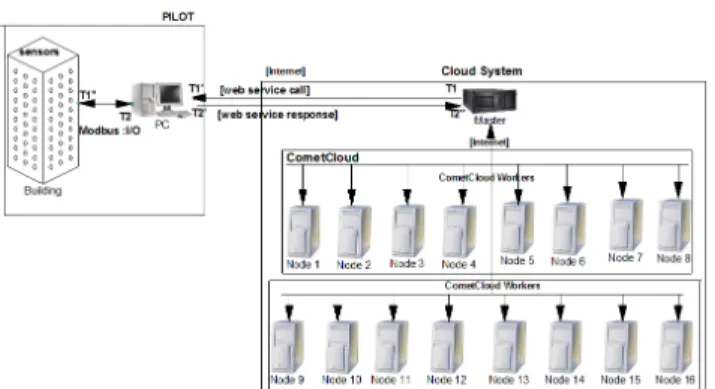
Figure 3: System deployment
influence on reducing run time. If an energy model run will produce lots of hourly or time step data, I/O access speed and latency also become important in reducing run time.
IV. FIDIAPILOT
We use sensor data from theSportE2project pilot called FIDIA1, a public sport building facility, located in Rome,
Italy. SportE2 is a research project co-financed by the European Commission FP7 programme under the domain of Information Communication Technologies and Energy Efficient Buildings. This project focuses on developing energy efficient products and services dedicated to needs and unique characteristics of sporting facilities. Figure 3 illustrates how the data from building sensors (on the left hand side) is channeled through a gateway node into the Cloud environment. The Cloud system contains a master node (as illustrated previously in figure 2) which is used to interact with a number of worker processes hosted on nodes at a local site. Master nodes across sites interact with each other to share resources across multiple Cloud deployments. Interaction between the gateway node and the CometCloud master node is through a Web Services interface.
A. Building properties
The building we have used in the pilot study has wooden external walls of 9cm and a wooden external roof of 9cm. The floor is made of concrete. The windows are single glass with a thermal transmittance of5.7W/m2Kand a solar gain of 0.7. The geometry of the building is composed of an Gable roof with Hmin = 3m and Hmax = 6m with window surfaces of about 70 m2. In addition the building pilot is structured as follows:
• Pool (indoor) size: 25m x 16m, depth: 1,60m to 2,10m,
Capacity: 760m3
• Learning Pool (indoor) size: 16m x 4 m, depth: 1m, Capacity: 64 m3
• 1 Gym (indoor) provided of electric equipment (electric bicycles, etc)
1http://www.asfidia.it
• 1 Fitness room (indoor) size: 18m x 9m x 3m, Volume: 486m3
• 1 Volleyball court (indoor) size: 40m x 28m x 8m, Volume:8960m3
• 2 Tennis/Five-a-side courts (outdoor, with changing rooms) size: 30m x 20m
The sports facility is equipped with sensors and actuators for monitoring, control and optimisation of the facility. The building has metering capability to determine consumption of electricity, gas, biomass, water and thermal energy. This data can be accessed through a specialist interface and recorded for analysis. The sub-metering of thermal and electrical consumption within grouped zones (gym/fitness and swimming pool is also provided along with “comfort” monitoring by functional area: gym, fitness room and swim-ming pool). In these areas the Predicted Mean Vote (PMV) index (which measures the average response of a group of people to a thermal sensation scale – such as hot, warm to cool and cold) – it is one of the most widely recognised thermal comfort models, and is measured as a function of the activity performed within a particular part of the building. The occupancy is also monitored in the gym, fitness room and around the swimming pool area. The structure of the facility does not allow the direct measurement of the total value of occupancy for the pilot, so the occupancy of the whole facility is provided as sum of number of people who have entered/exited the building over a particular time interval.
B. Sensors
In this subsection we describe how the various sensors are distributed throughout the building. In Table II we identify how various building parameters are measured by the available sensors. Each sensor can communicate via a gateway or can be directly linked (using wired infrastructure) with the pilot application server (identified as I/O to AS in the table).
iPoint sensors The iPoint sensors have the following char-acteristics:
• Temperature measurement range:−20◦Cto55◦C;
• Typical temperature resolution:0.01◦C; • Typical temperature precision:0.4◦C;
• Humidity measurement range: 0%RH to 100%RH; • Typical humidity resolution: 0.05%RH;
• Typical humidity precision: 3%RH;
An iPoint sensor sends data every 15 minutes, using a radio frequency of 868 MHz and has a transmitting range of 30-300 m and a autonomy of 1 year.
SHO100 sensor: An SHO100 is an active sensor, which measures relative humidity (%RH) and converts the mea-surement into an electric current between 4-20 mA or a voltage level between 0-10 V. It is intended for outdoor installation and for indoor areas where a more robust design is needed e.g. warehouse, swimming pool.
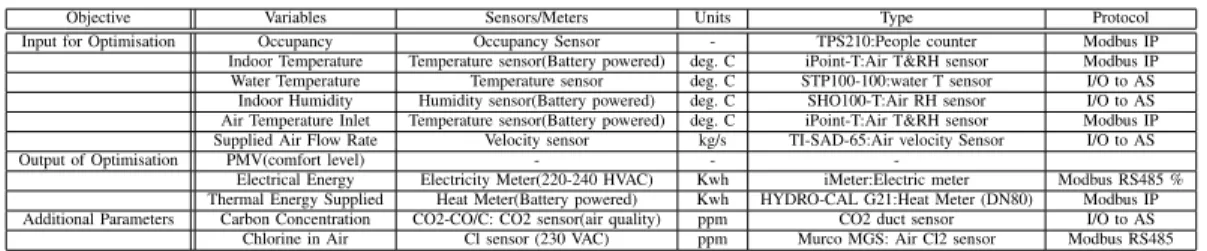
Table I: Sensor endpoints
Objective Variables Sensors/Meters Units Type Protocol Input for Optimisation Occupancy Occupancy Sensor - TPS210:People counter Modbus IP
Indoor Temperature Temperature sensor(Battery powered) deg. C iPoint-T:Air T&RH sensor Modbus IP Water Temperature Temperature sensor deg. C STP100-100:water T sensor I/O to AS Indoor Humidity Humidity sensor(Battery powered) deg. C SHO100-T:Air RH sensor I/O to AS Air Temperature Inlet Temperature sensor(Battery powered) deg. C iPoint-T:Air T&RH sensor Modbus IP Supplied Air Flow Rate Velocity sensor kg/s TI-SAD-65:Air velocity Sensor I/O to AS Output of Optimisation PMV(comfort level) - -
-Electrical Energy Electricity Meter(220-240 HVAC) Kwh iMeter:Electric meter Modbus RS485 % Thermal Energy Supplied Heat Meter(Battery powered) Kwh HYDRO-CAL G21:Heat Meter (DN80) Modbus IP Additional Parameters Carbon Concentration CO2-CO/C: CO2 sensor(air quality) ppm CO2 duct sensor I/O to AS Chlorine in Air Cl sensor (230 VAC) ppm Murco MGS: Air Cl2 sensor Modbus RS485
• SHO100-T includes selectable temperature sensors NTC1.8kΩ and NTC10kΩfor I/Net products.
• Output: Selectable 4-20 mA, 0 V ;
• Range : 0-95% RH ;
• Accuracy: 2% ;
• Supply : 24 Vac / 15-36 Vdc Power
STP-100:The STP100 is designed for immersion mounting in pipe systems with a separate pocket.
• Sensor element: NTC,1.8kΩat+25◦C(77◦F);]
• Accuracy: 0.5at0◦C; 0.3◦C at 25◦C;0.6◦C at
50◦C;0.9◦Cat75◦C;
Hydrocal G21:Hydrocal is a battery powered meter with a typical autonomy of 10 years. It has an associated working temperature interval of[5−55]◦C.
• IP54 protection
• 2,5 m3/h of nominal flow • Admitted flow: 0,05 to 5,0 m3/h • Nominal pressure: 16 bar • Output: light pulse
• Temperature sensor: PT1000 C. Optimisation description
In the FIDIA pilot optimisation scenario, the objective is to reduce energy consumption while maintaining indoor thermal comfort. FIDIA HVAC energy consumption con-sists of two components: thermal energy and electricity consumption, therefore energy consumption function can be described as follows: E = Et + Ee, where,Et and Ee
represent thermal energy consumption and electricity con-sumption respectively.E represents total energy consumed by the building facility.
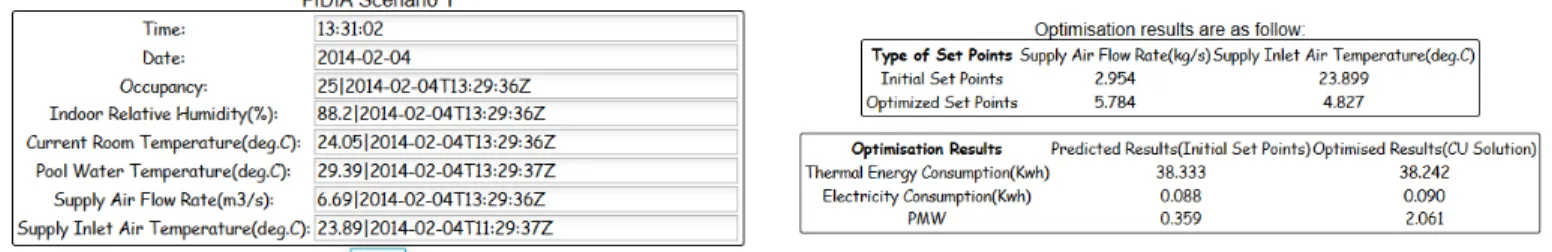
ConstraintsP M V is used as one constraint for the optimisa-tion model. As menoptimisa-tioned previously, the acceptable comfort zone is defined as −1< P M V <+1 in this scenario. VariablesThe input parameters and outputs are summarised in Figure 4.
V. IMPLEMENTATION DETAILS
CometCloud has been implemented in Java, although it also supports applications written in other languages – such as C and C++ – using a wrapper based approach. We deploy CometCloud on a cluster based infrastructure with 12 dedicated machines. Each machine has 12 CPU cores and
Table II: EnergyPlus Execution Time Run Period Execution Time
1 month 05:57s 3 month 11:52s 6 month 19:43s 9 month 27:59s 12 month 35:39s
3.2 GHz CPU speed. Each physical machine uses a KVM (Kernel-based Virtual Machine) virtualization environment with each entity (master,workers,request-handler) within our system occupying a single virtual machine. Each virtual machine runs Ubuntu Linux utilising one 3.2GHz core with 1GB of RAM and 10 GB storage capacity.
In our system workers, master and request handlers are running on a separate virtual instance and using the capa-bility of the virtual instance for their corresponding roles as follows: (i) workers are in charge of computing the actual tasks received from the request handler, (ii) the request handler is responsible for selecting and forwarding tasks to external workers from other federation sites and (iii) the master generates tasks based on the users requests, submits tasks into the tuple-space and collects results. We consider two sites in these scenario – one based at Cardiff and another at Rutgers. A federation site therefore refers to a deployment which is connected over a network and not co-located with a master node. The networking infrastructure is Gigabit Ethernet, with a measured latency on the network of 0.706ms on average. At this site, one EnergyPlus simulation takes in average 5 min 57.935 sec.
A user request represents a job defined as job : [input, obj, deadline], where input identifies the input data represented as [IDF, W,[param]], IDF represents the building model to be simulated, W represents the weather file required for the simulation, [param] defines the parameter ranges associated with the IDF file that need to be optimised [param] = [ri → (xm, xn)]. A
job obj represents the objective of the optimisation pro-cess objective : [outV arN ame, min/max], defining the name of the output variable to be optimisedoutV arN ame
and the target of the optimisation process min/max,
min:minimising theoutV arN ameormax:maximising the
(a) Input with sensor data (b) Output results Figure 4: Sensor application
interval associated with the job submitted.
A job contains a set of tasks N = {t1, t2, t3, ..., tn}
mapped into tuples within the CometCloud tuple-space. Each task ti is characterised by two parameters ti → [ID, data] whereID is the ID of the task,datarepresents one set of values generated from the combination of the pa-rameters ranges defining the job:[data] :f([parameters]), [data] : (p1, p2, p3, ..., pn), wherepi∈(xm, xn).
VI. EVALUATION
In our experiments we use two different configurations – (a) single cloud context where all the tasks have to be processed locally and (b) federation cloud context where the sites have the option of outsourcing tasks to remote sites. In the second part of the experiment, we also provide a comparison between cases when sites aim to compute a maximum number of tasks by a particular deadline. A. CometCloud system evaluation
We use as inputs for our calculation (i) CPU time of remote site as the amount of time spent by each worker to computer the tasks and (ii) storage time on remote site as the amount of time needed to store data remotely. Experiment 1: Job completed
In this experiment we consider jobs submitted by the user based on parameter ranges identified in Table III. In this instance, the the master has two different options: (i) running the tasks on the local infrastructure (single cloud case) or (ii) outsourcing (using a distributed infrastructure) part of the task to a remote site (federation cloud case).
Table III: Input Parameters: Experiment 1
P1 P2 P3 P4 Deadline
{16,18,20,22,24} {0,1} {0,1} {0,1} 1 Hour
In Table IV we present the results obtained after running the tasks using the two setups. As tasks generated based on the job parameter ranges have a corresponding deadline of 1 hour, only 34 out of 38 managed can be completed on the local cloud system. As these tasks represent EnergyPlus
Table IV: Results: Experiment 1 Single Cloud Federated Cloud
Nodes 3 6
Tasks 38 38
Deadline 1 hour 1 hour
Tuples exchanged - 15
CPU on remote site - 5626.45 Sec Storage on remote site - 1877.10 Sec Completed tasks 34/38 38/38 in 55min 40s
simulations, part of an optimisation process with a given building model, running only a set of the simulations can impact the quality of results provided to a user. A higher quality of results would imply running all the 38 tasks generated from the job input. In the second part of this experiment we have tested the federation scenario where part of the tasks are outsourced to a federation site. From Table IV we observe that the total number of nodes used to compute the tasks within a federation context is 6 workers which has a direct impact on the total time consumed with job completion. In the federation context all the tasks are successfully completed in 55 minutes by outsourcing a number of 15 task requests (represented as tuples in the CometCloud system) to the remote site. From experiment 1 we can conclude that it is beneficial to process as many tasks as possible on the local resources. This is only possible when the parameters ranges are small and consequently the number of tasks derived can be deployed exclusively on the local infrastructure. However, in the local site only 34 out of 38 tasks are completed. When the parameters ranges are large resulting in a larger number of tasks, the federation option can reduce cost and increase the quality of results. When outsourcing to remote sites more tasks can be completed as illustrated in Table IV.
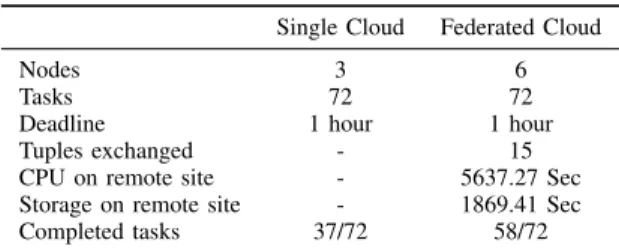
Experiment 2: Job uncompleted
In experiment 1 we explore the case when a significant percentage of the tasks can be completed on the local infras-tructure according to the given deadline. In this experiment we increase ranges associated with each of the parameters being considered and consequently the number of tasks that
need to be processed.
Table V: Input Parameter: Experiment 2
P1 P2 P3 P4 Deadline
{16,17,18,19,20,21,22,23,24} {0,1} {0,1} {0,1} 1 Hour
Table VI: Results: Experiment 2 Single Cloud Federated Cloud
Nodes 3 6
Tasks 72 72
Deadline 1 hour 1 hour
Tuples exchanged - 15
CPU on remote site - 5637.27 Sec Storage on remote site - 1869.41 Sec Completed tasks 37/72 58/72
As illustrated in Table V the parameters ranges are in-creased but we keep the same deadline of 1 hour. We observe that a deadline of 1 hour is too short for completing a higher number of tasks then in experiment 1. From Table VI it can be observed that in the context of a single cloud system (3 workers) only 37 out of 72 tasks are completed within the deadline of 1 hour. On the other hand, when using a feder-ation cloud setup with 6 workers, we observe that a number of 58 tasks are completed in the 1 hour deadline. This takes place by exchanging 15 tuples between the two federation sites, thereby increasing the overall cost associated with using remote resources. Contrary to experiment 1 where most of the tasks are successfully completed within the single federation cloud, in this experiment we observe that only 58 out of 72 tasks are completed. We can conclude that in some cases, according to the inputs of the users, neither single cloud or federated cloud is enough for completed all the tasks. However there is a significant improvement in terms of number of tasks completed that can be achieved when using cloud federation – in the context of experiment 2, 19 more tasks are completed by using federation. It must be noted, that the percentage of tasks completed has a direct impact on the quality of results. To enable a greater number of task completions, we need to increase the deadline. Experiment 3: On-demand job execution
In this experiment we observe how the system reacts to the availability of real-time data from building sensors. The objective is to better understand the overhead required to executed an EnergyPlus simulation dynamically, based on the availability of new data from sensors. In this experiment we run two different configurations: (i) multiple EnergyPlus instances are deployed locally within a single cloud environ-ment (i.e. Cardiff site) and (ii) multiple EnergyPlus instances are executed remotely (i.e Rutgers site) via outsourcing. Both of these configurations involved triggering of instances when new data becomes available.
Table VII: Input Parameters: Experiment 3
P1 P2 P3 P4 Deadline
{16,18,20,22,24} {0,1} {0,1} {0,1}
-Table VIII: Results: Experiment 3 Single Cloud Federated Cloud
Nodes 3 6
Tasks per job 38 38
Availability interval 5 min 5 min Average Overhead 33.15 milisec 40.97 milisec
Table IX: Results: Experiment 3- Multiple instances
Ranges/Time T1(18E+) T2(32E+) T3(48E+) T4(64E+) T5(72E+) R1(16-24) 1301.293 2100,495 3363,904 4182,82 4619,82 R2(16-28) 1522,07 3384,452 4924,17 6482,12 7929,21 R3(16-32) 1823,37 4523,14 5832,432 7111,34 9332,12
The input parameters of this experiment (provided in Table VII) are similar to those from Experiment 1. We use a predefined availability interval of 5 minutes to specify the frequency over which new sensor data becomes available – thereby leading to the submission of a new job (involving an EnergyPlus execution). From Table VIII it can be observed that on-demand job execution adds an additional overhead to job completion. We calculate an overhead per job as the difference between the expected time-to-complete and the actual time-to-complete. A local on-demand execution has an overhead of 33.15ms, whereas a remote on-demand execution has an overhead of 40.97ms per job. These are tolerable delays compared to the overall execution time of the job of an 1-1.5 hours. In addition, in Table IX we present the overhead recorded when launching Energy-Plus instances with different parameters ranges(R1(16-24)-R2(16-28)-R3(16-32)). We use a time-to-complete related to the number of EnergyPlus instances deployed(i.e. T1(18E+) is the time-to-complelete for 18 EnergyPlus instances). It can be observed that the larger gets the parameter range, the higher is the time-to-complete associated with the job.
VII. CONCLUSIONS
Energy efficiency practises include passive design strate-gies regarding building shape and orientation, passive solar design, and the use of natural lighting. Modern independent and wireless sensor technologies are allowing deeper moni-toring with increased frequency and to enable an automatic and instant distribution of receiver tailored and pre-processed information (raw data, consumption trends, deviation alarms, etc.). In this paper, we have investigated the problem of a sensor based cloud application by devising a real framework based on CometCloud. We show how our federation model facilitates EnergyPlus simulations to be deployed.
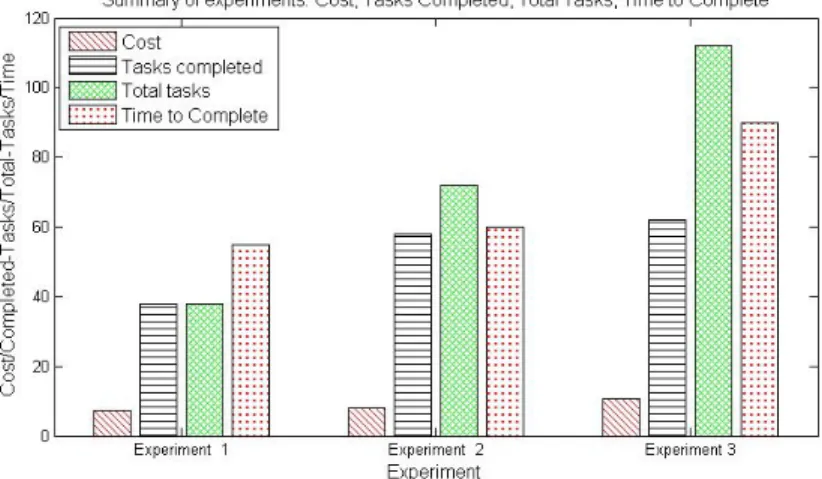
Figure 5: Summary of experimental results
We have presented the design and implementation of the proposed approach and experimentally evaluated a number of scenarios for sensor based cloud optimisation. The ex-perimental results have shown a number of benefits that our system provides with regards to task completion. By carrying out a number of experiments we emphasise that CometCloud can provide significant benefits for running real time EnergyPlus simulation tasks. From our experiments summarised in Figure 5, we can conclude that the higher the number of tasks to be processed the greater the optimisation results. As robust energy management needs to employ a set of computing mechanisms for addressing the end use and global energy consumptions, we use as inputs values from a pilot facility as recorded through the smart meters and a set of sensors, and carry out further processes for achieving a set of predefined set-points.
Acknowledgements: The research presented in this work is supported by EU FP7 SportE2 project, ICT for Energy Efficiency in European Sport Facilities.
REFERENCES
[1] P. De Wilde, M. van der Voorden, “Computational support for the selection of energy saving building components”, Proceedings of Building Simulation 2003, 8th International IBPSA Conference, pp. 11–14, 2013.
[2] CBECS, Commercial Buildings Energy Consumption Survey (CBECS), U.S. Department of Energy, Energy Information Ad-ministration, Available at: http://www.eia.doe.gov/emeu/cbecs/ contents.html. Last accessed: March 2014.
[3] N. Fumo, P. Mago and R. Luck, “Methodology to Estimate Building Energy Consumption Using EnergyPlus Benchmark Models.” Energy and Buildings, (42:12); pp. 2331-2337, 2010. [4] M. Yuriyama and T. Kushida, “Sensor-Cloud Infrastructure-Physical Sensor Management with Virtualized Sensors on Cloud Computing”, In Proc. of NBiS’10, 2010.
[5] V. Garg, K. Chandrasen, S. Tetali and J. Mathur, “Energy-plus Simulation Speedup Using Data Parallelization Concept”, ASME Energy Sustainability Conference, New York: Ameri-can Society of Mechanical Engineers. pp. 1041-1048, 2010. [6] Cohen, B. Dolan, M. Dunlap, J.M. Hellerstein and C. Welton,
“MAD Skills: New Analysis Practices for Big Data”, PVLDB 2(2), 2009.
[7] B. von Neida, D. Maniccia and A. Tweed, “An Analysis of the Energy and Cost Savings Potential of Occupancy Sensors for Commercial Lighting Systems”, Proc. Illuminating Engineer-ing Society of North America Annual Conference, pp. 433-459, 2010.
[8] W. Kurschl and W. Beer, “Combining Cloud Computing and Wireless Sensor Networks”. In Proc. of iiWAS09, 2009. [9] X. Chu, and R. Buyya, “Service-Oriented Sensor Web”. In:
Sensor Networks and Configuration. Springer, 2007.
[10] A. Cuzzocrea, F. Furfaro, G.M. Mazzeo and D. Sacca, “A Grid Framework for Approximate Aggregate Query Answer-ing on Summarized Sensor Network ReadAnswer-ings”. In Proc. of OTMW04, 2004.
[11] A. Cuzzocrea, F. Furfaro, S. Greco, E. Masciari, G.M. Mazzeo and D. Sacca, “A Distributed System for Answering Range Queries on Sensor Network Data”, in Proc. of PerComW05, 2005.
[12] A. Cuzzocrea and D. Sacca, “Exploiting Compression and Approximation Paradigms for Effective and Efficient OLAP over Sensor Network Readings in Data Grid Environments”, Concurrency and Computation: Practice and Experience, 2013. [13] M. Yuriyama, and T. Kushida, “Sensor-Cloud Infrastructure-Physical Sensor Management with Virtualized Sensors on Cloud Computing”, In Proc. of NBiS’10, 2010.
[14] S. Distefano, G. Merlino, and A. Puliafito, “SAaaS: a Frame-work for Volunteer-Based Sensing Clouds”. Parallel and Cloud Computing 1(2), 2012.
[15] R. K. Strand, “Modularization and simulation techniques for heat balance-based energy and load calculation programs: the experience”. In: of the ASHRAE Loads Toolkits and Energy-Plus, in: Proceedings of Building Simulation 2001, IBPSA, Rio de Janeiro, 747–753.
[16] G. Fortino, D. Parisi, V. Pirrone, G. Di Fatta, “BodyCloud: A SaaS Approach for Community Body Sensor Networks”. Future Generation Computer Systems, 2014, Vol. 35, n. 6, pp. 62-79. Elsevier.
[17] G. Fortino, A. Guerrieri, G. O’Hare, A. Ruzzelli, “A Flexible Building Management Framework based on Wireless Sensor and Actuator Networks”, Journal of Network and Computer Applications, 2012, Vol. 35, n. 6, pp. 1934-1952.
[18] L. Perez-Lombard, J. Ortiz, C. Pout, “A review on buildings energy consumption information”. Energy and Buildings, 394-398, 2010.
[19] D. Thain, T. Tannenbaum, and M. Livny, “Distributed Com-puting in Practice: The Condor Experience”, Concurrency and Computation: Practice and Experience 17, 323-356, 2008.
[20] CometCloud Project. http://www.cometcloud.org/. Last ac-cessed: August 2013.
[21] L. Zhen and M. Parashar, “A computational infrastructure for grid-based asynchronous parallel applications”, HPDC, pp. 229-230, 2007.
[22] N. Carriero and D. Gelernter, “Linda in context”, Commun. ACM, vol. 32, no. 4, 1989.
[23] M. Parashar, M. Abdelbaky, I. Rodero, A. Devarakonda, “Cloud Paradigms and Practices for Computational and Data-Enabled Science and Engineering”, IEEE Computing in Sci-ence and Engineering (CiSE) Magazine, to appear.
[24] A. Cuzzocrea, G.Fortino and O. Rana, “Managing Data and Processes in Cloud-Enabled Large-Scale Sensor Networks: State-of-the-Art and Future Research Directions”, DPMSS workshop alongside CCGrid 2013, Delft, The Netherlands, pp 583-588, IEEE Computer Society Press.