Working Paper
S e r i e s
1750 Massachusetts Avenue, NW Washington, DC 20036-1903 Tel: (202) 328-9000 Fax: (202) 659-3225 www.piie.com
Copyright © 2009 by the Peterson Institute for International Economics. All rights reserved. No part of this working paper may be reproduced or utilized in any form or by any means, electronic or mechanical, including
photocopying, recording, or by information storage or retrieval system, without permission from the Institute.
W P 0 9 - 6 A U G U S T 2 0 0 9
What’s on the Table? The Doha Round as of
August 2009
Matthew Adler, Claire Brunel, Gary Clyde Hufbauer, and Jeff rey J. Schott
Abstract
Th e Doha Round is the longest-running trade liberalization negotiation in the postwar era. Despite its longevity, the end is not yet in sight as parties disagree on the depth of liberalization necessary in agriculture and nonagricultural market access (NAMA). Th is rift is prolonging the Round’s completion and hindering the discussion of other important issues on the negotiating agenda, particularly services. To shed light on the debate concerning the benefi ts from Doha, this paper fi rst estimates, using three metrics, the potential gains from liberalization in agriculture and NAMA resulting from the specifi c “modalities” set forth in papers drafted by the chairs of the Doha negotiating groups. Next, the study estimates the benefi ts that could result from sector initiatives in chemicals, electronic/electrical goods, and environmental goods that go beyond the tariff cuts outlined in the negotiating modalities. Finally, prospective gains from liberalization of services barriers and improvements in trade facilitation are also analyzed. Overall, we estimate that the boost to global exports from concluding the Doha Round could range between $180 billion and $520 billion annually. Likewise, the potential GDP gains are signifi cant, between $300 billion and $700 billion annually, and well balanced between developed and developing countries.
JEL Codes: F1, F13, F18, L6, L8, L63, L65, Q1, Q50
Keywords:International Trade, World Trade Organization, Doha Round, Tariff Liberalization, Nontariff Barrier Liberalization.
Gary Clyde Hufbauer is the Reginald Jones Senior Fellow at the Peterson Institute for International Economics. Jeff rey J. Schott is a senior fellow at the Peterson Institute for International Economics. Matthew Adler and Claire Brunel are research assistants at the Peterson Institute for International Economics.
2 INTRODUCTION
Th e Doha Round of multilateral trade negotiations, which began in November 2001, will soon mark its eighth birthday, making it the longest-running negotiation in the postwar era. And the end is not yet in sight. Members of the World Trade Organization (WTO) continue to diff er on the depth of liberalization required in the areas of agriculture and nonagricultural market access (NAMA), thus hindering the discussion of other important issues on the negotiating agenda, particularly services. To date, the negotiating groups have elaborated general formulas for cutting tariff s and reducing agricultural subsidies but diff er sharply on how countries could limit or exempt certain products from these “formula cuts.” Negotiations on services have barely progressed from the initial off ers put on the table years ago, but talks on other issues are well advanced, including the agreement on trade facilitation measures and rules on the transparency of regional trading arrangements (already implemented on a provisional basis).
Doha participants have diff erent assessments on what has been accomplished to date. Some see the glass mostly full, with the formulas providing the backbone of liberalization commitments. Others worry that “fl exibilities” to exclude products from formula cuts will turn the backbone into a rubber hose and substantially water down the commercial value of a deal. To some, the prospective deal is signifi cant; to others, the deal seems a close approximation of the status quo and not worth doing.
Th e Doha Round needs to be completed for two key reasons. Th e fi rst is to implement the tariff and subsidy reforms embedded in the draft texts developed to date and pocket the gains already substantially agreed to. Th e second is to ensure the viability of the rules-based multilateral trading system. If
multilateral solutions are put on hold, national governments—pressed by their domestic constituencies— will look elsewhere to resolve trade and investment problems, either through unilateral measures or through bilateral and regional trade pacts. Failure in the Doha Round would cause irreparable harm to the WTO’s credibility as a negotiating forum, which would, over time, undermine its valuable dispute settlement mechanism.
A failure scenario is especially worrisome given the frailty of the global recovery from the
fi nancial and economic crisis and the possibility that a double dip recession will deliver prolonged high unemployment, resulting in pressures for more protection. Aware of this possibility, leaders of the Group of 8 (G-8) and the Group of 5 (G-5) at the G-8 Summit in July 2009 committed to concluding the Doha Round in 2010, citing a successful Round as one means of reviving the global economy.1 A few
weeks later, member countries of the Asia Pacifi c Economic Cooperation (APEC) forum also pledged to complete the Round by that deadline.2
Th e key to completing the Doha Round is to achieve meaningful cuts in trade barriers in 1. G-8 Summit, 2009, “Promoting the Global Agenda,” available at www.g8italia2009.it (accessed on July 24, 2009). 2. “APEC Ministers Push to Wrap Up Doha 2010 Talks,” Agence France Presse, July 21, 2009.
3
agriculture, NAMA, and services and to restrain recourseby major trading nations—developed or developing—to the ample “fl exibilities” allowed by the modalities. In other words, what counts is what the major trading countries agree to in their schedules on specifi c products and sectors in goods and services. Who are these countries? Overall, we consider participants in the G-20 summit process to have self-selected themselves for this leadership role in the Doha Round.
To shed light on the debate concerning the benefi ts from Doha, we fi rst estimate the potential gains from the liberalization in agriculture and NAMA resulting from the specifi c terms of modalities in papers drafted by the chairs of the Doha negotiating groups. We calculate the gains from formula cuts in trade barriers using three metrics:
Reciprocity measure: Th is metric calculates the change in revenue from tariff cuts in agriculture and NAMA and the revenue equivalent of concessions on nontariff barriers (NTBs), namely agricultural tariff quotas, domestic support, and export subsidies. Using this metric, concessions received are expressed in terms of tariff s and tariff equivalent costs not paid by exporting countries. Concessions given are expressed in terms of tariff s and tariff -equivalent barriers forgone by importing countries.
Trade gains: Th is metric indicates the increased trade that results from the tariff cuts and tariff equivalent of concessions on NTBs calculated in the reciprocity measure. Trade gains are separately stated for exports and imports.
GDP gains: Th is metric builds on the calculated trade gains by applying a GDP coeffi cient to increased exports and imports. It is important to remember that large exports and imports both
contribute to higher GDP through lower consumer prices, more variety, greater productivity, and improved allocation of resources (Bradford, Grieco, and Hufbauer 2005).
We clearly indicate the three metrics in the section headings and italicize them throughout the text. Next, we estimate the benefi ts that could result from sector initiatives in chemicals, information technology (IT) goods, and environmental goods that go beyond the liberalization that would result from the formula tariff cuts. We also calculate prospective gains from a 10 percent reduction by major trading nations in barriers to their imports of services. Th e 10 percent benchmark, which is arbitrary but optimistic, would yield large gains for both developed and developing countries. Finally, we estimate the benefi ts from enhanced trade facilitation measures, drawing on prior analyses by John Wilson, Catherine Mann, and Tsunehiro Otsuki (2005). In each of these sections, we calculate both trade gains and GDP gains.
Th roughout the study, we consider that both exports and imports deliver trade gains. Politicians and unions often take a mercantilist approach to trade: Exports are good and imports are bad. However, imports can result in large gains for the buying nation as well. Imports benefi t consumers in three
4
ways: Th ey deliver lower prices, better quality, and greater variety. Consumers are not just individuals; industries are consumers as well, and they benefi t from imports in the same ways. For example, greater variety allows industrial fi rms to “right size” their purchased inputs. Moreover, domestic fi rms learn from import competition: Often they boost their own productivity and improve the quality of their product lines. Leading exporting fi rms are often big importers.
Table 1 summarizes the trade gains we have calculated for the 22 countries in our sample. Th ese countries account for about three-quarters of world merchandise trade and 88 percent of global GDP. Total gains from what is “on the table” in agriculture and NAMA would be an increase in exports of $54 billion among the sample countries. Trade between these 22 countries (exports of the 22 countries to the sample) would increase by another $40 billion from a 10 percent liberalization of services barriers and by a further $50 billion from the three sector initiatives. In turn, the trade growth in table 1 (exports and
imports) would yield GDP gains for the 22 countries of $100 billion due to the modalities currently on the table in agriculture and NAMA (table 2). Bold new initiatives on liberalizing services and freeing trade in selective sectors would further increase GDP by an additional $100 billion each. Improvements in trade facilitation could yield additional GDP gains of $385 billion, if governments engage in wide-ranging policy and administrative reforms.
In sum, the Doha deal “on the table” would boost global GDP by $114 billion; if modestly “topped up” with additional liberalization in services and manufactures, the value of the Doha package triples to $341 billion.3
Th e United States would reap small trade gains in agriculture and NAMA (export and import gains of $6 billion and $14.3 billion, respectively). Th is result is not surprising since the United States already has free trade agreements or low barriers with many of the other 21 countries and explains why the deal on modalities has not attracted active support by US pro-trade constituencies. To acquire that support, the deal should be supplemented, particularly in services, which could add $10.8 billion and $3.5 billion, respectively, in export and import gains. In addition, “topping up” NAMA in several sectors could yield further gains ($6.1 billion and $5.5 billion, respectively, in exports and imports). Combined, we estimate US export gains of $22.9 billion and US import gains of $23.3 billion from a Doha deal with modest “top-ups.” Th e resulting GDP gains would be $38.7 billion.
Th e European Union stands to gain more from agriculture and NAMA reforms because its current barriers are higher. Th e formula cuts produce EU export and import gains of $9.2 billion and
$26.3 billion, respectively, generating GDP gains of $35 billion—the largest gains incurred by any
3. Th ese numbers were calculated scaling up the GDP gains of the 22 countries. Since GDP gains for the 22 countries in agriculture and NAMA are $100 billion, and these 22 countries account for 88 percent of global GDP, we estimate that global GDP gains will be ($100 billion/88)*100 = $114 billion.
5
of the six major trading nations. EU trade gains from services reform ($10.8 billion and $5.2 billion, respectively, in exports and imports) and from NAMA top-ups ($10.4 billion and $4.7 billion) are roughly comparable to the US results and would yield an additional $15 billion in GDP gains each. It is interesting to note that the European Union would be one of the main benefi ciaries of a sector agreement in environmental goods.
Japanese trade gains are most notable in NAMA, where exports will increase by $6.7 billion and imports by $2.5 billion, and in services, with exports increasing by $2.7 billion and imports by
$3.5 billion. In the three “top-up” sectors, Japan has barely any import gains, but gains can be signifi cant on the export side, notably a $6.5 billion increase in electronics and electrical goods. Th e total GDP gains
for Japan are smaller than those of the European Union and the United States in absolute numbers, but in relative terms, Japan is in line with the two other major nations (0.18 percent of GDP for formula tariff cuts, 0.09 percent for services, and 0.14 percent for NAMA “top-ups”).
As a result of liberalization undertaken in its WTO accession process, China has low tariff barriers in NAMA relative to other developing countries. Because its applied rates are already low, China could aff ord to cut them further without signifi cantly changing its competitive position. China’s agriculture and NAMA trade gains are concentrated on the export side, with gains of $14.3 billion, about twice as large as its import gains. Conversely, its gains from services reform are predominantly on the import side ($14.3 billion in imports versus $3.7 billion in exports). NAMA top-ups would yield greater balance between China’s export and import gains, if additional reforms are made in the electronic and electrical goods sectors. Combined, liberalization of goods and services would boost Chinese GDP by more than $60 billion.
India’s trade gains from both the formula cuts and Doha top-ups are much more muted, with the notable exception of import gains on services ($10.5 billion). Liberalization of services would generate an increase of more than $22 billion (or 2 percent) to Indian GDP and account for about two-thirds of India’s GDP gains from an expanded Doha accord.
Brazil’s trade gains are most prominent in exports of agriculture ($2 billion) and imports of services ($2.8 billion) and electronics and electrical goods ($3.9 billion). Formula cuts would boost Brazilian GDP by about $9 billion; services reforms would yield benefi ts of a similar magnitude. Including NAMA top-ups, Brazil could see a GDP increase of more than $33 billion (about 2.5 percent of GDP).
WTO members expect that the fi nal deal should provide relatively larger benefi ts for developing countries if Doha is to meet its goal of being a “development round.” Overall, we fi nd this to be the case.
In absolute numbers, trade gains in agriculture are larger for developed countries ($7.6 billion and $19.2 billion in exports and imports, respectively) than for developing countries ($6.4 billion and $1.4 billion). In NAMA, gains for the two country groups are of similar magnitude, but developing
6
countries gain more on the export side ($22.8 billion for exports versus $16.1 billion for imports), whereas developed countries gain more in imports ($29.5 billion in imports versus $17.6 billion in exports). Still, GDP gains from agriculture and NAMA formula cuts for developing countries amount to 0.30 percent of GDP ($31 billion), almost double the percentage increase for developed countries (0.18 percent, $68 billion).
In services, in a 10 percent liberalization scenario, the trade gains for developing countries are higher than for developed countries both in exports ($27.9 billion and $15 billion for developing and developed, respectively) and in imports ($40.9 billion and $14.8 billion, respectively). GDP gains for developing countries reach $66 billion (0.66 percent of GDP) compared with $34 billion for developed countries (0.09 percent of GDP).
In the three NAMA top-ups, the additional increase in trade from sector tariff cuts above the NAMA formula cuts is roughly equal for developing and developed countries on the export side, but developing countries gain more in imports. GDP gains, when all three sectors are liberalized, total $71 billion for developing countries (0.69 percent) and $32 billion for developed countries
(0.08 percent).
As for trade facilitation (where the numbers are less rigorous), trade gains for developed countries exceed those for developing countries, both in exports and imports. However, this result is biased by the methodology,4 and in percentage terms GDP gains for developing countries are greater. Developing
countries might expect GDP gains of 1.48 percent ($153 billion), while the GDP increase for developed countries might reach 0.61 percent ($232 billion).
We suspect that table 1 and the numbers discussed throughout this introduction will prove disconcerting to many readers: For the 22 countries, import gains across the board are larger than export gains! Th is, however, is no cause for alarm; the disparity between import and export gains is created by our data methods—not by poor bargaining on the part of our sample countries. We only cover tariff data on imports by the 22 sample countries. Th is means, for example, that we cover imports by the United States (a sample country) from, say, Vietnam (not a sample country), but we do not include exports by the United States to Vietnam. Th erefore, import gains are routinely larger than export gains. Th roughout the rest of this paper we rely on these unbalanced calculations because they are the most accurate that our data methods can generate. In table 3, however, we display a modifi ed version of table 1 with rough
calculations of exports to the world by the 22 countries. When this rough adjustment is made, import and export gains for the 22 countries are far more equal.
4. We use a conservative method that applied the OECD coeffi cient of increased trade due to trade facilitation improvements to all countries in the sample, including developing countries. Th e OECD coeffi cient, however, is lower than the estimated coeffi cient for developing countries.
7
Overall, we fi nd the prospective results from what has already been done in the Doha Round to be signifi cant but not suffi cient to marshal the requisite political support to close the deal and ensure its ratifi cation by member countries. We conclude that the “potential” exists for a good outcome in the Doha Round based on conservative assumptions as to how the major trading nations will use
“fl exibilities” in crafting their schedules of national commitments. In the text that follows, we summarize the potential aggregate gains and the resulting scorecard for fi ve key players: the United States, the European Union, Brazil, India, and China.
Th is working paper does not include an assessment of prospective results from the negotiating group on rules. Some of this work has already been implemented on a provisional basis (regarding regional trading arrangements). Disciplines on fi sh subsidies remain a work in progress and should add to the value of the overall package. With respect to antidumping procedures, we believe that the negotiations will leave intact nearly all current practices and rulings by the Appellate Body.
AGRICULTURE AND NONAGRICULTURAL MARKET ACCESS (NAMA) Data and Methodology
Our dataset, provided by the WTO, covers 22 countries, 7 developed and 15 developing.5 In 2008 these
countries accounted for 73 percent of world exports and 76 percent of world imports. Fourteen of the countries are G-20 summit participants.6 Th ese 14 account for 91 percent of G-20 exports to the world
and 96 percent of G-20 imports from the world (table 4).
Th e dataset contains, for each of these countries, the bound, most favored nation (MFN) applied, and, where applicable, preferential duty rates in 2006 for all tariff lines of traded goods at the 2-digit level of the HS code.7 Our methodology is detailed in appendix B. Th e tables give weighted averages of bound
and applied tariff rates. However, trade-weighted averages miss an important reform contemplated in the Doha Round—namely downward harmonization of rates. Sharp reductions in tariff peaks are masked by aggregate numbers on bound or applied tariff rate cuts, but the reduction of peaks is especially important in agriculture. Th at is why negotiators worry about “special” and “sensitive” products, categories that encompass goods with peak tariff s that importing countries are very reluctant to cut.
5. Th e 7 developed countries are: Australia, Canada, the European Union, Japan, Norway, Switzerland, and the United States. Th e 15 developing nations are: Argentina, Brazil, China, Colombia, India, Indonesia, the Republic of Korea, Malaysia, Mexico, Pakistan, the Philippines, South Africa, Taiwan, Th ailand, and Turkey.
6. Th e countries in our sample that are also part of the G-20 are: Argentina, Australia, Brazil, Canada, China, the European Union, India, Indonesia, Japan, the Republic of Korea, Mexico, South Africa, Turkey, and the United States. Th e G-20 summit members should not be confused with the G-20 developing-country caucus that was created just prior to the Cancun WTO ministerial in 2003 and coordinates the agricultural trade positions of its members in Doha Round talks.
7. HS stands for the Harmonized Commodity Description and Coding System. Th e level of detail goes to 8 digits and for some countries to 10 digits.
8 Results for Agriculture
Th e agricultural negotiations seek to eliminate export subsidies, sharply reduce tariff s and domestic farm subsidies, and expand tariff quotas. In this paper, we do not go into the details of the commitments for each product line but rather summarize the overall gains in agriculture for selected countries.
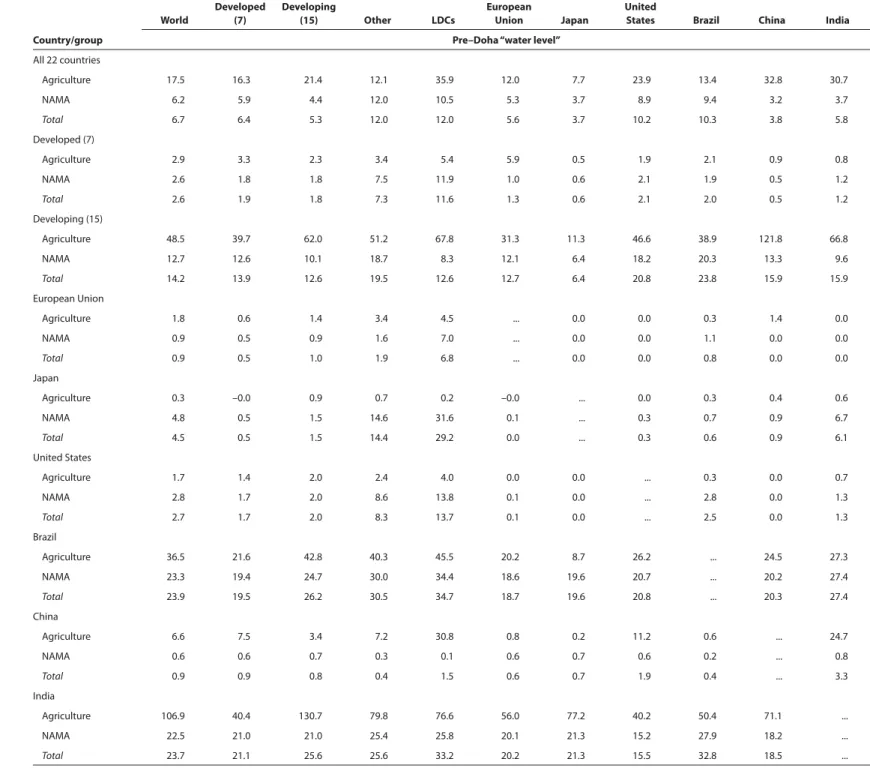
Table 5 shows the trade-weighted average bound and applied tariff rates, both pre- and post-Doha, for the sample group of all 22 countries and for 6 major trading nations that we will discuss in more detail: Brazil, China, India, the European Union, Japan, and the United States. For the group of all 22 countries, bound rates will be decreased from 25 to 18.2 percent. Th e US average pre-Doha bound rate is quite low, 3 percent, and will be reduced to 1.6 percent. Th e European Union has a higher average pre-Doha bound rate, 7.8 percent, but commits to a cut of almost half, bringing the post-Doha bound rate down to 4.2 percent. Among the leading developed countries, Japan has the highest average pre-Doha bound rate, 10.7 percent, which will be cut to 4.5 percent, a level similar to the EU post-pre-Doha bound rate.
Th e largest cuts in percentage point terms come from the three developing countries. India has a particularly high average pre-Doha bound rate (167 percent), which will be reduced by 36.6 percentage points to 130.4 percent. Th is is by far the largest cut in average bound rates, but the post-Doha average is still remarkably high. Brazil commits to cut its average bound rate by 9.6 percentage points, from an initial level of 40.6 percent to a new level of 31 percent. Th ese large cuts in bound rates for developing countries refl ect high pre-Doha bound rates in agriculture and show the workings of the Swiss formula for cutting tariff s.8
Tables A1 and A2 in appendix A show details of the pre- and post-Doha bound rates and the cuts in percentage points, respectively, for bilateral trade between selected country groups and individual countries. Particularly steep reductions can be observed in the rates applied to imports of agricultural goods by most developing countries from least developed countries (LDCs) and from China.
Cuts in bound rates may not create new opportunities for trade because the new bound rates are still higher than the old applied rates. However, bound rates are important because they lock in liberalization and provide insurance against large doses of new protection in the future via increases in applied rates. Although this gain is not quantifi able, it is an important benefi t of the Doha Round.
As a result of substantial unilateral liberalization over the past two decades, many developing countries impose tariff s at levels well below their WTO bound rates. Th ose countries have the right to raise such tariff s at any time without violating their obligations to other WTO members, and they value that fl exibility. In eff ect, countries that apply tariff s below their bound rates can have recourse to a “free
8. As detailed in appendix A, the Swiss formula applies larger percentage point cuts to high initial tariff s and smaller cuts to low initial tariff s.
9
safeguard,” i.e., a WTO-legal tariff increase equal to (or less than) the diff erence between the bound and applied rates. When the bound rate comes closer to (or even equal to) the applied rate, that reduces the scope of the “free safeguard” and gives greater policy security to the country’s trading partners.
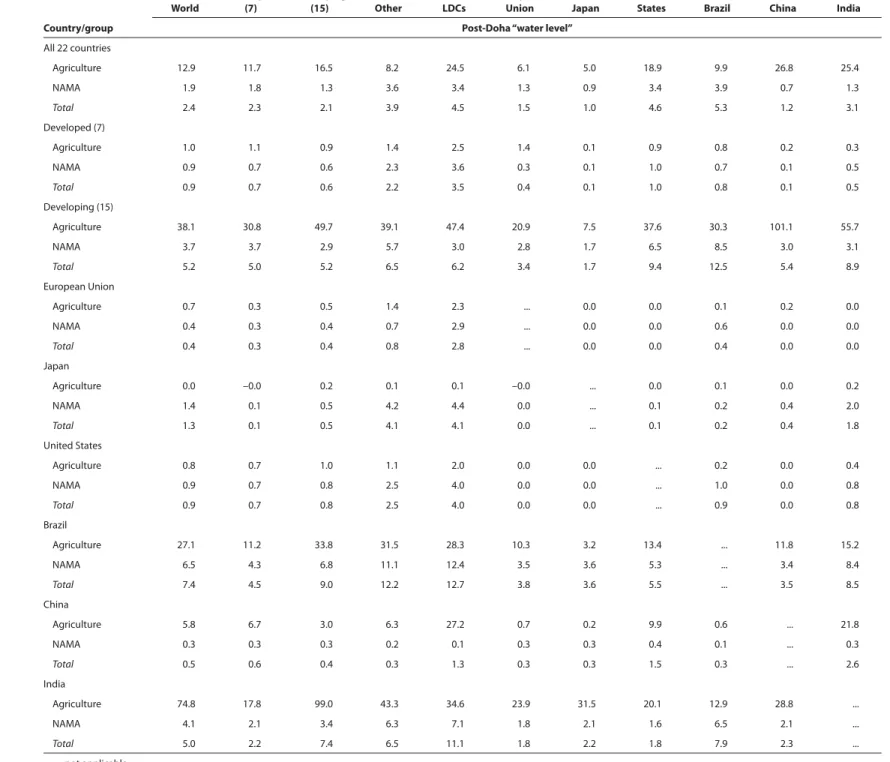
Column 3 of table 5 shows the pre-Doha applied rates (again, trade-weighted averages). As noted above, applied rates are often well below WTO bound rates because of unilateral liberalization. Th e diff erence between bound and applied rates, in percentage points, measures the “water” in the tariff schedule. Brazil and India have particularly high water levels. In fact, water levels are usually quite high in agriculture for developing countries (see table A3 of appendix A for detail). China is an exception as it recently acceded to the WTO and generally bound its tariff s at or close to the levels negotiated in its bilateral protocols.9
Table A4 in appendix A presents the trade-weighted average applied tariff rates for the 22 countries in the sample for 2001, 2006, and post-Doha. Between the beginning of the Doha negotiations in November 2001 and the end of 2006, some countries engaged in unilateral liberalization and reduced their applied MFN rates, sometimes substantially. China, for example, lowered its trade-weighted average applied MFN rates on agriculture from 49 to 16 percent. Korea and Mexico also signifi cantly decreased their trade-weighted average applied MFN rates on agriculture, from 79 to 14 percent and from
34 to 24 percent, respectively. In other words, key emerging countries have been liberalizing farm trade throughout the Doha Round talks. In fact, for some of those countries, the additional reduction from Doha commitments would be marginal compared with the unilateral liberalization they have already implemented over the past few years. A few countries, by contrast, raised their average trade-weighted applied MFN tariff rates in agriculture between 2001 and 2006 (e.g., Malaysia, Pakistan, and India). We see no reason why countries that have unilaterally reduced tariff s should not receive credit in WTO negotiations if they accept a legal obligation to maintain or “lock-in” the reforms. In other words, a country should be able to claim a negotiating credit for any increase in imports that is reasonably attributable to its unilateral liberalization. Indeed, we proposed such a process at the start of the Uruguay Round! For example, a country that liberalized imports of a product category, and experienced a rise in imports in that category of $500 million that can be reasonably attributed to the lower tariff , should be able to claim concessions of an equivalent amount in WTO negotiations (Hufbauer and Schott 1985).
Column 4 of table 5 shows prospective post-Doha applied rates. Applied rates are cut only when the pre-Doha applied rate of a specifi c tariff line exceeds the post-Doha bound rate for that tariff line. For the
9. According to the July 2008 package on agriculture, recently acceded members (RAMs) will be granted additional time to implement their Doha commitments if those overlap with commitments to be undertaken according to the accession process. Very recently acceded countries, namely Macedonia, Saudi Arabia, Tonga, Vietnam, and Ukraine, and small low-income RAMs, namelyAlbania, Armenia, Georgia, Kyrgyzstan, Moldova, and Mongolia, will be exempt from tariff reductions beyond their accession commitments.
1 0
group of 22 countries, the average trade-weighted applied rate will be reduced from 7.6 to 5.3 percent. Japanese and EU applied rates in agriculture are high for developed countries, and their commitments for reducing applied rates in agriculture are signifi cant (this is the case for imports from both developed and developing countries—see table A5 in appendix A). India will undergo much higher cuts in applied tariff s on agricultural imports than China or Brazil, because current Indian applied tariff s are much higher.
As for the United States, while US negotiators argue that the Doha Round must achieve “real market access,” meaning signifi cant cuts in foreign applied tariff s and subsidies, in fact the United States has committed to very little reduction in its own applied rates on agricultural imports. At present, the United States would reduce its weighted average applied rate by just 0.6 percentage points in agricultural goods, which is comparable with the commitments of major developing countries such as Brazil and China. On the other hand, India would reduce its applied rates on agricultural imports by 4.5 percentage points. However, US peak tariff s would be cut substantially due to the harmonizing eff ect of the formula cuts. Moreover, the United States and the European Union also contribute large cuts in agricultural subsidies (discussed below).
Th e United States subsidizes its farmers who grow “fi eld crops” (soybeans, wheat, corn, and cotton) and certain other products. Th e subsidies fall in two categories. Th e fi rst covers payments to farmers, which can be either direct payments decoupled from production and price or payments that compensate for adverse price movements. Th e second category covers price support programs (mostly for dairy and sugar). When the relevant price falls below a certain level, the US Department of Agriculture buys excess production to bolster the price.
Th e US proposal in July 2008 off ered to bring the ceiling for its overall trade-distorting domestic support (OTDS) from $48 billion to $15 billion.10 Developing countries argued that the off er was
insuffi cient since actual disbursements of subsidies are already well below $15 billion owing to the general rise in commodity prices over recent years. However, the US proposal would constrain an increase in subsidies when prices fall. Th e proposal as it stands, or anything more stringent, will require signifi cant changes in some US farm programs currently in force.11 But since the greatest concessions are usually
back-end loaded—i.e., implemented after a lengthy transition period—the current US farm bill would not have to be changed. Instead, in writing the next farm bill in 2012–2013, Congress would need to restructure US programs so that they remain consistent with the new WTO obligations.
Table A6 summarizes the prospective cuts in applied rates in percentage point terms. Neither developed- nor developing-country importers will appreciably decrease tariff s on LDC agricultural exports. Rates on LDC exports are already low across the board, except in a few developing-country 10. In October 2005, the United States had proposed decreasing the OTDS ceiling from $48 billion to $22 billion. 11. Kimberly Ann Elliott, “Last Gasp for Doha,” CGD Global Development: Views from the Center, Center for Global Development, July 25, 2008.
1 1
importers such as Brazil and India. China’s current applied rates are similar to those of Japan (9.6 and 10.4 percent, respectively), but China committed to Doha reductions that are much smaller, less than 1 percentage point compared with Japan’s 6 percentage points.
Table 6 shows the bound and applied rates in agriculture, pre- and post-Doha, imposed by Brazil, China, and India on the imports of the 15 developing countries in the sample. Again, Indian bound and applied rates stand out as extremely high, and Indian bound rates undergo large cuts. Brazil has particularly low applied rates on agricultural imports from the 15 developing countries. Th is is in part explained by the presence of Argentina in the group of 15 developing countries. Argentina accounts for a large proportion of Brazilian agricultural imports from the group, and much of trade between Argentina and Brazil is already duty-free under the Mercosur (Southern Common Market).12
Th e fi nal design of Doha “modalities” could aff ect which products are covered by prospective tariff cuts. One important example is the proposed Special Safeguard Mechanism (SSM), which allows developing countries fl exibility to protect their rural communities by raising temporary tariff s on
agricultural imports. According to one proposal, the SSM should cover all agricultural products imported by developing countries, with a single set of triggers, but diff erentiate between four country groups (developing, recently acceded, small and vulnerable, and least developed), and with a gradual phase-out.13
Reciprocity Measure
Leaving aside these important design details, in the following tables, we try to determine the gains from the concessions already outlined, using a method called reciprocity measure. We fi rst calculate the change in revenue from tariff cuts in agriculture and the revenue equivalent of concessions on tariff quotas, domestic support, and export subsidies. We then multiply tariff equivalents for all concessions by 2006 trade fl ows to “size up” the impact on the reciprocity measure. Th e general idea is that every billion dollars of reciprocity measure concessions have approximately the same impact on trade fl ows (see appendix B for more details). Table 7 summarizes the total reciprocity measure gains given and received by each country, in billions of dollars, distinguishing for agriculture between tariff cuts and concessions on nontariff barriers (NTBs), namely export subsidies, domestic support, and tariff rate quotas. Concessions given are tariff and tariff -equivalent revenues forgone on imports. Concessions received are reduced tariff s or tariff equivalents on exports.
Th ese calculations suggest that 44 percent of developed-country reciprocity measure concessions (in both agriculture and NAMA) arise in the agricultural sector (both tariff cuts and other concessions). On
12. However, there are notable exceptions to duty-free trade in Mercosur, and several of them are in agriculture. 13. Gary Hufbauer and Matthew Adler, “Th e Special Safeguard Mechanism: Possible Solutions to the Impasse,” note prepared for the World Bank and presented in Geneva, October 28, 2008.
1 2
the other hand, only 9 percent of developing-country concessions are made in agriculture. Looking at the country breakdown for the major developed economies, roughly half of EU and Japanese concessions, but only 10 percent of US concessions, come from agriculture. Interestingly, however, the majority of US reciprocity measuregains received come from agriculture. For developing countries, Brazil and China concede little in agriculture, in terms of both the reciprocity measure value in dollars and the percent of total concessions. Indian concessions in agriculture represent 30 percent of total Indian concessions, but the reciprocity measure value is small, only $200 million.
Table 7 shows that, in agriculture, apart from the European Union, all of the other major trading nations receive more gains from the liberalization of NTBs than from lower tariff rates, in reciprocity measure terms. Th e United States is the largest benefi ciary of NTB liberalization in reciprocity measure
terms ($2.4 billion), followed by Brazil ($1.6 billion). Th e European Union receives less than $1 billion in NTB cuts but gains $1.2 billion in tariff cuts, the largest gains of all six major trading nations.
In reciprocity measure terms, for concessions given from tariff cuts in agriculture, EU and Japanese concessions are signifi cantly higher than others (more than $2 billion compared with less than
$0.5 billion for the others). EU concessions in NTBs also dwarf those of the other fi ve countries (over $12 billion for the European Union, compared with $1 billion or less for each of the others). Tables A7 through A9 in appendix A show that EU concessions are large in all three categories of NTBs: tariff rate quotas, export subsidies, and domestic support. However, the magnitude of the fi gures is biased by the methodology. To calculate the tariff rate equivalents of these concessions, the method uses outlays notifi ed to the WTO over the last three years for which data are available, which, in the case of the European Union, were high. EU concessions are thus calculated on the basis of high outlay levels, which creates an upward bias in calculated concessions given. Th e European Union also has high trade fl ows in the products it subsidizes, another factor that contributes to a calculation of high concessions. Finally, after calculating the concessions in domestic support based on the modalities, the method checks to ensure that the total does not exceed the agreed OTDS limit. In the case of the European Union, the new total subsidies often exceeded the OTDS and needed to be cut further.
US agricultural concessions are larger in NTBs than in tariff s, in reciprocity measure terms. Nonetheless, US NTB concessions are still low ($1 billion). Th is can be partly explained by the methodology. Due to high commodity prices in the past few years, US outlays to farmers have been limited. Concessions are calculated from a low base since they are calculated using the last three years of notifi ed outlays.
Th e draft modalities propose the abolition of all export subsidies in agriculture. Aside from the European Union, the eff ects of eliminating export subsidies are limited (table A8 in appendix A). However, as previously discussed, despite the low impact of this measure, the lock-in eff ect is not negligible, and its advantages are especially evident in times of crisis.
1 3
Table A10 in appendix A gives a breakdown of the gains by partner. Th e reciprocity measuregain
for US exports to the 22 countries in the sample is over $3 billion. For the most part, that gain comes from concessions by the European Union (almost $2 billion). In addition, the United States will gain $1.4 billion on the import side. Reciprocity measure gains for Brazilian exports are over $2 billion. Once again, the majority of the gains come from concessions by the European Union.
In terms of the shares of agricultural concessions, our calculations show that 93 percent will come from developed countries, while only 7 percent will originate from developing countries (table 8). Th erefore, developed countries will do the heavy lifting. Th e distribution of the reciprocity measure gains is the opposite. Forty-eight percent of the gains in agriculture accrue to the developing countries in the sample and 37 percent to the developed countries in the sample.14 Brazil, despite conceding roughly
nothing in agriculture, receives 9 percent of the gains, meaning its exports will benefi t from lower tariff s and NTBs in partner countries. Brazil benefi ts from the liberalization of others while keeping its own barriers up.
Th e breakdown by country shows that, among developed economies, the European Union makes the most total concessions, followed by the United States, and then Japan. EU concessions are particularly important in agriculture, which refl ects the fact that the European Union has long maintained high tariff s in agriculture, its most sensitive sector. Despite a large share of concessions in agriculture (64 percent), the European Union does not capture a large portion of reciprocity measure gains (only 8 percent).
Th e United States, which makes 6 percent of total agricultural concessions, will receive 14 percent of total agricultural gains, in reciprocity measure terms. Th ese fi gures include export subsidies, domestic support, and tariff quota expansions. As discussed above, US agricultural tariff s are low, but US domestic subsidies are high. Developing countries are particularly intent on obtaining US commitments to reduce those subsidies, but they have yet to achieve their goal. Farm support is a highly sensitive issue for the United States, and only large concessions in NAMA or services will generate the necessary political support in Congress to enact signifi cant cuts in farm support.
Trade Gains
Table 9 calculates the increase in trade owing to tariff cuts in agriculture, using the elasticity of trade to tariff cuts calculated in table A11 in appendix A. In other words, table 9 refl ects the trade gains in agriculture that will result from reducing applied tariff rates by the amounts shown in table A6 in appendix A. Table 9 also calculates the increase in trade generated by cuts in tariff quotas, domestic support, or export subsidies, based on the tariff equivalents produced in the reciprocity measure.
14. Th e remaining 15 percent of gains accrue to the rest of the world, since those countries also benefi t from liberalization by the 22 countries in the sample.
1 4
Table A12 in appendix A gives bilateral detail of trade gains from tariff cuts and concessions in NTBs. Th e total increase in agricultural exports of the 22 countries in the sample to the other
21 countries is estimated at $14 billion, 5.2 percent of 2006 agricultural exports. Th e majority of trade gains within the sample (exports of the 22 countries to the rest of the sample), an increase of 3.3 percent, is due to NTB concessions, and the remaining 2 percent is due to tariff cuts. Gains in agricultural exports to the group of 22 countries (not the world) due to tariff cuts amount to roughly 2.5 percent of exports each for the European Union, Japan, Brazil, and China.15 Th e comparable fi gures for the United States
and India are 1.3 and 1.1 percent, respectively.
Export gains from NTB concessions are more signifi cant, except in the case of EU exports, which gain only 1.2 percent. Overall, EU agricultural exports to the other 21 countries will be boosted by around 4 percent, notably to Japan and India. Japanese exports will experience the sharpest rise from NTB concessions, 25 percent, but this represents an absolute increase in total agricultural exports for Japan of less than $1 billion. Th e growth numbers for Japanese agricultural exports are very large but the absolute number is small because Japanese agricultural exports are low.
US exports of agricultural products due to NTB concessions will increase by roughly 4 percent to the group of 22 countries. Brazil will also benefi t signifi cantly from NTB concessions, with exports rising by 6 percent. In total, US agricultural exports will grow by around 5 percent. US exports to the European Union will witness the largest growth, 28 percent total, including almost 26 percent due to EU NTB concessions. US exports to India will notably increase by 6 percent.
Th e total increase in agricultural imports of the 22 countries of the sample from the world is $20 billion, 6.2 percent of 2006 agricultural imports. EU concessions in NTBs will lead to an increase in EU agricultural imports of 16 percent. Cuts in EU agricultural tariff s will increase EU imports by an additional 2.7 percent. Th is large increase in EU imports from the world (nearly 19 percent) can be explained by high pre-Doha EU levels of protections, which kept imports low, and by large EU concessions in NTBs. EU NTB concessions will notably increase imports from India by almost 11 percent.
Japanese agricultural imports from the world will increase by 5.7 percent, mostly due to cuts in tariff s (4.7 percent) rather than in NTBs (1 percent). Japan will see greater import increases from the European Union, the United States, Brazil, and China.
Th e United States will experience a smaller increase in agricultural imports, 2.3 percent, with a majority (1.6 percent) because of concessions in NTBs. US agricultural imports will grow particularly from developing countries, a 4.3 percent increase from Brazil, 4.4 percent from China, and 2.9 percent
15. Note that the calculations are not symmetrical: While import numbers have been calculated for imports from the world, the data did not allow us to calculate exports to the world, so the table reports exports to the group of 22 countries in the sample.
1 5
from India. Brazil, China, and India will see small import increases due to tariff cuts, below $0.2 billion for each country, though this represents a signifi cant percentage increase in agricultural imports for India (3.5 percent from the world, as much as 6 percent from developed countries, and almost 10 percent from Brazil), all from a low base.
Results for NAMA
Nonagricultural market access (NAMA) products account for around 90 percent of world exports. Th ey are the “big boy” in world merchandise trade.
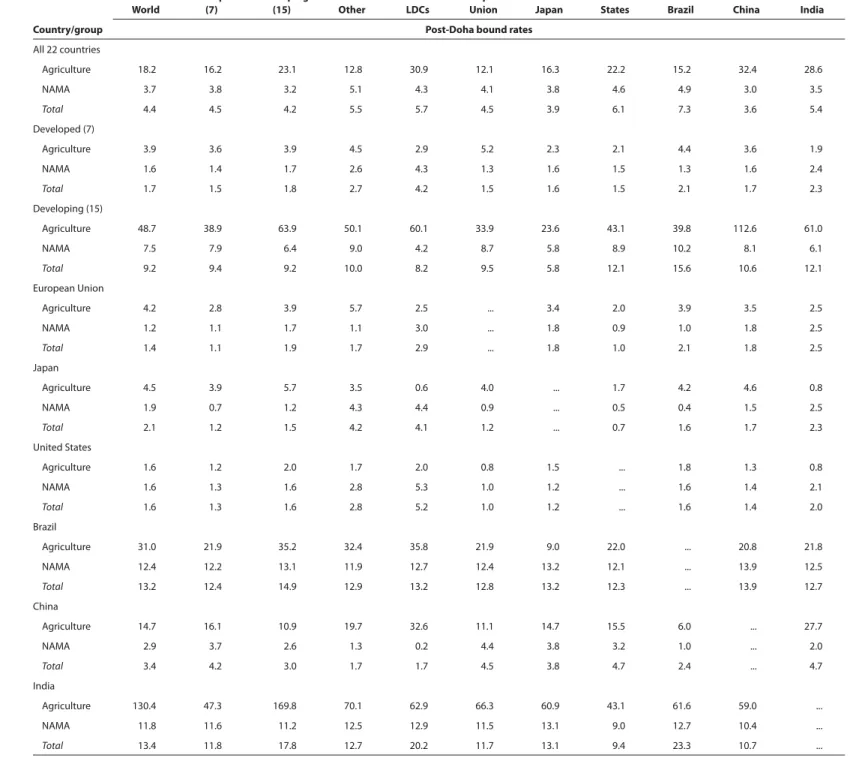
Table 10 shows the pre- and post-Doha bound tariff rates (trade-weighted averages) in NAMA for the entire group of 22 countries and the 6 major trading nations. Th e group of 22 countries will cut its average bound rate from 8.6 to 3.7 percent. Th e United States and Japan have higher average levels of bound rates than the European Union. After the Swiss formula is applied, however, all three countries will have roughly similar average bound rates.
Among the developing countries, China commits to small cuts in its average NAMA bound tariff s because, as a recently acceded country to the WTO, China has signifi cantly reduced its bound rates over the past few years. In fact, while the pre-Doha bound rate for China is only 4.1 percent, the comparable fi gures for Brazil and India are 30.3 and 30.4 percent, respectively. Brazil and India stand out for making substantial concessions in their average NAMA bound tariff s, reductions of roughly 18 percentage points each. Th ese are evenly spread out between diff erent trading partners (see tables A1 and A2 of appendix A for a breakdown by partner).
Tables A1 and A2 present bilateral detail of pre- and post-Doha bound rates, with the cuts in bound rates expressed in percentage points. Both the United States and Japan will make important reductions to their bound rates on NAMA imports from LDCs.
Column 3 of table 10 provides the weighted average of pre-Doha applied duties for NAMA goods. Applied rates in NAMA are cut according to the methodology in appendix B only if the current applied rate is higher than the post-Doha bound rate. Th e “water level” in NAMA is much lower than in agriculture (see table A3). Only Brazil and India maintain high water levels.
As in agriculture, applied rates are lower than bound rates because of unilateral trade liberalization in NAMA goods since 2001. In fact, table A4 shows that all of the 15 developing countries in the sample decreased their NAMA MFN rates between 2001 and 2006. Some countries that undertook particularly steep liberalization include India, whose MFN rate dropped from 21 to 8 percent, Pakistan from 20.9 to 12.8 percent, Taiwan from 3.5 to 1.6 percent, and China from 11.2 to 3.6 percent. Compared with other developing countries, China has relatively low tariff barriers to world NAMA imports (3.5 percent as a weighted average, table A5), as a result of the liberalization undertaken when it acceded
1 6
to the WTO in late 2001. Because its applied rates are already low, China could aff ord to cut its existing rates even further without signifi cantly changing its competitive situation.
Column 4 of table 10 shows the post-Doha applied rates. On average, the group of 22 countries reduces its applied rate from 2.4 to 1.8 percent. Th e applied rates of each of the 6 major trading nations on NAMA imports are signifi cantly lower than on agricultural imports. However, despite low trade-weighted averages, relatively high tariff peaks still persist on some tariff lines. Th e United States, the European Union, and Japan arrive at similar levels of applied rates after the cuts (0.7, 0.8, and 0.5 percent, respectively). Developing countries start at higher applied rates, but on a percentage point basis, all 6 major trading nations commit to comparable cuts in NAMA applied rates, with Brazil slightly ahead.
Table A6 in appendix A presents the cuts in applied rates broken down by partner. US NAMA exports will benefi t from larger tariff cuts by Brazil and China. Th e United States will cut tariff s on NAMA imports from LDCs by 3 percentage points, much higher than on any other import category. China and Brazil, and to a lesser extent India, will cut tariff s on NAMA imports from the European Union, United States, and Japan more than on other imports.
Looking at South-South trade, the progress in lowering NAMA applied rates by Brazil, China, and India on imports from the 15 developing countries is quite small (table 11). Th e lack of progress on liberalizing South-South trade remains a major obstacle to achieving the goals of a development round. Reciprocity Measure
Th e reciprocity measure gains from liberalization of NAMA are calculated in table 7, and the breakdown by trading partner is shown in table A10 in appendix A. In terms of concessions given, China and Brazil stand out in NAMA, compared with their concessions in agriculture. In terms of concessions received, China will be by far the main benefi ciary of NAMA liberalization (over $12 billion in reciprocity measure
terms, so $12 billion less of tariff s to pay, or 29 percent of gains). Th e European Union and Japan will also reap signifi cant gains (around $7 billion and $6 billion in reciprocity measure terms, or 17 and 15 percent, respectively). Th e United States reaps about 6 percent of NAMA gains, in reciprocity measure
terms. Th e modest fi gure for the United States refl ects the fact that several countries covered in the sample already have free trade agreements with the United States—namely, Australia, Canada, and Mexico.16 Table A10 shows that developing countries will see the greatest reciprocity measuregains from
the European Union and the United States, with China capturing more than $4 billion from each. As can be seen in table 8, it is in NAMA that developing countries account for the highest share of 16. Th e European Union had agreements with Norway and Switzerland through the European Free Trade
Association (EFTA) and with Mexico, Turkey, and South Africa, but the latter three are small trading partners of the European Union.
1 7
concessions (36 percent) and capture the highest share of gains (57 percent), in reciprocity measure terms. All three key emerging markets studied—China, India, and Brazil—make larger concessions in NAMA than in agriculture, although the numbers are roughly equal for India. India captures higher gains in NAMA than in agriculture.
Trade Gains
NAMA trade gains for the group of 22 countries will be an increase in trade fl ows among the group (exports from the 22 to the rest of the group) of $40 billion. Despite contributing only one-third of concessions, developing countries see an increase in NAMA imports equal to that of the developed countries, 0.7 percent (table 9 and appendix table A12). Th e increased exports by developing countries are mostly to the European Union and Japan. US export gains are small, but again, the United States has already liberalized trade with important countries in the sample. We estimate that LDCs will see a 3 percent increase in NAMA exports to the United States. Chinese NAMA exports will see sizeable increases to the European Union, Japan, the United States, and Brazil. Indian NAMA exports will grow by roughly 3 percent to the European Union and by 2 percent to the United States. Th e European Union, Japan, and the United States will all see signifi cant increases in their exports to Brazil and China.
Th e statistical analysis in this paper does not cover NTBs in NAMA. Progress in cutting NTBs on NAMA goods will emerge largely out of the sector discussions. Th is is the main open issue in NAMA. Sector agreements would provide deeper cuts and reforms of NTBs, on a comprehensive or partial basis. At the Hong Kong ministerial in December 2005, the parties suggested that participation in sector agreements would be voluntary. Fourteen sectors are being considered for sector agreements.17 In later
sections of this paper, we analyze two of those sectors where progress would yield sizeable benefi ts: chemicals and electronic products. In addition, we study the environmental goods sector, which is being discussed in the negotiating group on rules and where topping up NAMA liberalization could also produce large gains.
GDP Gains
Table 12 estimates the GDP impact of the trade gains. Th e calculations in table 12 are based on the trade gains in table 9 for agricultural tariff cuts, agricultural NTB concessions, and NAMA formula tariff cuts. Both imports and exports raise a country’s GDP through a variety of channels, and so far as econometric evidence indicates, the positive impact of large imports is about the same as the positive impact from
17. Th e 14 sectors are: automotive and related parts, bicycles and related parts, chemicals, electronics/electrical products, fi sh and fi sh products, forestry products, gems and jewelry products, raw materials, sports equipment, healthcare, pharmaceutical and medical devices, hand tools, toys, textiles, clothing and footwear, and industrial machinery.
1 8
an equivalent rise in exports. Hence the GDP metric refl ects the gains from both increased exports and increased imports. Th e GDP calculations use an elasticity of trade openness to GDP of 0.2 for developed countries and 0.5 for developing countries.18 For example, in the case of a country with a GDP of $100, if
trade goes from $40 to $50, trade openness rises from 0.4 to 0.5, a 25 percent increase. Th en the elasticity implies that the GDP will increase by 5 percent (0.2*0.25) if it is a developed country or by 12.5 percent (0.5*0.25) if it is a developing country.
Th e GDP impact for the European Union is $35 billion (0.21 percent), for the United States $17 billion (0.12 percent), and for China $20 billion (0.60 percent). For the United States and China, the gains come primarily from NAMA. Th e European Union, on the other hand, benefi ts equally from both. Th e weighted average of the percent increase in GDP for all 22 countries is 0.20 percent (0.06 percent from agriculture and 0.14 percent from NAMA). Th e total dollar gain calculated from the formula tariff cuts in agriculture and NAMA, and from NTB concessions, for all 22 countries in the study comes to about $100 billion ($30 billion from agriculture and $69 billion from NAMA). Since the sample countries represent 88 percent of world GDP, we project the annual increase in global GDP from the formula tariff liberalization in agriculture and NAMA to be $114 billion. Th is gain would be fully realized after a few years. Th is fi gure, however, is probably an underestimate as it does not include gains from the reduction of nontariff barriers in NAMA nor additional liberalization that could arise from sector negotiations and from scheduling deeper cuts in specifi c products. Also, it does not refl ect the possible GDP gains from the liberalization of services trade or from trade facilitation, discussed later. Diff erent Negotiating Scenarios
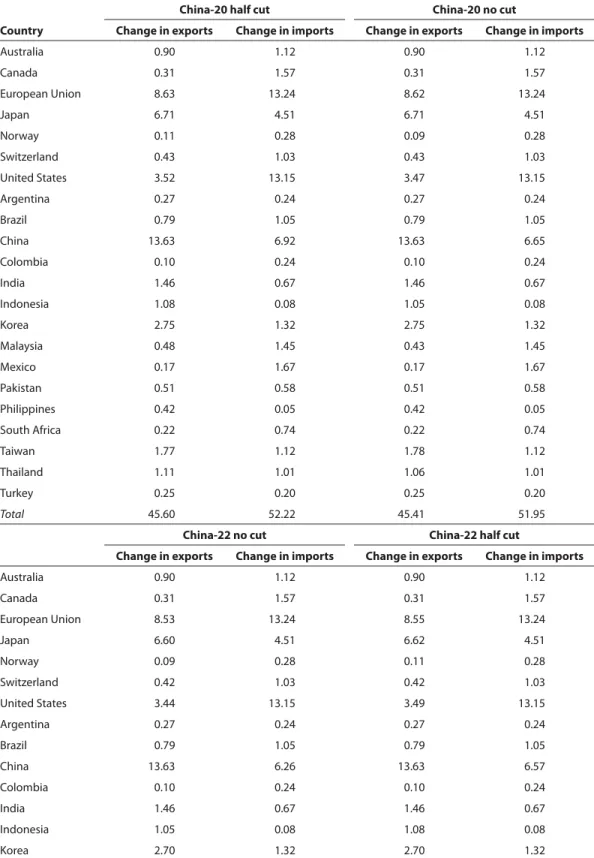
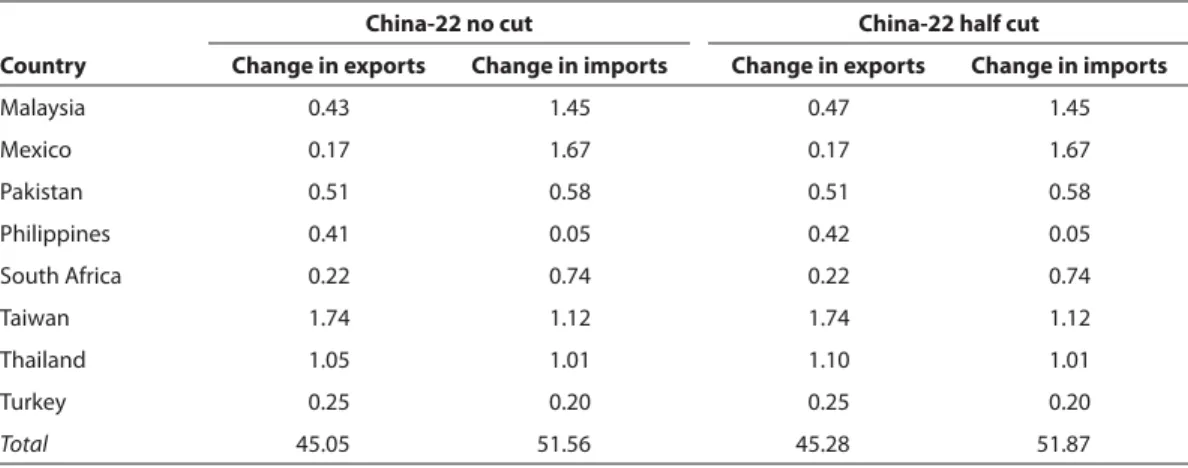
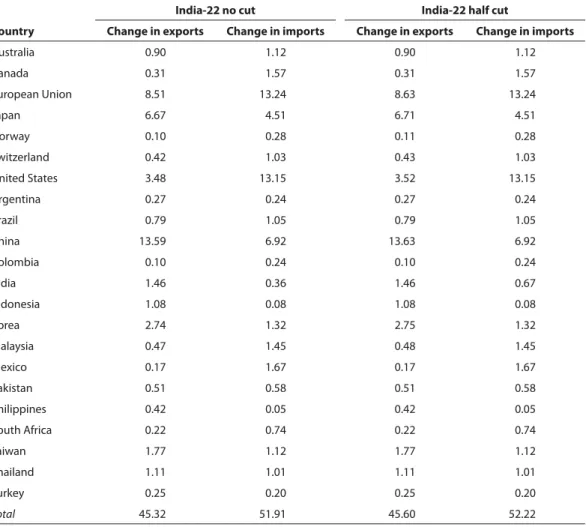
Tables 13 to 15 show the trade impact if a major emerging economy chooses a diff erent negotiating scenario for NAMA tariff cuts (see appendix B for a description of the various scenarios). What comes out quite clearly is that—in the aggregate—a change in the negotiating scenario would have limited impact on the total trade gains from NAMA tariff cuts but could aff ect the distribution of tariff and NTB cuts for politically sensitive products.
SERVICES
Of the three areas of market access negotiations, services could off er the largest gains for both developed and developing countries. How large remains unclear because services negotiations have barely begun, but recent empirical work indicates that the potential gains from meaningful liberalization of services trade barriers substantially outweigh those from merchandise trade liberalization.19
18. Th e estimate for developed countries is taken from OECD (2003) and the estimate for developing countries from Cline (2004). Th e method for calculating GDP gains follows that of Bradford, Grieco, and Hufbauer (2005). 19. Brown, Kiyota, and Stern (2005) calculate that the removal of agriculture protection, manufacturing tariff s, and
1 9
In 2007, world services exports, as conventionally measured, were valued at roughly $3.3 trillion; merchandise exports (i.e., agriculture and NAMA) were more than four times larger at $13.6 trillion (WTO 2008a).20 While some services are inherently nontradable, part of the imbalance between services
and merchandise trade can be explained by the poor quality of data on services, which leads to the underreporting of services trade in offi cial statistics, and another part by high barriers to services trade.
Despite the importance of services in modern economies, and despite the mandate to start new negotiations a decade ago to liberalize trade in services, WTO talks have not been fully engaged. To date, most WTO countries have not put off ers on the table; some have submitted off ers that would not even bind current practices. While there have been more than 100 off ers for services liberalization in the Round, most can be classifi ed as pro forma with limited value (Gootiiz and Mattoo 2009). Some developing countries have insisted that developed countries must off er to liberalize trade in temporary labor services (Mode 4) before developing countries issue counteroff ers on other services sectors (WTO 2008b).
In large measure, services have been relegated to the second division of Doha negotiations for tactical reasons. WTO members agreed informally at the 2005 Hong Kong ministerial that negotiations on services would not go full-bore until decisions were made on modalities for liberalization of agriculture and NAMA.21 Th is understanding was a huge mistake, indeed counterproductive, for developing
countries. Instead of increasing their leverage to gain US and EU concessions on agriculture and NAMA, it eff ectively reduced domestic political support for the overall Doha deal and thus limited the scope for additional policy reform.
Th ere are few useful precedents in terms of services negotiations. Th e Uruguay Round established a framework of rights and obligations in the General Agreement on Trade in Services (GATS) but little was achieved in liberalizing existing barriers. Sector agreements on basic telecommunications and fi nancial services were concluded a few years after the Uruguay Round, and these reduced some barriers maintained by signatory countries. Simply put, the Doha Round is only the second time countries have negotiated services multilaterally. Moreover, many bilateral FTAs address services issues superfi cially or not at all (Martin and Mattoo 2009).
Services barriers are also opaque. Unlike merchandise trade barriers, they cannot be easily quantifi ed. It is clear that regulations like licensing, permits, temporary visas, and nationality
services barriers for the whole world would increase world welfare by $53.9 billion, $701.6 billion, and $1,661.8 billion, respectively.
20. Th e conventional measures of services trade do not include services furnished locally by the foreign subsidiaries of multinational corporations, for example, by a US subsidiary of a Swiss re-insurance company (i.e., Mode 3 of the General Agreement on Trade in Services).
2 0
requirements for corporate boards impede services trade, but by how much is unclear. Unlike agriculture or NAMA, WTO members cannot apply a Swiss formula or any other ready device to cut through the web of services trade restrictions. Th ere appears to be no substitute for a detailed review of national laws and regulations. Th is process is burdensome, and in any event regulators are reluctant to tie their hands against future contingencies. As a practical matter, most WTO countries are not asked to engage in detailed services negotiations. Th e “free pass” for developing countries, so prevalent in the GATT era, is still available to most of them in the Doha services talks. However, middle income and successful emerging countries like Argentina, Brazil, China, India, Indonesia, and Th ailand are expected to participate.
Th e current services liberalization off ers do have some value: Th ey lock in a portion of the unilateral liberalization that countries have undertaken on their own. And just as in agriculture and NAMA talks, making services trade barriers clear and certain has value to fi rms doing business.22 Recent work by the
World Bank shows that “applied” services trade barriers are far lower than “bound” services barriers under Uruguay Round commitments (see Gootiiz and Mattoo 2009). Th e authors construct an index of services barriers (table 16). On their 100 point scale, where higher numbers indicate greater levels of restrictions, they fi nd that the actual level of world services barriers is an index of 21 out of 100, compared with an index of 48 for commitments bound in the Uruguay Round under the GATS.
Off ers on the table in the Doha Round would eliminate some of the “water” between “bound” and “applied” services barriers, by bringing the overall “bound” index down to 42 out of 100. However, the fact remains that, as they stand now, Doha off ers create very little new market access in services. Instead, they slightly lower the “bound” levels inherited at the end of the Uruguay Round. Th e off ers by OECD countries come close to locking in “bound” levels to actual levels, but they still leave some “water”—the score for actual barriers is 15 out of 100, while the score for Doha off ers is 19 out of 100. Current off ers from developing countries do little to reduce the “water” between “bound” and “applied” barriers.
Without a more substantive result in the services negotiations, the Doha Round is unlikely to succeed; the deal would not be rich enough or attract suffi cient political support in major trading nations to ensure ratifi cation by national legislatures.
Table 17 displays estimates of the impact of a 10 percent reduction in the tariff equivalent of services barriers in the 22 countries. A 10 percent reduction in the tariff equivalent of services barriers— admittedly an optimistic scenario given the current negotiations but conservative in terms of scope of policy reform that could be undertaken by the major trading nations—could be achieved by various changes in policies across countries. For our purposes, we assume that these changes would be binding commitments in GATS schedules that actually lower the applied level of services barriers. Th e tariff 22. Businesses routinely report that making barriers defi nitive has value; how much value is uncertain.
2 1
equivalents we use were econometrically estimated by Rosen (2009); simply put they were determined on a country level by estimating the shortfall between actual and expected imports of services.
We fi nd that a 10 percent reduction in services barriers would increase exports by the sample countries to the rest of the sample by $42.9 billion or 3 percent. Increases in US and EU services exports account for more than half of this amount—both would increase by an estimated $10.8 billion each. Under the 10 percent scenario, world exports of services to the 21 countries (i.e., total imports from the world by the 21 countries) would increase by $55.7 billion or over 3 percent. For all 21 countries, the estimated GDP impact of the trade gains (exports and imports) resulting from a 10 percent reduction in services barriers is $100 billion (table 17). Bilateral trade relationships are explored in appendix C.
Of course, given the current off ers, a 10 percent reduction or even a 5 percent reduction in barriers seems optimistic. Some eff orts have been made to improve the current off ers; a signaling exercise held during the July 2008 mini-ministerial at the WTO showed signs that countries might be willing to budge (Gootiiz and Mattoo 2009). However, the US services industry’s initial reading from the July meeting was that no “meaningful new market access” would be created (Vastine 2008).
CHEMICALS
Th e Chemical Tariff s Harmonization Agreement (CTHA), formulated in the Uruguay Round, serves as a starting point for Doha negotiators.23 Most tariff s on chemical products for CTHA signatory countries
are set at 0, 5.5, or 6.5 percent (WTO 2005). An initiative that broadens the CTHA to more countries and deepens liberalization could produce substantial gains. Currently, Canada, the European Union, Japan, Norway, Singapore, Switzerland, Taiwan, and the United States have participated in Doha Round discussions on a sector initiative for chemicals (WTO 2008c).
Chemicals account for more than 10 percent of total merchandise imports by the 22 countries (table 18).24 Chemicals are also crucial to US trade, accounting for 17 percent of US merchandise exports
(to the 21 partner countries) in 2007 and 9 percent of total US merchandise imports (from the world) in 2007.25 EU trade also exhibits a concentration in chemicals: 21 percent of EU merchandise exports (to
the 21 partner countries and 9 percent of total EU merchandise imports in 2007 were in chemicals.26
23. CTHA signatory countries include: Australia, Canada, Ecuador, the European Union, Hong Kong, Japan, Jordan, Korea, Mongolia, New Zealand, Norway, Panama, China, Qatar, Singapore, Switzerland, Taiwan, the United Arab Emirates, and the United States (METI 2009).
24. Chemical goods imports by the 22 countries from the world in 2007 were $862.5 billion; total merchandise imports by the 22 countries from the world were $8,308.3 billion.
25. US chemical goods exports in 2007 to the 21 partner countries were $156.6 billion; merchandise exports to the 21 partner countries were $935.1 billion. US chemical goods imports in 2007 from the world were $179.3 billion; merchandise imports were $2,017.1 billion.
26. EU chemical goods exports in 2007 to the 21 partner countries were $219.8 billion; merchandise exports to the 21 partner countries were $1,049.2 billion. EU chemical goods imports in 2007 from the world were $179.2 billion;
2 2
In 2008 the average US applied tariff on chemical products was 2.1 percent, the average EU applied tariff was 2.6 percent, and the average Chinese applied tariff stood at 6.7 percent. Th e average chemical tariff across the 22 countries in 2008 was 3.3 percent. However, tariff peaks remain a problem, even in CTHA signatory countries.
Assuming no tariff cut fl exibilities available to countries would be used on chemical goods, the tariff cuts outlined in the NAMA modalities would bring down the US tariff on chemicals to an average of 1.2 percent and lower the average tariff on chemicals in the 22 countries to 2.2 percent.27 Th ese cuts
would increase world exports by $15.4 billion or roughly 2 percent from the current level of chemicals trade. Total trade within the 22 countries would increase by $12.3 billion with the increase in US and EU exports ($2.5 billion and $3.6 billion, respectively) accounting for half of the growth.28
What more could be achieved in sector negotiations? We calculate, at the HS 6-digit level, the impact of reducing all tariff s at or below 2.5 percent, after the modality cuts, to zero; all tariff s above 2.5 and equal to or below 5 percent, after the modality cuts, to a new tariff of 2.5 percent; and all tariff s above 5 percent, after the modality cuts, to a new tariff of 5 percent. We estimate that this scenario would increase world exports of chemicals to the 22 countries by $30.8 billion, twice the impact
from the modality tariff cuts alone. Th e trade gains from this sector agreement would be an increase of $25.1 billion (3 percent) in exports just among the 22 countries, which is also about twice the impact from the modality cuts. Nearly half the sector increase can be accounted for by increased US and EU exports ($4.6 billion and $6.9 billion, respectively); or, looking at the trade fl ows from the opposing direction, by increased US and Chinese imports ($4.6 billion and $8 billion, respectively). Th e US export gain in chemicals ($4.6 billion) represents a 0.5 percent increase in US merchandise exports (to the 21 other countries); the import gains ($4.6 billion) represent a 0.2 percent increase in total US merchandise imports. For the group of 22 countries, the estimated GDP gain resulting from the trade increase attributable to a sector initiative in chemicals is $26.6 billion. Bilateral trade and tariff relationships are detailed in appendix D.
INFORMATION TECHNOLOGY AND ELECTRONIC/ELECTRICAL GOODS
In 1996, at a ministerial conference of the WTO—i.e., not during a multilateral trade round—29 WTO members agreed to the Information Technology Agreement (ITA). Th e ITA committed merchandise imports were $1,954.0 billion.
27. We assume that if countries are going to participate in certain sector negotiations (e.g., chemicals, electronics/electrical, or environmental goods), they are not going to utilize any of their tariff cut fl exibilities in those sectors. In reality, countries might exclude some sensitive products from sector negotiations and use their tariff cut fl exibilities on those same products. 28. Th e modality impacts described here do not correspond with the impacts for all NAMA products because of diff erent elasticities and the use of tariff cut fl exibilities. Specifi cally, the price elasticity used here is –2.09, while the earlier
calculations used an elasticity of –1.19. Also, in the full NAMA calculations we assume tariff cut fl exibilities are utilized on some chemical products; in the sector calculation, we assume no fl exibilities are utilized.