Excerpt from “Handbook of Software Engineering & Knowledge Engineering, Vol. 3 Recent Advances”, ISBN 981-256-273-7, World Scientific 2005, pp. 477-512
TOOL-BASED SOFTWARE PROJECT CONTROL
JÜRGEN MÜNCH* and JENS HEIDRICH†Fraunhofer Institute for Experimental Software Engineering, Sauerwiesen 6, 67661 Kaiserslautern, Germany
E-mails: *[email protected] †[email protected]
Developing software and systems in a way that entails plannable project execution and predictable product quality requires the use of quantitative data for project ctrol. In the context of software development, few techniques exist for supporting on-line monitoring, interpretation, and visualization of project data. This is caused par-ticularly by the often insufficient use of such engineering principles as experience-based planning and plan-experience-based execution in the software development domain. How-ever, effective software project control requires integrated tool support for capturing, managing, analyzing, and storing data. In addition, advanced control approaches aim at providing purpose- and role-oriented information to all involved parties (e.g., pro-ject manager, quality assurer) during the execution of a propro-ject. This chapter intro-duces the concept of a so-called Software Project Control Center (SPCC), sketches a control-oriented software development model, and gives a representative overview of existing tool-based software control approaches from academia and practice. Finally, the different approaches are classified and compared with respect to a characteriza-tion schema that reflects important requirements from the viewpoint of practicharacteriza-tioners.
Keywords. Software project control, software project control center, control tools, quality assurance, data interpretation, data visualization.
1 Introduction
The rapidly increasing importance of software in today’s business and the high dependability on software in contexts such as critical systems demands answers on how software can be developed in a plannable way (i.e., matching time and budget constraints), whereby the resulting software product matches predefined functional and non-functional requirements (i.e., reliability). Outsourcing and global distribu-tion of software development activities as well as the integrated development of systems with hardware and software components make predictable software pro-ject execution even more necessary. In addition, having repeatable processes for developing software variants within accurate time and cost estimations is gaining increasing importance. Modern cars, for instance, contain more than 50 software-based controllers. Missed delivery deadlines for such controller software can delay system integration significantly and lengthen the overall development; providing inadequate software quality can lead to expensive callbacks of thousands of vehi-cles. Many software development organizations still lack support for obtaining intellectual control over their software development projects and for determining
* Corresponding author.
477
Jürgen Münch, Jens Heidrich. Handbook of Software Engineering and Knowledge Engineering, volume 3, chapter Tool-based Software Project Control, pages 477-512. World Scientific
Publishing Company, 2005.
DOI: 10.1142/9789812775245_0017
the performance of their development processes and the quality of the produced products. Systematic support for detecting and reacting to critical project states in order to achieve planned goals is usually missing.
Software development based on engineering principles [13] [34] addresses these problems. It includes the definition of project goals, the development of explicit project plans based on experience [32], the execution of projects based on these plans, and the packaging of experience for future projects. The packaging step also includes the creation of explicit models (e.g., an effort baseline) from past project data in order to be reused and adapted while planning a new project. This feedback-cycle involves Software Engineering as well as Knowledge Engi-neering aspects.
One important means of engineering-style development is software project control. This comprises monitoring and analysis of actual product and process states, comparisons with planned values and the initiation of corrective actions during project execution. Measurement technology is needed to derive metrics for process and product characteristics, define target data values, and establish models for data comparisons and predictions.
In the mechanical production domain, so-called control rooms are a well-known instrument for engineers. A control room is a central node for all incoming information of a production process. It collects all incoming data (e.g., the current state of an assembly line) and visualizes them for control purposes. If there is a problem with the production process (e.g., a blocked assembly line), the user of the control room is informed and can handle the problem. Controlling in the soft-ware engineering domain requires an analogue approach that is tailored to the specifics of software processes (such as non-deterministic, concurrent, and distrib-uted processes). A control room in the software engineering domain is a so-called Software Project Control Center (SPCC) [28]. Typical tasks of SPCCs such as distributed data collection, data storage, and data analysis suggest the use of tool-support for performing the tasks. Nowadays, systematic software project control is finding its way into practice. This is very often accelerated by organizational ef-forts to reach higher maturity of their software processes and practices.
It should be mentioned that software project control can not only be used to monitor and adjust project performance during execution. The collected data can also be packaged (e.g., as predictive models) for future use and contribute to an improvement cycle spanning a series of projects. Additionally, data collection can be extended beyond the purpose of controlling. One example would be to perform a case study as part of a development project in order to determine the effects of process improvement.
This chapter is organized as follows: The next section gives a basic overview of software project control by means of a development model that integrates SPCCs into the software development cycle. Section 3 describes the scope of the discussed tool-based SPCC approaches. Section 4 introduces basic requirements
for SPCCs. Section 5 discusses a set of tool-based SPCC approaches referring to the requirements. Section 6 illustrates some integrated SPCC techniques. Finally, Section 7 classifies the discussed approaches and highlights future research issues in this field.
2 Software Project Control
The activities around a software development project can be grouped into three basic phases. First, we consider activities related to project planning, including the basic characterization of the project itself, goal setting, such as setting measure-ment goals according to the Goal Question Metric (GQM) paradigm [1] [2] [5] [8] [10] [31] [36], and finally, selection of the right development process. Second, we consider activities related to project execution, including all development activi-ties as well as project and quality management activiactivi-ties. Third, we consider ac-tivities related to know-how management, including acac-tivities for the analysis of project data, and packaging data in order to reuse them in future projects.†
Generally, project control can be defined as ensuring that project objectives are met by monitoring and measuring progress regularly to identify variances from plan so that corrective action can be taken when necessary [29]. Controlling is an activity that is basically applied during project execution, but has strong ties to planning and know-how management. Planning is the basis for controlling in or-der to be able to identify variances from plan. Know-how management is built upon controlling in order to be able to analyze the monitored and measured pro-gress of the project and to package these data for future projects.
Sometimes controlling is defined as the pure monitoring and measurement process during project execution, and all corrective actions to bring the project back to plan, the so-called steering activities, are excluded. For this chapter, we want to include all such steering activities explicitly in our definition of the term “project control”.
A Software Project Control Center (SPCC) supports project control and is de-fined as a means for process-accompanying interpretation and visualization of measurement data. An SPCC consists of a control architecture that clearly defines interfaces to its environment, and a set of underlying techniques and methods that allow for project control. Basically, an SPCC retrieves input data from the current project (e.g., goals, characteristics, baselines, and current measurement data) and generalized data from previous projects (e.g., quality, product, and process mod-els), and produces a visualization of measurement data by using the incorporated techniques and methods to interpret the data accordingly. An SPCC is itself a kind of general control approach according to our definition and not necessarily tool-supported. But in order to fulfill control tasks like monitoring defect profiles,
de-† All activities mentioned during the three phases cover the six project-related steps of the Quality Improvement Paradigm (QIP) [7].
tecting abnormal effort deviations, cost estimation, and cause analysis of plan deviations, a certain amount of tool support is necessary and inevitable. Therefore, this chapter focuses on tool-supported software project control and highlights some approaches in this field.
SPCCs can be classified along two dimensions. First, the degree of variability and adaptability of used techniques and methods to control the project, which can vary from a strictly predefined set of built-in techniques and methods to a com-plete extensible and adaptable repository of techniques and methods. Second, the goal orientation of the produced views onto monitored measurement data, which can vary from one static view for each monitored project variable (like one chart for the project’s effort) to a set of goal-oriented views, that is, views that depend on the previously defined measurement goals (like a set of charts covering all pre-viously defined measurement goals).
The TAME (Tailoring a measurement environment) software development model [6] [7] acts as a basis for integrating an SPCC into a Software Engineering Environment (SEE). It makes all necessary control information available and comprises essential mechanisms for capturing and using software engineering experience. The TAME model has been a major source for the development of engineering-style methods like the Goal Question Metric (GQM) method and the Quality Improvement Paradigm (QIP) as well as the Experience Factory (EF) [3] [4] [12] organization. The model has been instantiated in several progressive soft-ware engineering environments, such as NASA-SEL [24] or MVP-E [9].
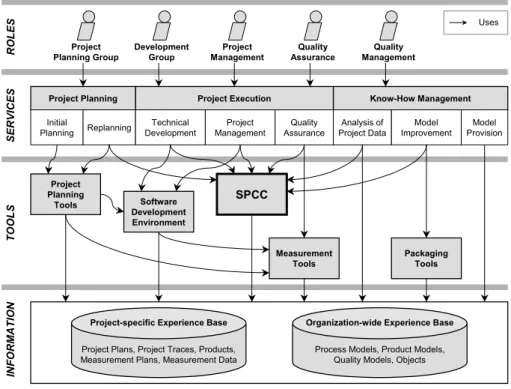
Fig. 1 shows an integrated development model for SEEs based on the princi-ples of the TAME model. It is used here to illustrate how an SPCC could be inte-grated into a software development organization and how it interacts with its envi-ronment. The development model distinguishes four different levels of abstrac-tion: (1) roles, (2) services, (3) tools, and (4) information. The presented model exemplarily assigns several units to each of the four levels in order to illustrate the integration of an SPCC within a software development project. According to [28], we can describe the four levels as follows:
Roles: Different roles within a software development project use different
ser-vices of the three basic phases of the project. For instance, the project planning group uses planning services in order to create a project plan, the development group uses technical services in order to develop products, the project manage-ment uses managemanage-ment services in order to control the project, and so on.
Services: This level incorporates services that support activities of the three basic project phases. (1) Project planning is done based on explicit project goals and characteristics. During planning, models (e.g., process models, product mod-els) are instantiated and related in order to build a project representation with re-spect to the project’s goals and characteristics. We distinguish initial planning, which refers to planning before the start of the project, from replanning, which addresses the systematic changing or detailing of the plan during project execution
(eventually supported by an SPCC). (2) The services mainly needed for project execution can be divided into services for technical development of products, ser-vices for project management (including project control), and, finally, serser-vices for quality assurance. (3) Know-how management is used to analyze the collected project data in order to provide and improve existing models for future use.
Know-How Management Project Execution Project Planning Initial Planning Replanning Technical Development Project Management Quality Assurance Analysis of Project Data Model Improvement Model Provision Project Management Quality Assurance Development Group Project Planning Group Quality Management RO LES SE RVICES IN FO RM ATIO N T OO LS Project Planning Tools Measurement Tools Software Development Environment Packaging Tools SPCC Uses
Project-specific Experience Base
Project Plans, Project Traces, Products, Measurement Plans, Measurement Data
Organization-wide Experience Base
Process Models, Product Models, Quality Models, Objects
Fig. 1. Software development model.
Tools: A set of tools is able to provide some services completely (fully
auto-mated) or to support certain aspects of a service (human-based tool application). For instance, there exist tools to support project planning, to measure project data, to develop artifacts, or to package experience. The tools are invoked by services and use information resulting from other tools or from an experience base to per-form their tasks. An SPCC tool supports roles such as project management, quality assurance, or development group (respectively corresponding services) by provid-ing, processprovid-ing, interpretprovid-ing, and visualizing process-accompanying data for their specific needs and purposes. Thereby, it builds upon information stored in an Ex-perience Base located in the last level of our development model.
Information: The fourth level addresses the information needed to perform a software development project, that is, information needed directly by services or needed by tools to support respective services. We assume that during project execution, measurement data is collected and validated. One task of the
informa-tion level is to provide project-specific or organizainforma-tion-wide informainforma-tion during project execution in order to improve control over the project.
3 Scope of the Overview
This chapter presents an overview of selected tool-based approaches in the SPCC field. Existing surveys reside on a specific level of abstraction and present the work from a specific perspective. There are papers describing frameworks (e.g., [22]), papers describing methods and techniques (e.g., [38]), and papers describing tools (e.g., [17]). Typical perspectives found are improvement perspectives (e.g., learning organization, measurement programs), mathematical perspectives (e.g., model building), or empirical perspectives (e.g., data analysis and validation).
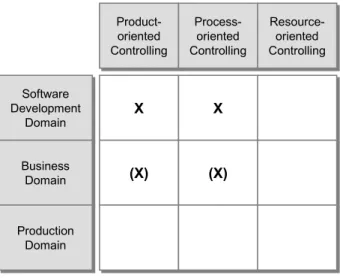
Product-oriented Controlling Product-oriented Controlling Process-oriented Controlling Process-oriented Controlling Resource-oriented Controlling Resource-oriented Controlling Software Development Domain Software Development Domain XX Business Domain Business Domain Production Domain Production Domain X X (X) (X) (X)(X)
Fig. 2. Scope of the overview.
In this chapter, we define the scope in the following way: We focus on tool-supported approaches for online data interpretation and visualization in the context of software development (see Fig. 2). We consider the selected approaches for the overview as being representative of the work in this scope. For rendering the scope more precisely, we exclude several approaches:
First, we exclude approaches from other domains such as mechanical produc-tion processes (e.g., supervision of a coal power plant). The reason is that other domains have different characteristics and as a consequence, specific control ap-proaches for these domains are not or not directly applicable for controlling soft-ware development. For instance, mechanical production processes are typically characterized by consistently identical production cycles, which are repeatedly performed in short time intervals. The small variance of mechanical production processes and the large quantity of data allows for completely different control and data analysis techniques and methods. In the area of business processes (e.g.,
accounting, acquisition), there exist a lot of control approaches (e.g., performance management with user-configured dashboards, which give the user the ability to view required information in a user-specific way). In contrast to software devel-opment processes, business processes are usually deterministic. However, ap-proaches for controlling business processes are often used to control software de-velopment. For this reason, we picked up a typical approach from the business process domain for the overview and show the limitations of its use in the soft-ware development domain.
Second, we exclude solely resource-oriented approaches (such as atten-dance/absenteeism control, person-job matching, and performance appraisal) and solely product-oriented approaches (such as simple configuration control). The rationale behind this is that the quality of a developed software product and the efficiency of the corresponding process depend upon more than one dimension. Therefore, we only take approaches into account that have a wider view. That means, we only selected control approaches that at least consider process and product aspects.
Third, we exclude spreadsheet programs (e.g., Microsoft Excel), diagramming programs (e.g., Microsoft Visio), function plotting programs (e.g., gnuplot), and purely data monitoring-oriented approaches (e.g., the design and code metrics included in Borland Together). Spreadsheet programs can be used as front-end of an SPCC for measurement collection and validation. The familiarity of developers and managers with such tools might facilitate data collection procedures and, as a consequence, increase the acceptance of measurement activities. Diagramming and function plotting programs can be used as front-end of an SPCC. They can be used to turn data into diagrams and provide a variety of specialized diagram types. Purely data monitoring-oriented approaches can be used as one way to gain data for further SPCC interpretation and visualization activities.
This overview touches different abstraction levels because narrowing to only one level (e.g., only focusing on the tool level) would contradict our goal of pro-viding a comprehensive overview of essential approaches for software project control centers. The description of the approaches focuses on the logical architec-ture to highlight the main components and their interaction. Additionally, selected techniques and methods in the context of the particular approach are sketched.
Most of the following approaches reside in the software development domain (in detail, Provence, Amadeus, Ginger2, SME, WebME, and PAMPA). One ap-proach originates from the domain of business processes (namely, PPM) and is discussed here because it can be considered as a typical representative of existing business-oriented control tools.
In the following, we will concisely describe the intended use, the main idea, the logical architecture, and associated techniques, methods, and tools of each approach, where appropriate.
4 SPCC Requirements
In order to discuss the related tool-based approaches according to a unique schema, we will introduce some basic requirements for SPCCs. The description is organized as follows: At first, we will discuss requirements in the field of data collection; that is, requirements referring to distributed development, database access, and so on. Afterwards, we will treat data processing requirements; that is, requirements referring to the external and internal SPCC data processing function-ality. Then, we will discuss requirements referring to data presentation, like ab-straction and compression of data and viewpoint-oriented presentation.
4.1 Data Collection Requirements
The following section gives an overview of requirements in the context of the overall SPCC data collection process; that is, it captures all requirements for in-coming data.
R1: Support for reuse. All data of previous projects (like effort and error
dis-tributions) and organization wide experience (like quality models and qualitative experience) are potential reuse candidates. Project-specific data has to be adapted according to project goals and characteristics and models have to be instantiated in the context of the current project. This leads to a generic reuse architecture in which all used data are customized in correspondence to current project goals and characteristics. An SPCC should support such a generic reuse architecture.
R2: Support for distributed development. Software is increasingly developed at
different distributed development locations. Each environment has its own way to collect data and to store them in a corresponding repository. An SPCC has to sup-port distributed development and has to be able to integrate the data from different development environments into one single framework.
R3: Integration of measurement paradigms. There are several approaches to derive measurement plans for a project. One goal-oriented top-down approach is the already mentioned GQM method, which systematically derives questions from measurement goals and metrics from derived questions. An SPCC has to take ac-count of measurement goals and plans and use them as an input for setting up the required SPCC functionality. So, an SPCC has to provide concepts in order to integrate an underlying measurement paradigm.
R4: Data validation capabilities. Incoming data have to be validated with
re-spect to whether they make sense in a special (project) context or not. This in-cludes for instance the range of incoming data. Furthermore, data from different distributed development locations have to be consistent in order to be integrated for further data processing. In general, an SPCC has to provide mechanisms for testing the validity of incoming data.
4.2 Data Processing Requirements
The following section gives an overview of requirements in the context of the SPCC data processing functionality.
R5: Provision of control techniques. We distinguish different usage purposes of an SPCC. For instance, an SPCC can be used to compare data with a corre-sponding baseline and detect deviations. For each purpose (or a group of purposes) a variety of possible techniques and methods exists. An SPCC has to provide a comprehensive pool of predefined techniques in order to control the project.
R6: Packaging of experience. In order to support organization-wide
improve-ment paradigms, we need to integrate experiences, gained through the usage of an SPCC, into an experience base. This includes quantitative experience (e.g., an effort distribution) as well as qualitative experience (e.g., a list of retaliatory ac-tions which has proofed to be useful if certain plan deviaac-tions occur). Therefore an SPCC has to provide concepts in order to package experiences for further reuse.
R7: Variability. The applicability of a certain control technique often depends
on the project’s context and the attributes (e.g., effort, number of defects, or de-sign complexity) to control in this context. For instance, in order to apply Statisti-cal Process Control the values of a controlled process attribute have to vary around an expected value. So, we’ll probably need new methods and techniques if we introduce new project types, or new attributes to control. Therefore, an SPCC has to provide an extensible pool of techniques; that is, it has to be able to integrate new techniques.
R8: Adaptability. Every project differs in terms of project goals and
character-istics (e.g., domain, programming language, or skills of developers). Therefore, all control techniques have to be adapted accordingly and an SPCC has to provide corresponding mechanisms to do so. Furthermore, it is possible, that certain pro-ject characteristics change during propro-ject execution. In this case the applied con-trol techniques have to be adapted to the new project characteristics dynamically. 4.3 Data Visualization Requirements
The following section gives an overview of requirements in the context of the SPCC data visualization process.
R9: Goal-oriented visualization. Different users of an SPCC (like a project manager, a quality assurance manager, a developer, or a tester) need different kinds of data visualizations. For instance, a project manager will probably need all data related to the state of the project, while a module designer will probably only need data about the design quality of a certain module. Therefore, an SPCC has to provide concepts for goal-oriented data visualization.
R10: Support for data compression/abstraction. SPCC users need data on
dif-ferent levels of abstraction at difdif-ferent points in time. For instance, a project man-ager needs an overview of the project’s effort per project phase. If a plan deviation
occurs in a certain phase, it is necessary to have a closer look at the effort data for all activities of this phase, and so on. A module designer, for instance, just needs design quality values for a certain module, while the system designer needs them for the whole software system. Generally, an SPCC has to provide mechanisms in order to present the processed data on different levels of abstraction.
R11: Provision of up-to-date information. In order to interpret the visualized data in the right way, you have to be sure, that all displayed data are up-to-date. An SPCC has to guarantee this. This requires traceability among (1) the collected measurement data, (2) the way they are processed (by control techniques), and finally (3) the way they are visualized (for different users). Then, it is possible to trace the overall data flow, which allows for interpretation of visualized data in the right way (e.g., in order to find causes for plan deviations).
5 Tool-based Software Project Control Approaches
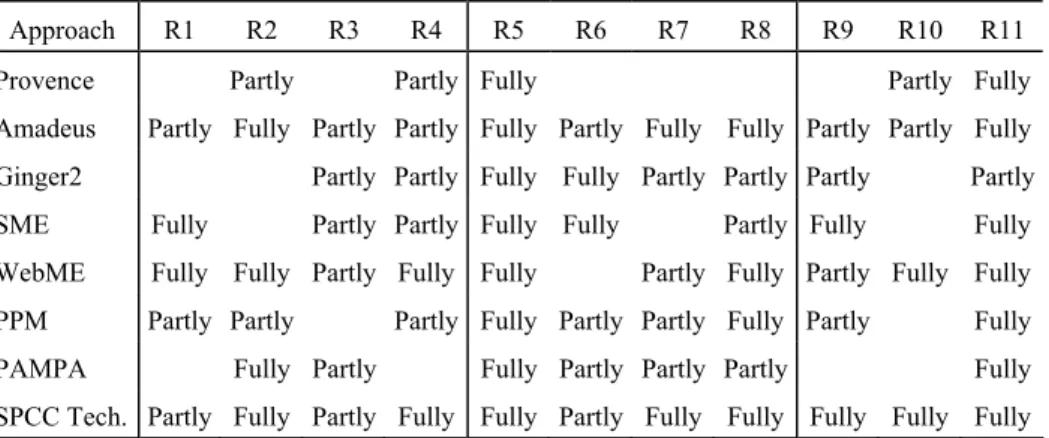
In the following we discuss a set of tool-based approaches for software project control. First, we’ll briefly address the idea behind each approach and the field of application. Second, we’ll describe the architecture used to implement the ap-proach. Third, we’ll discuss the requirements from Section 4. An overview of the latter is presented in Table 1. The discussion of requirements for each approach is organized into three parts. Part (a) mentions requirements fully supported by the approach, indicated by “Fully” in Table 1. Part (b) discusses requirements only partly supported; that is, the basic concepts are provided, but the integration is not fully addressed, indicated by “Partly” in Table 1. If necessary, part (c) lists re-quirements not addressed by the corresponding approach, indicated by an empty cell in Table 1.
5.1 Provence
Idea: Provence [20] is a framework for project management. It informs managers
about state changes of processes and products, and is able to generate reports of the project. Furthermore, it allows project managers to initiate dynamic replanning steps. The main idea behind Provence is an open and adaptable architecture. Most process-centered software development environments (SDEs) depend upon a monolithic structure; that is, they handle all tasks within the specific SDE. The component-based architecture of Provence allows the system to be flexible and facilitates integration into different organizations. Provence observes the devel-opment process, captures process and product data, answers queries about the current project state, and visualizes process transitions.
Architecture: The logical architecture of Provence consists of five components
and is shown in Fig. 3. (1) A process server supports process transitions according to a specific process model. It generates specifications of requested events and registers those events at the event action engine. (2) The data management unit
stores all relevant data of processes and products and allows the user to query the corresponding database. It is based on a pre-defined data model. (3) A smart file system detects changes of files caused, for instance, by tool invocation, and sub-mits these events to the event action engine. (4) The event action engine collects all incoming events and informs the process server in case of previously registered events. (5) Finally, the visualizer is responsible for visualizing current process and product data. A prototypical instantiation of the Provence architecture uses exist-ing tools to implement the five logical components of Fig. 3 (e.g., the process-centered SDE Marvel [19] is used as the process server).
Table 1. Overview of all discussed approaches.
Approach R1 R2 R3 R4 R5 R6 R7 R8 R9 R10 R11
Provence Partly Partly Fully Partly Fully
Amadeus Partly Fully Partly Partly Fully Partly Fully Fully Partly Partly Fully
Ginger2 Partly Partly Fully Fully Partly Partly Partly Partly
SME Fully Partly Partly Fully Fully Partly Fully Fully
WebME Fully Fully Partly Fully Fully Partly Fully Partly Fully Fully PPM Partly Partly Partly Fully Partly Partly Fully Partly Fully
PAMPA Fully Partly Fully Partly Partly Partly Fully
SPCC Tech. Partly Fully Partly Fully Fully Partly Fully Fully Fully Fully Fully
Requirements: (a) Provence provides a set of standard control techniques in order to check for process conformance. The component-based architecture allows integration of alternative tools for each component. The visualizer guarantees an up-to-date view of process and project data. (b) Depending on the used tool-set it should be possible to support distributed software development and data validation mechanisms. Depending on the used visualizer data could be displayed on differ-ent levels of abstraction. (c) However, Provence provides no access capabilities to former project data or experience gained from former projects. It further provides no support to integrate existing measurement paradigms. Current project informa-tion cannot be packaged in order to be reused in future projects, and a static set of integrated standard queries for visualizing the project state is provided. Moreover, no mechanisms to support goal-oriented data visualization for different project roles and adaptation of applied analysis techniques are addressed.
Database Process Server Visualizer Data Management Event Action Engine Smart File System File-Based Events Other Events Data Model Process Model Process and Product Data Process and Product Data
Register Event and Report Occurrence of Registered Events
Fig. 3. Logical architecture of Provence [20].
5.2 Amadeus
Idea: Amadeus [30] [33] is a metric-based analysis and feedback system, and
em-bedded into the process-centered SDE Arcadia. The goal is to integrate measure-ment into software developmeasure-ment processes, and to establish analysis and feedback mechanisms by providing functions for interpreting different types of events. The main idea of the Amadeus system is to make measurement an active component during project execution. Amadeus is based on a script language that dynamically interprets process events, object state changes, and calendar time abstractions. These three events can be combined to form more complex ones. An Amadeus user defines (reusable) scripts to observe certain events. Events are kinds of trig-gers for user-dependent agents, which execute a number of actions, like collecting specific data items of the project. All collected data is analyzed either by humans or automatically. For instance, a method called classification tree analysis is used to classify components of a software system.
Architecture: The main part of the logical architecture (shown in Fig. 4) is a
pro-active server, which interprets scripts and coordinates event observation and agent activation. Data integration frameworks allow for collecting data from proc-esses, products, or personnel. The server does not distinguish between scripts gen-erated by users, processes, or tools. A number of servers is able to run and interact (via scripts) at the same time. A server interacts with the evaluation component of an agent and coordinates tasks, where different agents participate. A client com-municates with a server via dialog boxes. Both server and client have an associ-ated expandable tool kit. The client’s tool kit includes tools to define a script, and the server’s tool kit includes tools as part of script interpretation (i.e., data collec-tion and analysis tools). The user interacts with a so-called customizable goal pal-ette that provides a summary of all available services and analysis processes. After selecting one process the system guides the user through the chosen technique.
Pro-Active Server Script Interpreter Coordination Table Persistent Storage of Historical Metric Data UIMS OM EC Active Agents Dynamic Agent Interaction Scripts Client Dialog Box Interactions from Humans Statically Annotated Process Programs Script Requests of Processes and Tools Tools Tools System Languages
Server‘s Tool Kit
UIMS User Interface Management System OM Object Manager EC Evaluation Component Client‘s Tool Kit
Fig. 4. Logical architecture of Amadeus [33].
Requirements: (a) The flexible server/client architecture allows Amadeus to support distributed software development. Client and server tool kits provide a set of standard techniques for project control and allow easy integration of new tech-niques and adaptation of existing ones for different projects. The user’s goal pal-ettes allow an up-to-date view on gathered measurement data and analysis results. (b) Depending on the used techniques as part of the server and client tool kits ac-cessing a reuse repository and packaging project experience should be possible. The same holds for data validation capabilities and integration of measurement paradigms. Amadeus users are individually supported by customizable goal pal-ettes including available services and analysis processes. However, no user-dependent views of analysis results are addressed.
5.3 Ginger2
Idea: Ginger2 [40] [41] implements an environment for computer-aided empirical
software engineering (CAESE). Torii et al. present a framework that consists of three parts: (1) A life cycle model for empirical studies, (2) a coherent view of experiments through data collection models, and (3) an architecture that forms the basis of a CAESE system. The main idea is to center the experimental aspects of software development. Within a CAESE system, a software engineering problem is given, consisting of questions and hypotheses. The goal of the CAESE approach is to find knowledge about the given problem statement. Fig. 5 illustrates the prin-cipal design of a CAESE environment. In that, the focus is more on conducting controlled experiments (so-called in vitro studies) and less on developing software products within a real software development project (so-called in vivo studies).
CAESE Knowledge Base Implemented Future Work Data Flow Control Flow Problem Needs Analysis Data Integration Experiment Design Data Collection Data Analysis Packaging Control Integration Empirical Study Management Database
Fig. 5. Logical architecture of Ginger2 [41].
Architecture: The life cycle model of a CAESE environment consists of the following parts: The needs analysis unit is used to identify the problem, formulate goals and the purpose of the study, and establish hypotheses. The experiment des-ign unit determines how to enact the experiment (i.e., which participants are se-lected and which techniques, methods, and tools are used). The data collection
unit gathers data according to the experiment design and a data collection model, which is used to collect data from different views. The data analysis unit analyzes the data according to the goals and the purpose of the study. Finally, the packag-ing unit packages the problem statement and the analysis results into a knowledge base. In addition, there are some elements that support the units of the life cycle model: A data integration unit transforms data from the data collection unit ac-cording to the input type of the data analysis unit (e.g., making continuous data discrete). The control integration unit synchronizes the usage of different tools. Finally, the whole study is managed by the empirical study management. Ginger2 uses a multitude of techniques to collect data. Most of them are used to observe the behavior of the experiment participants. For instance, there are techniques to gather audio and video data of the experiment, data about mouse movements, key-board inputs, and window movements, data about eye tracking, motion, and skin resistance of the participants, and finally, data about tool usage and program changes‡.
Requirements: (a) The Ginger2 environment provides a set of standard tech-niques for gathering and analyzing measurement data and allows for packaging
‡The collection of data about tool usage and program changes is the main focus of the Ginger1 sys-tem [40].
gathered knowledge in a knowledge base. The needs analysis unit allows for specifying goals and purposes of a study. (b) However, there is only limited inte-gration of a measurement paradigm as well as mechanisms for data validation and goal-oriented visualization depending on the data collection and analysis units. The same holds for variability and adaptability of integrated techniques and meth-ods. The focus of the Ginger2 system is on learning by means of controlled ex-periments. As a matter of facts, lots of analysis results are only available and used after project completion. (c) The lifecycle model does not address support for re-use and support for distributed development of software.
5.4 SME
Idea: The software management environment (SME) [16] [17] was developed
within the software engineering laboratory (SEL) [21] [24] of the NASA Goddard space flight center (GSFC). The SME is a tool to provide experience, gathered by the SEL, to project managers. The usage of the SME presumes that software de-velopment takes place within a well defined management environment. Its basic functions are observation, comparison, prediction, analysis, assessment, planning, and control.
Architecture: The implementation of SME functions relies on information
from previous projects, research results from studies of software development projects, and management rules, which are accessible via three separate databases. The architecture is presented in Fig. 6. The SEL database includes information from previous projects, that is, subjective and objective process and product data, plans, and tool usages. The SEL research results database includes different mod-els (such as growth or effort modmod-els) and relationships between certain parame-ters/attributes (described with quality models). Primarily, they are used to predict and assess attributes. The SEL management experience database includes the ex-perience of managers in the form of rules within an expert system. They help experienced managers to analyze data and guide replanning activities. For in-stance, this database includes lists of errors and appropriate corrective actions. All these data are input for the SME, which performs the management functions above. These functions provide data for the project manager in order to support well-founded decision making. Experience gained during project execution may lead to changes of project data. This feedback mechanism enables SME to work with up-to-date information.
Requirements: (a) The SME provides access to different kinds of reuse
reposi-tories and supports packaging of project information. It further provides a set of standard management techniques covering different purposes (e.g., guidance). Integrated feedback mechanisms guarantee up-to-date project information. The goal-oriented visualization of gathered project data is mainly focused on the pro-ject manager. (b) SME supports a static set of collected measurement data
corre-sponding to previously defined (static) measurement plan. However, mechanisms exist to adapt the SME to the needs of the currently performed project and to vali-date ingoing data. (c) Distributed development, different levels of abstraction for data visualization, as well as the enhancement of integrated techniques is not ad-dressed. SME SEL Database SEL Research Results SEL Management Experience Observe Compare Predict Analyze Assess Plan Control Project Data Models and Relationships Knowledge Base Changes Project Manager Input Project Manager
Fig. 6. Logical architecture of the SME [16].
5.5 WebME
Idea: WebME (web measurement environment) [37] [38] [39] is a web-based data
visualization tool that is based on the SME approach. WebME enhances the capa-bilities of SME in terms of distributed development of software. While SME is concentrated on the development within a certain closed SDE, WebME supports the development at different locations with heterogeneous SDEs and provides appropriate data integration mechanisms. WebME uses a special script language, which is able to integrate information of different heterogeneous SDEs into one common view.
Architecture: The architecture is presented in Fig. 7. It consists of three layers.
The end-user applications layer provides access to the WebME system via a web
browser. A user specifies a query and gets an HTML response. This makes the architecture platform-independent and allows access from every location within the world wide web. The mediating information servers layer is the central proc-essing layer. The query processor receives data from the web browser and
forms them to legal queries according to the WebME system. Vice versa, it trans-forms the answers of the WebME server to HTML pages and transmits them to the web browser. To know which data of which host in which format is to be used, the WebME system needs appropriate meta data in the form of scripts. The
informa-tion resources include a data wrapper for each development location of a
distrib-uted project. The data wrapper receives data from a local database and transmits them to the WebME system.
End-User Applications Meta Data Web Browser Query Processor Data Wrapper WebME Mediating Information Servers Data Wrapper ... Data Data Information Resources ...
Fig. 7. Logical architecture of WebME [38].
WebME uses the so-called data definition language (DDL) to specify scripts that describe which data of which host and in which format are to be used and how this data can be presented according to a certain query. A script processor trans-forms the scripts into measurement class and interface definitions, which can be processed by the WebME system to fill requests. A class represents a Software Development Environment, like NASA/SEL. Direct and indirect attributes can be assigned to each class by an appropriate DDL statement. Direct attributes are val-ues of external databases (received via data wrappers). Therefore, we have to specify a name, a unit, an interval (e.g., a weekly data collection), a host, a port and a binary (which reads values from the external database) for each attribute. Indirect attributes are combinations of direct ones (e.g., the difference of two di-rect attributes).
Requirements: (a) WebME allows for accessing different kinds of data
reposi-tories and visualization of therein stored data. Distributed development is sup-ported by its mediated architecture. It is further possible to validate ingoing data by specifying data units and collection intervals for each attribute. WebME
pro-vides a set of standard data collection and processing techniques via its script lan-guage and supports their adaptation. Moreover, it is possible to combine different attributes via these mechanisms and build kinds of abstraction levels. The web-based architecture guarantees accessibility and up-to-date project information. (b) The integration of measurement paradigms and goal-oriented data visualizations are only partly addressed by the script language. (c) Packaging mechanisms are not addressed by the logical architecture.
5.6 PPM
Idea: The process performance manager (PPM) is a tool to support the
manage-ment of business processes and was developed by IDS Sheer AG [18]. The aim is (1) to guarantee compliance with activities and effort plans, (2) to identify weak points in process execution performance, (3) to optimize the business process by identifying improvement potential, and (4) to assess the achieved improvements on the business process. Therefore, it provides a basis for decision making within an organization. The idea of PPM is to close the feedback gap between business process specification and execution. PPM provides functions for observing and assessing the performance of a current business process, and for providing feed-back about it. Furthermore, PPM is able to integrate existing (organization-specific) tools, and therefore, is able to present a common view across heteroge-neous systems. Key performance indicators (KPIs) characterize a business process across different aggregation hierarchies. Through baseline specification, statistical analysis, and trend identification, PPM is able to identify deviations from base-lines and to inform decision-makers.
Architecture: The architecture is shown in Fig. 8. Basically, it consists of four layers. (1) PPM is able to integrate existing source systems via an XML interface layer. An existing system accesses the PPM kernel, which runs as a server, via these adapters. (2) The PPM kernel layer includes a relational SQL database to store all relevant information of the source systems. In addition, the kernel in-cludes a module to generate processes and compute the KPIs. (3) A user interface layer, which runs as a client, provides access to the PPM kernel and allows navi-gation of process data and visualization in the form of diagrams and tables. There-fore, a Java 2-compliant web browser is sufficient. (4) Finally, we have a layer with additional modules, like modules for process control, change management, analysis, and evaluation. The modules provide additional functionality to the PPM system.
Requirements: (a) The PPM system provides KPIs in order to assess the
proc-ess performance and in addition a set of modules for further functionality, like process analysis. The system is adaptable to different projects through a variable XML adapter. Up-to-date project information is provided via a web browser. (b) PPM concentrates on business processes and does therefore not support distributed
software development in particular, but the architecture provides concepts to ac-cess different, distributed data sources via its XML adapter. Support for data vali-dation and packaging project experience depends on the integration of additional modules. The same holds for integrating data from a reuse repository and data visualization mechanisms. (c) However, integrating a measurement paradigm and support for different data abstraction levels is not addressed.
XML Interface PPM Kernel Interface CRM Systems ERP Systems Group-ware Systems SCM Systems E-Business Systems Workflow Mgmt. Systems Source Systems
CRM Customer Relationship Management ERP Enterprise Resource Planning
Database Generation of Processes Computing of KPIs User Interface Navigation Visualization Additional Modules Process Controlling Process Change Management Process Analysis Process Evaluation SCM Supply-Chain-Management KPI Key Performance Indicator Fig. 8. Logical architecture of PPM [18].
5.7 PAMPA
Idea: PAMPA (project attribute monitoring and prediction associate) [35] is a tool
that is especially designed for data collection and visualization. It supports the work of a project manager by enhancing intellectual control over the software development project. PAMPA is integrated into a dual control and improvement cycle. It implements the project visualization stage, which consists of (1) data collection and (2) data analysis and prediction. This stage could easily be inte-grated into a control and improvement cycle of a particular project. Intelligent agents reduce the overhead of data collection. They replace manual and subjective
data collection and analysis with objective procedures and allow a cost effective, automated solution for project control. Agents are responsible for data collection, data analysis, and report generation, and inform the project manager in case of plan deviations. Agents are generated by expert systems, which get their inputs from the PAMPA system.
Architecture: The basic architecture of PAMPA is shown in Fig. 9. Project
in-formation is stored in an object-oriented data management schema. PAMPA pro-vides a set of predefined objects with relationships and attributes. The attributes correspond to measurement data or to nominal values of processes and products. They form the basis for further PAMPA functions. PAMPA uses Microsoft Win-dows and Office to visualize the collected data. In the area of data collection, sev-eral adjustments can be made to collect data from other environments, whereas visualization in the form of diagrams and tables and the generation of reports re-quires Microsoft Office.
Requirements: (a) PAMPA supports distributed software development and
pro-vides a set of control techniques through automated agents. Up-to-date informa-tion is provided through an MS Office front end. (b) PAMPA is integrated in a dual control and improvement cycle. However, mechanisms for integrating a measurement paradigm, packaging project data, or extending and adapting the set of applied control mechanisms are not fully addressed. (c) Concepts for accessing a reuse repository and data validation mechanisms are not addressed. The same holds for goal-oriented data visualization as well as data compression and abstrac-tion mechanisms. Organization Suppliers Features System Design Component Design Code Verification Validation Problem Reports Defects Budget Project Plan Responsibilities Salaries Activities Licensed Files Reusable Code Customer Collect Data Instantiate Objects with Attributes PAMPA Information Process Product Involved Persons Data Flow
5.8 SPCC Technology
Idea: The SPCC Technology approach was developed at the University of
Kaiser-slautern and the Fraunhofer Institute for Experimental Software Engineering (IESE) [14] [15]. The aim is to present the collected data in a goal-oriented way in order to optimize the measurement program and to effectively detect plan devia-tions. The benefits of this approach include (1) improvement of quality assurance and project control by providing a set of custom-made views on measurement data, (2) support of project management through early detection of plan deviations and proactive intervention, (3) support of distributed software development by means of a single point of control, (4) enhanced understanding of software proc-esses and their improvement via measurement-based feedback, and (5) preventing information overload through custom-made views with different levels of abstrac-tion.
Architecture: The architecture (see Fig. 10) is organized along three different
layers. The information layer gathers all information that is essential for the basic functionality, for instance, measurement data from the current project, experiences from previous projects, and internal information, like all available purpose-oriented techniques and methods, the so-called SPCC functions. The functional layer performs all data processing activities, that is, it performs the currently used functions and composes role-oriented views. Finally, the application layer is re-sponsible for all interactions with an user, that is, it provides the resulting informa-tion of the funcinforma-tional layer to a user and receives all incoming user requests. Each layer consists of several conceptual units, which provide the essential functional-ity.
Pool Management: The pool management unit accesses an expandable and
ge-neric control pool, which stores all elements needed to support project control. The first type of elements are so-called functions, which are able to apply tech-niques and methods for several usage purposes, like monitoring, prediction, or guidance. In order to present the results of the functions according to a certain measurement goal, we need explicitly defined views, the second type of elements, of the processed data, such as one presentation suitable for the project manager, one for the quality assurer, and so on. Together, functions and views form a so-called visualization catena (VC). Functions process the measurement data, and views present the resulting information according to a certain measurement goal. The pool management unit is responsible for accessing the control pool, that is, it retrieves appropriate VC information and stores new, generalized functions and views in the corresponding sections of the control pool.
EB Management: As already mentioned, we need access to a twofold
experi-ence base (EB). One section provides project-specific information, like the meas-urement data of the current project, the project goals and characteristics, and the project plan. The other section provides organization-wide information, like qual-ity models (e.g., as a basis for predicting measurement data) and qualitative
ex-perience (e.g., to guide project managers by providing a course of actions). The EB management unit organizes access to an experience base by providing mecha-nisms to access distributed data sources (in case of distributed development of software artifacts), validating incoming data, and integrating new experiences into the (organization-wide) EB. Therewith, the EB management unit provides all in-formation necessary in order to perform the chosen functions.
Customization Execution Packaging Communication EB Management Pool Management Organization-wide EB Project-specific EB • Quality Models • Qualitative Experience • Measurement Data
• Project Goals and Characteristics • Project Plan APP L ICATIO N PRO C ES SI NG IN F O R M A T ION Internal Data Flow External Data Flow Modules Project Management Quality Assurance Development Group Controlling Pool • Visualization Catenae • Data Types,
Functions, and Views
Fig. 10. Logical architecture of SPCC Technology [511].
Customization: The customization unit is the most complex conceptual unit. (1) At first, we have to initialize the EB; that is, we have to define all necessary data sources. (2) Afterwards, the pools are tailored to the project-specific needs; that is, we need to choose appropriate functions and views according to a certain usage or measurement goal (e.g., as part of a GQM plan). (3) Thereafter, we need to adapt the resulting three-layered visualization catena according to the project goals and characteristics. (4) Finally, if new functions or views are defined (e.g., by the project administration), we need to generalize and integrate them into the respective pools for future usages.
Execution: The execution unit receives the chosen and adapted functions from the customization unit, determines input and output information, the function body, and the relationships with other functions. During execution of the chosen functions, the unit receives the respective input information from the EB manage-ment unit, respectively from a previously executed function. Furthermore, it re-ceives the chosen and adapted views from the customization unit and determines the relationship between the views, and which function results have to be visual-ized by which view. All views are finally delivered to the user communication unit for device- or tool-specific visualization.
Packaging: The packaging unit summarizes all experiences gathered through the usage of SPCC Technology, generalizes them in order to be reused by future projects, and delivers them to the EB management unit for integration into the respective section of an experience base.
User Communication: First, the communication unit handles security issues, like the access granted to a specific user; that is, it permits a certain user to access the results of a certain set of functions, respectively a certain set of views. Second, it provides a graphical user interface (GUI) in order to customize the VC accord-ing to project goals and characteristics (via the customization unit). Third, it visu-alizes the views (delivered by the presentation unit) according to the chosen output interfaces.
The current SPCC Technology implementation covers the main aspects of the presented logical architecture with the exception of the packaging unit and a fully automated selection of functions and views according to a previously defined measurement goal. The control pool incorporates a set of control techniques and methods.
Requirements: (a) A user is able to access data and analysis results via the communication unit from different development locations. The formal VC defini-tion allows for specifying explicit data validadefini-tion rules. Moreover, a flexible and extendable pool of standard control techniques is provided and the specified VC is adaptable to different project contexts. A set of role-dependent views allows for goal-oriented data visualization and building up view hierarchies in order to visu-alize results of included data compression and abstraction mechanisms. The com-munication unit guarantees up-to-date information for every user. (b) A ment paradigm (like GQM) can be used to formally derive a VC from measure-ment goals. However, currently no integrated mechanism is implemeasure-mented. At pre-sent, the packaging module only exists conceptually; that is, data packaging de-pends on an SPCC function, which has to access a corresponding repository ex-plicitly.
6 Integrated Techniques and Methods
In the following we give a few samples of techniques and methods integrated into the previously mentioned tool-based software project control approaches. The presented techniques support different roles within a software development pro-ject. Some are more technical-oriented (e.g., Classification Tree Analysis) and some are more management-oriented (e.g., Dynamic Variables). The aim of this section is to get an impression of the variety of integrated techniques and methods. 6.1 Classification Tree Analysis
Classification tree analysis is a widely-used statistical method that is used in the context of Amadeus to identify error-prone software components on the basis of previous software releases [30]. According to the 80:20 rule, 20% of a software system cause 80% of costs (because of error-proneness). Before we can start to build a classification tree, we have to define a so-called target class, for instance, all components with more than n interface errors. After that, a recursive algorithm searches metrics to distinguish between components inside and outside the target class based upon components of previous software releases. Therefore, a special metric is chosen to classify the components appropriately. The metric itself is se-lected with a specific function, which is beyond the scope of this article. That is, the root of the classification tree contains all components to be classified, the nodes contain partly classified components, and finally, the leaves contain compo-nents that are either inside or outside the target class.
Fig. 11 shows a classification tree example. The target class is defined by components with more than n interface errors. The first metric to classify the set of components is the number of data bindings (potential data exchanges via global variables). We get four different sets of components, namely, components with 0 to 3 data bindings, 4 to 5, 6 to 10, and more than 10 data bindings. Again, we se-lect one metric for each node to partition the set of components within the node. This will be done until all components within one node are either inside or outside the target class. The first node contains all components with 0 to 3 data bindings. All these components are outside the target class and therefore, the termination criterion for this branch is met. The next node contains components inside and outside the target class. Therefore, we need another metric to classify them. The number of revisions is chosen to partition the set of components with 4 to 5 data bindings. According to Fig. 11, we get two sets that match the termination crite-rion for this branch of the classification tree. All components with 0 to 12 revi-sions are outside the target class and all components with more than 12 revirevi-sions are inside the target class. The resulting classification tree is presented in Fig. 11. With this technique, error-prone or high-risk components can be identified and treated with more attention.
-- + - +
-- +
Data Bindings
Revisions CyclomaticComplexity SystemType
LOC
0-3 4-5 6-10 >10
0-12 >12 0-18 >18 Real-Time Other
0-150 >150 Metric (inner node)
Leaf node with components inside the target class Leaf node with components outside the target class
+
-Fig. 11. Hypothetical classification tree [30].
6.2 Dynamic Variables
Doerflinger and Basili [11] describe the use of dynamic variables as a tool to monitor software development. The work was basically done in the context of the NASA SEL project and SME. The idea is to assume underlying relationships that are invariant between similar projects. These relationships are used to predict the behavior of projects with similar characteristics. A baseline of an observed vari-able (synonymous to an observed project attribute) is generated from measurement data of one or more completed projects in order to compare projects in progress to it. For instance, some projects with a representative productivity might be grouped to form a productivity baseline. The baseline is used to determine whether the project is in trouble or not. If the current values of a variable fall outside a
toler-ance range (i.e., the predetermined tolerable variation from the baseline), the
pro-ject manager is alerted and has to determine the possible reasons for the failure. To compare two similar projects, some points of time are needed to synchro-nize the comparison of variables. This can be milestones, such as the start or the end of a software development phase. But this is not the only crucial point. Vari-ables, such as programmer hours and number of computer runs, are project de-pendent and therefore even hard to compare with other projects. We need to nor-malize the variables to compare values of different projects. The easiest way to create a project independent variable is to combine two dependent variables. The result is a relative measure, such as programmer hours per number of computer runs. Generally, there are two possibilities to express the time flow of a variable within a project. The first one is to measure the total number of events that have occurred from the beginning of the project up to the present (cumulative), and the
second one is to measure the number of events that have occurred since the last measurement of the variable up to the present (discrete). For example, let us as-sume four development phases with respective efforts e1 to e4 for each phase. These four values represent a discrete measurement, because we measure the ef-fort of each phase separately. The corresponding cumulative approach measures the whole effort from the beginning of the project, that is, we get a total effort of
e1, e1 + e2, e1 + e2 + e3, and finally e1 + e2 + e3 + e4 after each of the four phases, respectively. Both ways offer different analysis aspects and conclusions.
The introduced method uses one table for each relative measure (i.e., for each project independent variable). This table lists possible interpretations/causes for deviations above or below a baseline of the measure. An example is shown in Table 1, which presents possible interpretations for the deviation of a measure called programmer hours per computer run. The table is divided into a row for deviations above and below an appropriate baseline of the measure. Each interpre-tation has two columns with cross references to tables of other measures, which are represented by numbers. A reference means that the corresponding interpreta-tion is listed in the referenced tables as well. For instance, the interpretainterpreta-tion high complexity is also listed in tables with numbers 1, 2, 4, 8, and 9 in row above nor-mal.
Table 2. Programmer hours per computer run [11].
Type Interpretation Above Normal Below Normal
high complexity 1, 2, 4, 8, 9 modifications being made to
recently transported code
9 changes hard to isolate 4, 8, 9
Above Normal
changes hard to make 4, 9
easy errors being fixed 5, 9
error prone code 3, 4, 5, 6 2, 8, 9 Below Normal
lots of testing 6
The method to determine most probable deviation causes is as follows: (1) Flag any measure outside an appropriate tolerance range. (2) Analyze the appro-priate parts of the associated tables for each flagged measure. (3) Count overlaps of possible interpretations; that is, count the number of emergences of a certain interpretation in every flagged table. (4) Determine the most probable interpreta-tion, that is, the interpretation with most overlaps. For instance, if n measures are outside the tolerance range (above or below normal), we have n corresponding lists with possible interpretations. Then, the number of overlaps for each
![Fig. 3. Logical architecture of Provence [20].](https://thumb-us.123doks.com/thumbv2/123dok_us/397236.2544451/12.892.212.674.218.474/fig-logical-architecture-of-provence.webp)
![Fig. 4. Logical architecture of Amadeus [33].](https://thumb-us.123doks.com/thumbv2/123dok_us/397236.2544451/13.892.220.677.213.540/fig-logical-architecture-of-amadeus.webp)
![Fig. 5. Logical architecture of Ginger2 [41].](https://thumb-us.123doks.com/thumbv2/123dok_us/397236.2544451/14.892.243.649.219.540/fig-logical-architecture-of-ginger.webp)
![Fig. 6. Logical architecture of the SME [16].](https://thumb-us.123doks.com/thumbv2/123dok_us/397236.2544451/16.892.212.674.340.712/fig-logical-architecture-sme.webp)
![Fig. 7. Logical architecture of WebME [38].](https://thumb-us.123doks.com/thumbv2/123dok_us/397236.2544451/17.892.222.666.386.710/fig-logical-architecture-of-webme.webp)
![Fig. 8. Logical architecture of PPM [18].](https://thumb-us.123doks.com/thumbv2/123dok_us/397236.2544451/19.892.220.678.356.849/fig-logical-architecture-of-ppm.webp)
![Fig. 9. Logical architecture of PAMPA [35].](https://thumb-us.123doks.com/thumbv2/123dok_us/397236.2544451/20.892.228.667.719.1035/fig-logical-architecture-of-pampa.webp)
