A MULTI-ANATOMICAL RETINAL STRUCTURE
SEGMENTATION SYSTEM FOR AUTOMATIC EYE
SCREENING USING MORPHOLOGICAL ADAPTIVE
FUZZY THRESHOLDING
Jasem Almotiri
Under the Supervision of Dr. Khaled Elleithy
DISSERTATION
SUBMITTED IN PARTIAL FULFILMENT OF THE REQUIREMENTS FOR THE DEGREE OF DOCTOR OF PHILOSOPHY IN COMPUTER SCIENCE
AND ENGINEERING THE SCHOOL OF ENGINEERING
UNIVERSITY OF BRIDGEPORT CONNECTICUT
iii
A MULTI-ANATOMICAL RETINAL STRUCTURE
SEGMENTATION SYSTEM FOR AUTOMATIC EYE
SCREENING USING MORPHOLOGICAL ADAPTIVE FUZZY
THRESHOLDING
iv
A MULTI-ANATOMICAL RETINAL STRUCTURE
SEGMENTATION SYSTEM FOR AUTOMATIC EYE
SCREENING USING MORPHOLOGICAL ADAPTIVE FUZZY
THRESHOLDING
ABSTRACT
Eye exam can be as efficacious as physical one in determining health concerns. Retina screening can be the very first clue to detecting a variety of hidden health issues including pre-diabetes and diabetes. Through the process of clinical diagnosis and prognosis; ophthalmologists rely heavily on the binary segmented version of retina fundus image; where the accuracy of segmented vessels, optic disc and abnormal lesions extremely affects the diagnosis accuracy which in turn affect the subsequent clinical treatment steps. This thesis proposes an automated retinal fundus image segmentation system composed of three segmentation subsystems follow same core segmentation algorithm. Despite of broad difference in features and characteristics; retinal vessels, optic disc and exudate lesions are extracted by each subsystem without the need for texture analysis or synthesis. For sake of compact diagnosis and complete clinical insight, our proposed system can detect these anatomical structures in one session with high accuracy even in pathological retina images.
v
The proposed system uses a robust hybrid segmentation algorithm combines adaptive fuzzy thresholding and mathematical morphology. The proposed system is validated using four benchmark datasets: DRIVE and STARE (vessels), DRISHTI-GS (optic disc), and DIARETDB1 (exudates lesions). Competitive segmentation performance is achieved, outperforming a variety of up-to-date systems and demonstrating the capacity to deal with other heterogenous anatomical structures.
vi
AKNOWLEDGEMENT
At First, I would never have been able to finish my dissertation without the guidance and help of my God, I began this journey in his name and I have finished this thesis in his name: Lord of Mercy …The Giver of Mercy.
I would like to express my sincere gratitude to my supervisor Prof Khaled Elleithy for his patience, knowledge, advice, comments, valuable time and for his continuous support along my Ph.D. study. I could not have imagined having a better advisor and mentor for my Ph.D. study. I would not be able to finish this work without his advice and support.
I also would like to thank my committee, Dr. Miad Faezipour, Dr. Navarun Gupta, Dr. Xingguo Xiong and Dr. Syed Rizvi for their deep feedback in our committee meetings and the comments that help enhance this thesis.
Finally, I would like to thank my father, mother, family and friends for their constant love and support, their encouraging to strive for the best.
vii
TABLE OF CONTENTS
Abstract ... iv
Aknowledgement ... vi
Table of Contents ... vii
List of Tables ... x List of Figures ... xi Chapter 1: Introduction ... 15 1.1 Introduction ... 15 1.2 Motivations ... 16 1.3 Contributions ... 17 1.4 Thesis Outline ... 18
Chapter 2: Background Theory ... 19
2.1 Retinal Structures Anatomy ... 19
2.2 Retinal Fundus Imaging ... 22
2.3 Retinal Image Processing ... 27
2.4 Kernel-based Techniques ... 32
2.5 Vessel Tracking/Tracing Techniques ... 41
viii
2.7 Multi-scale Techniques ... 48
2.8 Model-based Techniques ... 52
2.8.1 Parametric Deformable Models ... 52
2.8.2 Geometric Deformable Models ... 54
2.9 Adaptive Local Thresholding Techniques ... 55
2.10 Machine Learning Techniques ... 60
2.11 Summary ... 67
Chapter 3: Retinal Segmentation System ... 69
3.1 Phase I: Image Pre-Processing ... 74
3.1.1 Retinal Vessels ROI Extraction ... 74
3.1.2 ROI of optic disc ... 79
3.1.3 ROI of exudates lesions ... 86
3.2 Phase II: Image Processing ... 88
3.2.1 Stage I: fuzzy modeling ... 88
3.2.2 Stage II: fuzzy model aggregation ... 97
3.3 Phase III: Image Post-Processing ... 100
Chapter 4: Experimental Results ... 102
4.1 Retinal Vessels Segmentation Results ... 102
ix
4.3 Retinal exudates Segmentation Results ... 112
Chapter 5: Conclusions and Recommendations ... 116
5.1 Conclusions ... 116
5.2 Future Work and Directions ... 117
x
LIST OF TABLES
Table 4.1 Performance of proposed vessel segmentation system on the DRIVE dataset. ... 105 Table 4.2 Performance of proposed vessel detection system on the STARE dataset. .... 106 Table 4.3 Performance comparison of proposed vessel segmentation methods based on DRIVE dataset... 107 Table 4.4 Performance comparison of proposed vessel segmentation methods based on STARE dataset. ... 108 Table 4.5 Performance comparison of optic disc segmentation methods on DRISHTI-GS dataset. ... 111 Table 4.6 Optic disc segmentation methods comparison. ... 111 Table 4.7 Performance comparison of exudates lesions segmentation methods on pathological images of DIARETDB1 dataset ... 115
xi
LIST OF FIGURES
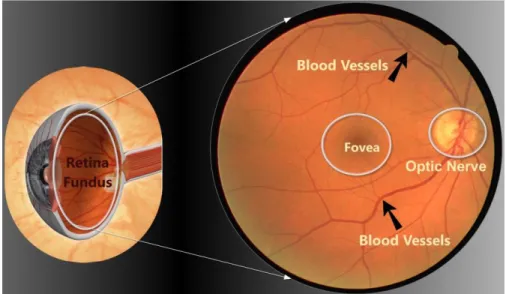
Figure 2.1 Retinal fundus image: 2D and 3D view. ... 20
Figure 2.2 Diabetic Retinopathy Severity Development with respect to Time. ... 22
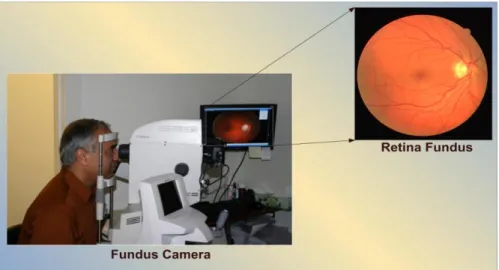
Figure 2.3 Retinal fundus camera. ... 23
Figure 2.4 Retina fundus as seen through fundus camera. ... 24
Figure 2.5 Imaging modes of ocular fundus photography. (a) Full color retinal fundus image (b) Monochromatic (filtered) retinal fundus image. (c) Fluorescence angiogram retinal fundus image. ... 25
Figure 2.6 Pixel width variation of retinal vessels (in pixels). ... 27
Figure 2.7 First challenge of retinal image segmentation. (a) Description of what is contained in the first panel. (b) Different sizes of retinal vessels. ... 28
Figure 2.8 Effect of retinal lesions on filamentary vessel structures appearance. ... 29
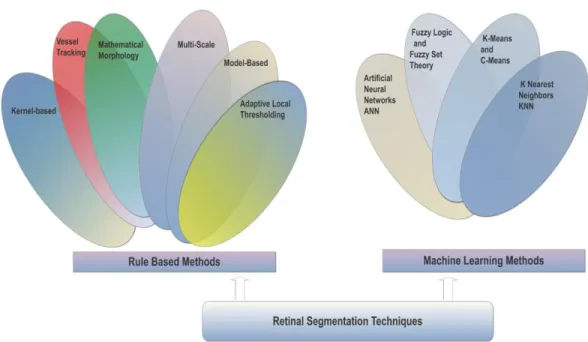
Figure 2.9 Retinal segmentation techniques. ... 30
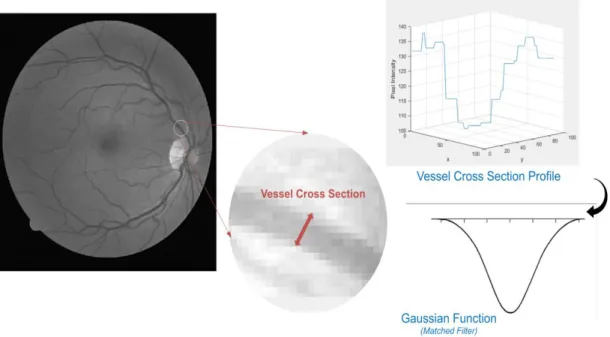
Figure 2.10 Cross-section intensity profile of the region marked by a straight line between point A and point B on retina image... 34
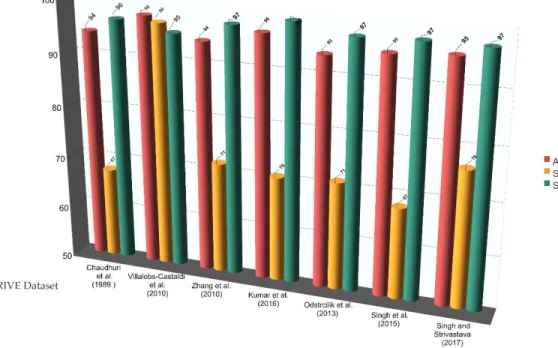
Figure 2.11 Summarized graphical comparison between some of kernel-based methods performance (Accuracy, Sensitivity and Specificity) based on DRIVE dataset. ... 40
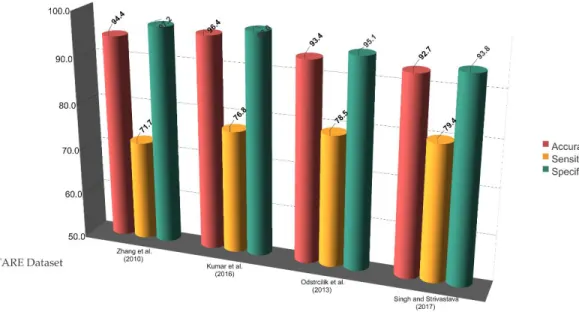
Figure 2.12 Summarized graphical comparison between some of kernel-based methods performance (Accuracy, Sensitivity and Specificity) based on STARE dataset. ... 41
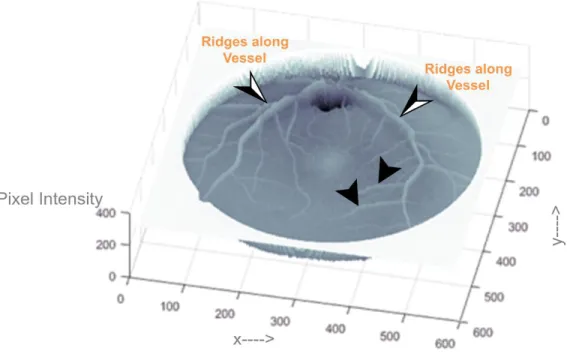
Figure 2.13 Graphical representation of ridges along retinal vasculature tree. ... 42
xii
Figure 2.15 Level scaling idea of multi-scale method. ... 48
Figure 2.16 Adaptive local thresholding taxonomy. ... 57
Figure 3.1 Prism of our proposed system segmentation results. ... 70
Figure 3.2 General flowchart of the proposed hybrid system. ... 72
Figure 3.3 Pipeline of proposed hybrid segmentation system. ... 73
Figure 3.4 Difference in widths between retinal vascular structures. ... 75
Figure 3.5 Output of supremum 𝐼𝑟𝑒𝑡𝑖𝑛𝑎 𝛼, infimum 𝐼𝑟𝑒𝑡𝑖𝑛𝑎 𝛽and 𝐼𝑅𝑂𝐼𝑣𝑒𝑠𝑠𝑒𝑙 images respectively. All of these images are originally in gray-scale, MATLAB® has been used to substitute colors values instead of gray ones for sake of clarification. ... 78
Figure 3.6 Anatomical structure of optic disc. ... 79
Figure 3.7 (a) Raw retina image. (b) Corresponding red layer 𝐼𝑟𝑒𝑡𝑖𝑛𝑎𝑅. (c) CLAHE-enhanced image 𝐼𝑟𝑒𝑡𝑖𝑛𝑎𝑒𝑛ℎ𝑎𝑛𝑐𝑒𝑑. ... 81
Figure 3.8 (a) Fuzzy c-means output image 𝐼𝐹𝐶𝑀 for c= 25. (b) corresponding clustered 3D of 𝐼𝐹𝐶𝑀image shows a gray level for each cluster (colorbar) where optic disc pixels have c= 25. ... 82
Figure 3.9 (a) Binarized 𝐼𝐹𝐶𝑀𝑏𝑤 image. (b) 𝐼𝐹𝐶𝑀𝑠𝑚𝑜𝑜𝑡ℎ𝑒𝑑 image. (c) Edge image 𝐼𝐸𝑑𝑔𝑒𝑀𝑎𝑝 after successive steps of dilation and morphological removal filtering... 84
Figure 3.10 Accumulation function A (r ̂, θ) in 3D view and associated 2D projection where hot spot corresponds to where the centers of circles should be found in 2D view and the maximum accumulation in 3D view. ... 86
Figure 3.11(a) Raw retina image contains white spots represent hard exudates lesions. (b) Exudates ROI. ... 87
xiii
Figure 3.12 Image fuzzification. (optic disc as example) (a) Optic disc ROI. (b) A cropped section of 𝐼𝑅𝑂𝐼𝑂𝐷 image. (c) The corresponding section of 𝐼𝑅𝑂𝐼𝑂𝐷 obtained after applying color substitution via MATLAB ®. Note the multiple representative gray levels of optic disc tissues and the interference between them and background tissues. ... 89 Figure 3.13 (a) Vessel region of interest 𝑈𝑅𝑂𝐼𝑣𝑒𝑠𝑠𝑒𝑙. (b) Corresponding color-substituted
𝑈𝑅𝑂𝐼𝑣𝑒𝑠𝑠𝑒𝑙. (c) A zoomed section of 𝑈𝑅𝑂𝐼𝑣𝑒𝑠𝑠𝑒𝑙. (d) Corresponding color-substituted of (c) shows two zones one corresponds to background and the other for vessel. (e) A zoomed section of vessel zone1. (f) membership function parameters corresponding to vessel zone1. ... 91 Figure 3.14 Gaussian bell membership function. ... 95 Figure 3.15 Set of Gaussian bell membership functions corresponding to different zones of
𝐼𝑅𝑂𝐼𝑡𝑎𝑟𝑔𝑒𝑡 image. ... 96 Figure 3.16 Comparison between fuzzy model and filtered fuzzy model outputs for case of vessels extraction (use seven membership functions). (a) Output of fuzzy model. (b) Output of aggregated (spatial filtered) fuzzy model. ... 99 Figure 3.17 Post-processing steps involved in retinal vessels segmentation. (a) Output of processing stage. (b) Binarized output. (c) Morphological operations. ... 100 Figure 3.19 Post-processing steps involved in optic disc segmentation. (a) Output of processing stage. (b) Binarized output. (c) Morphological operations. (d) Convex-hull transform ... 101 Figure 3.18 Post-processing steps involved in retinal exudates lesions detection. (a) Output of processing stage. (b) Binarized output. (c) Morphological operations. ... 101
xiv
Figure 4.1 Illustration of proposed algorithm on the dataset DRIVE. (a) and (b) Original retina image from DRIVE training dataset. (c) and (d) Original retina images from DRIVE testing set. (e) and (f) Corresponding ground truth. (g) Corresponding 1st observer ground truth. (h) Corresponding 2nd observer ground truth. (i), (j) and (k) Vessels segmentation results of our system. ... 104 Figure 4.2 Vessels Segmentation results using STARE dataset. Row 1: Original abnormal retina images. Row 2: Corresponding ground truth images prepared by Dr. Valentina Kouznetsova (1st observer). Row 3: Corresponding ground truth images prepared by Dr. Adam Hoover (2nd Observer). Row 4: Corresponding vessel segmentation results of proposed system. ... 106 Figure 4.3 Optic disc segmentation results for the DRISHTI-DS dataset. Column 1: Original retinal images. Column 2: Region of interest. Column 3: Corresponding ground truths. Column 4: Optic disc segmentation results of our proposed system. Column 5: Superimposed ... 110 Figure 4.4 (a) Original abnormal retina image from DiaRetDB1 dataset. (b) Gray layer of retina image. (c) Corresponding ground truth; a gray level for each expert annotation. (d) Normalized average of annotations. ... 113 Figure 4.5 Typical sample of retinal exudates lesions segmentation results using DiaRetDB1 dataset. Column 1: Original retinal images. Column 2: Corresponding ground truths. Column 3: Exudates lesions segmentation results of our proposed system. Column 4: Superimposed. ... 114
15
CHAPTER 1:
INTRODUCTION
1.1Introduction
Although the retina resides in a peripheral location, it is a part of the central nervous system, representing the neural portion of the eye [1]. The morphological variation in retinal anatomical structures is of great diagnostic value since it contains crucial information for the detection and diagnosis of a variety of retinal pathology such as Diabetic Retinopathy (DR), glaucoma, hypertension, Age-related Macular Degeneration (AMD), and Retinopathy of Prematurity (RoP) and for diagnosis of heart- and brain-related diseases. One of the major diseases that can hit the health of eye in particular and the overall health in general, the diabetes.
Diabetic retinopathy is one of the most common causes of vision loss among people of working age. Diabetes can cause various abnormalities including diabetic retinopathy if it affects retina, nephropathy if affect kidneys and diabetic neuropathy if it affects the nervous system. Moreover, diabetes is considered a critical risk factor in diseases related to heart and blood vessels [2].
Approximately half of blindness cases can be prevented through early diagnosis and periodic retinal screening. These diseases represent leading sources of retina-associated vision impairment and blindness in the United States of America Retinal screening is a way of detecting diabetic retinopathy early before any changes to your vision are noticed [3]. In early stages of diabetic retinopathy, no radical symptoms can be noted, however, over the time, many symptoms begin to appear and its severity increased
16
monastically with time [4].Typically, diabetic retinopathy begins as a small change in retinal blood vessels; thus, the first abnormality can be detected is the existence of Microaneuryms. Then, it affects the optic disc (optic nerve head) leading to changes in the optic disc shape. Further diabetes complication of diabetic retinopathy development is the increasing of vessels’ walls permeability of the retinal which allows leaking of lipid formations through weak wall of blood vessels leading to Hard Exudates. If retinopathy is detected early enough, treatment can cease it getting worse. Otherwise, symptoms become noticeable with time passing, besides, it can be much more difficult to treat [2]. Retinal screening performed through imaging instruments such as fundus camera, scanning laser ophthalmoscope (SLO) [5], where the ophthalmologists use both the 2D retinal yielded image and the segmented version of it in the process of diagnosis of pre-diabetes, diabetic retinopathy, and other health concerns that may be deduced. Retinal image segmentation is challenging; the normal and abnormal retinal anatomical structures has low contrast with their background, including vascular structures, the macula, and Microaneuryms. In contrast, other structures have high contrast with background tissues but are difficult to distinguish from challenges make classical segmentation techniques such as Sobel operators [6], Prewitt operators [7], gradient operators [8], and Robert and Krish differential operations [9] inefficient and inaccurate.
1.2Motivations
Although segmentation via these methods has been shown to be superior to other available methods, it is incapable of detecting and extracting all anatomical structures in one system; rather, to be fully identified and segmented; each anatomical structure
17
requires a separate stand-alone system built on a stand-alone algorithm. Another disadvantage of previously reported schemes consists of their incapability to address retinal images containing pathologies; this inability is demonstrated by performance degradation in terms of false positive rates and reduced accuracy, chiefly due to the presence of abnormal structures such as hemorrhages, exudates, and other lesions. Identification and extraction of multiple anatomical structures in retinal fundus images is thus a complicated problem and a potential minefield. These limitations have motivated us to develop a system that can extract multiple retinal anatomical structures at one session with high accuracy without the need for texture analysis or synthesis. This research exploits and combines fuzzy sets, mathematical morphology theories, and their capability for fast, accurate segmentation system.
1.3Contributions
From a research point of view, our work makes two major contributions. First, our proposed system eliminates the need for designing a separate system for detecting each retinal anatomical structure; one compact novel system was used to extract three different anatomical structures with various features and textures. Building upon this system, a hybrid framework for performing detection and extraction tasks for other anatomical structures either inside the retina or other organs can be developed. Second, the proposed system is highly robust and accurate as well, as it has been shown to perform better than the state-of-art on the public DRIVE, STARE, DRITSHTI-GS, and DiaRetDB1 retinal datasets.
18
In addition, it performs well at extracting vessels and optic disc from pathological retinal images. Therefore, it can be considered ideal for real-life diagnosis applications.
1.4Thesis Outline
In this thesis, a novel technique is proposed to improve segmentation performance of retinal anatomical structures in noisy conditions, and will be discussed in the upcoming chapters as follows.
Chapter 2 reviews the existing literature related to the research work presented in this thesis. In Chapter 3, we propose our hybrid retinal segmentation system and describes the different phases of the proposed hybrid system. Chapter 4 evaluates and discuss the system results and compares them with other techniques and methods. Finally, Section Chapter 5 summarizes the conclusions and recommendations and proposed future directions of this work.
19
CHAPTER 2:
BACKGROUND THEORY
The identification and localization of different retinal anatomical structures aim to separate the different retinal vasculature structure tissues either normal or abnormal from the fundus image background. Identification studies are attracting more and more attention in recent years due to non-invasive fundus imaging and the crucial information contained in the anatomical structures of retina; which is helpful for the detection and diagnosis of a variety of retinal pathologies included but not limited to: Diabetic Retinopathy (DR), glaucoma, hypertension, and Age-related Macular Degeneration (AMD). With the development of almost two decades, the innovative approaches applying computer-aided techniques for segmenting retinal anatomical structures are becoming more and more crucial and coming closer to routine clinical applications. In this chapter, a brief introduction to retinal fundus photography and imaging modalities of retinal images is given. Then, the preprocessing operations and the state-of-the-art methods of anatomical retinal identification are introduced along with an objective assessment and future developments and trends.
2.1Retinal Structures Anatomy
20
Figure 2.1, the fundus of the human eye is the back portion of the interior of the eye ball. The optic nerve resides at the center of retina, which can be seen as a white area of circular to oval shape and measuring about 3 × 3 mm across diameter. The major
blood vessels of the retina radiate from the center of the area of optic nerve and then radiate and branched to fill the entire area excepting the fovea zone, which is a blood-vessel free reddish spot with an oval-shaped lies to the left of the optic disc directly and it resides the center of an area that is known by the ophthalmologists as the “macula” region [10].
The optic disc as defined by [11] is “The optic disc is shaped like a doughnut with a pink neuroretina rim and a central white depression called the physiologic cup where further details related to optic disc anatomy was discussed thoroughly in chapter 3.
One of the major diseases that can hit the health of eye in particular and the overall health in general, the diabetes. Diabetes can cause various abnormalities including
Figure 2.1 Retinal fundus image: 2D and 3D view.
21
diabetic retinopathy if it affects retina and it affect kidneys and, in this case, it called diabetic nephropathy, or even it affects the nervous system, where it called diabetic neuropathy. Moreover, diabetes is considered a critical risk factor in diseases related to heart and blood vessels [12].
The diabetic retinopathy is considered one of the microvascular complications that associated with diabetes, leading to abnormalities manifest in retina in subsequent way with respect to time, where it may lead in worst case to complete blindness.
Many changes occurred and developed in the retinal anatomical structures due to diabetes; majorly can be categorized into five major types: (1) Microaneuryms, (2) Hemorrhages (3) Hard Exudates (4) Soft Exudates (5) Neovascularization.
In early stages of diabetic retinopathy, no radical symptoms can be noted, however, over the time, many symptoms begin to appear and its severity situation increased monastically with time. Typically, diabetic retinopathy begins as a small change in retinal blood vessels; thus, the first abnormality can be detected is the existence of Microaneuryms.
Microaneuryms are defined as local distensions of retinal vessels which, in turn, leads to intraretinally Hemorrhage. When it exploded, then, the severity of diabetic retinopathy is classified as mild non-proliferative state.
The next stage of diabetic retinopathy development is the permeability increasing of the retinal vessels’ walls which allows leaking of lipid formations through weak wall of blood vessels leading to Hard Exudates (or He and the severity of this state is described as moderate non-proliferative retinopathy, and if it appeared in the macula region it is called maculopathy.
22
As time proceeds, the retinopathy advances, some of blood vessels become almost blocked leading to microinfarcts in retina. This situation is categorized as Soft Exudates.
When a considerable number of hemorrhages, hard excaudate and soft exudates are created, the severity of retinopathy is described as sever nonperformative diabetic retinopathy, then this state of severity can turn into proliferative diabetic retinopathy as an appreciable lack of oxygen lead to creation of new fragile vessels. This situation is known as neovascularization, which in turn can leads to permanent blindness [2, 13] All these severity situations development versus time is depicted and summarized in Figure 2.2.
In this thesis, we deal with retinal vessels, optic disc, and hard exudates as target anatomical structures for our proposed segmentation system.
2.2Retinal Fundus Imaging
Retina photography is typically conducted via an optical apparatus called fundus camera as shown inFigure 2.3. Fundus camera can be viewed as a low power microscope that specialized in retina fundus imaging, where the retina is illuminated and imaged via the attached camera. In particular, fundus camera is designed to capture an image for the interior surface of human eye which composed of major parts including: macula, optic disk, retina and posterior pole [14].
23
Fundus photography can be viewed as a sort of documentation process for the retinal interior structure and retinal neurosensory tissues. The retinal neurosensory tissues convert the optical images reflection, that we see, into electrical signals in form of pulses sent to our brain where it decoded and understood. Retina photography can be conducted based on the idea that the eye pupil is utilized as both an entrance and exit for the illuminating and imaging light rays that used by the fundus camera. During the fundus photography, patients’ foreheads are placed against the bar and their chins placed in the chin rest as shown in Figure 2.3. After the oculist aligns the fundus camera, the camera shutter is released so a flash light is fired and a two-dimensional picture for retina fundus has been taken [15] as anatomically illustrated in Figure 2.4.
Figure 2.3 Retinal fundus camera.
24
In General, the photographic process involves grasping the light that reflected off the subject under consideration. In our case, the subject is the fundus of retina. Since the internal room of the eye has no light source of its own, in the retina photography, we need to flash or shine a light into eye room in order to capture a good photograph. The ocular fundus imaging has three major photography modes as elaborated inFigure 2.5:
◼
Full-color Imaging.◼
Monochromatic (Filtered) Imaging.◼
Fluorescence Angiogram.In case of full-color photography mode, no light-filtration is used and it is totally non-invasive in contrary to other modes of fundus imaging. The resultant retina fundus image looks as two-dimensional full color image as illustrated in Figure 2.5.a.On the other hand, if the fundus is imaged via a monochromatic filter or via particular colored illumination; then the fundus photography is called “monochromatic” as shown in Figure 2.5.b.
Figure 2.5 Retina fundus as seen through fundus camera.
25
This type of fundus photography is built based on the idea that the visibility of different structures in a retinal image is enhanced if the spectral range of illumination is changed correspondingly. In another word, instead of using white light of a broad scale of wavelengths, we use a light of a specified wavelength that corresponding to a specific color, for example, a red object in an image would appear lighter if the image is taken through a red filter and it would appear darker if it is taken through green filter.
As the white light can be divided into red, green and blue lights, the ocular fundus can be photographed via one of these gradient lights where each light has the capability to enhance the visibility of specific retinal anatomical structures based on their colors. For example, blue filter (filter with blue light) enhances the visibility of the interior layers of retina, which in full-color photo (taken by white light) appears almost transparent. On the other hand, we can get the best overall view of retina fundus and the most enhanced contrast if we used the green filter. Moreover, green filters have the capability to enhance the visibility of common lesions such as exudates, hemorrhage and drusen.
Figure 2.7 Imaging modes of ocular fundus photography. (a) Full color retinal fundus image (b) Monochromatic (filtered) retinal fundus image. (c) Fluorescence angiogram retinal fundus image.
Figure 2.8 Imaging modes of ocular fundus photography. (a) Full color retinal fundus image (b) Monochromatic (filtered) retinal fundus image. (c) Fluorescence angiogram retinal fundus image.
26
Another alternative to monochromatic filters is to split the full-color fundus image into its basic components, namely, Red, Green and Blue. It equally operates as colored filters, except we lose the resolution, which represents a way adopted in a variety of retinal vessel identification approaches in the stage of image preprocessing framework [16].
Fundus angiography is the most invasive fundus imaging where it involves injecting a tiny amount of fluorescein dye into a vein of patient’s arm, then the dye takes its way towards main blood stream leads it to retina vessels; then, the retina fundus is photographed. Originally, the word “angiography” is derived from the Greek words: Angeion which means “vessels” and “graphien” which means to record or to write. Once the sodium-fluorescein has been injected, and reached retina; retina fundus is illuminated with a blue light, then it is flashed in a yellow-green color. Later, specialized filters in the fundus camera allow the fluorescent light to be imaged leading to a high contrast (gray-scaled) retinal vascular structure images as shown in Figure 2.5.c [17].
Retina angiography is considered the photography mode that highly revolutionized the ophthalmologists’ capabilities in understanding both of retina physiology and pathology. Moreover, it used in the process of diagnosing, treatment of choroidal diseases [17]. However, this mode is considered the most invasive one among other, due to injecting dyes in the human veins directly. Thus, as recently reported in, it is important to consider the potential risk associated with using such mode of retina fundus photography especially for neonatal people [18].
27
2.3Retinal Image Processing
The oculists scan the retina of patients using fundus camera with high resolution. Accordingly, the situation of retina blood vessels, optic disc and possible existing abnormal anatomies are probed in order to diagnose the retinal diseases.
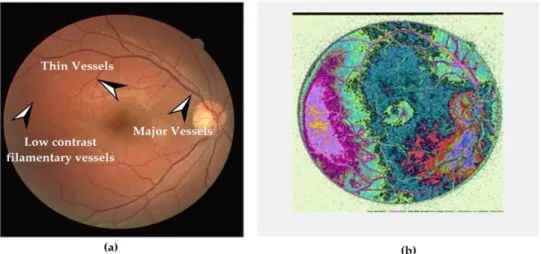
In many cases, it is found that the retinal vascular structure has low contrast with regard to their background in contrary to optic disc and exudates abnormalities. In other cases, optic disc and exudates may have same appearance on the surface of retina image. Moreover, Retina vessel identification and extraction faces many challenges that may be outlined as follows: (1) The retinal vessels’ widths take a wide range of color intensity range from less than one pixel up to more than five pixels in the retinal image, as shown inFigure 2.6, which requires an identification technique with high flexibility.
For further elaboration to this challenge, a snippet of MATLAB® code has been
developed for sake of grey levels substitution in retinal image; the different gray levels of a raw retinal image have been replaced by color ones, as shown in Figure 2.7.
Figure 2.9 Pixel width variation of retinal vessels (in pixels).
28
It can be noted that many of retinal vessels, either large or tiny ones, take the same background color intensities. This reveal the broad range of color that may be taken by the retinal vasculature structure making the identification process more complicated rather than that found in other identification problems.
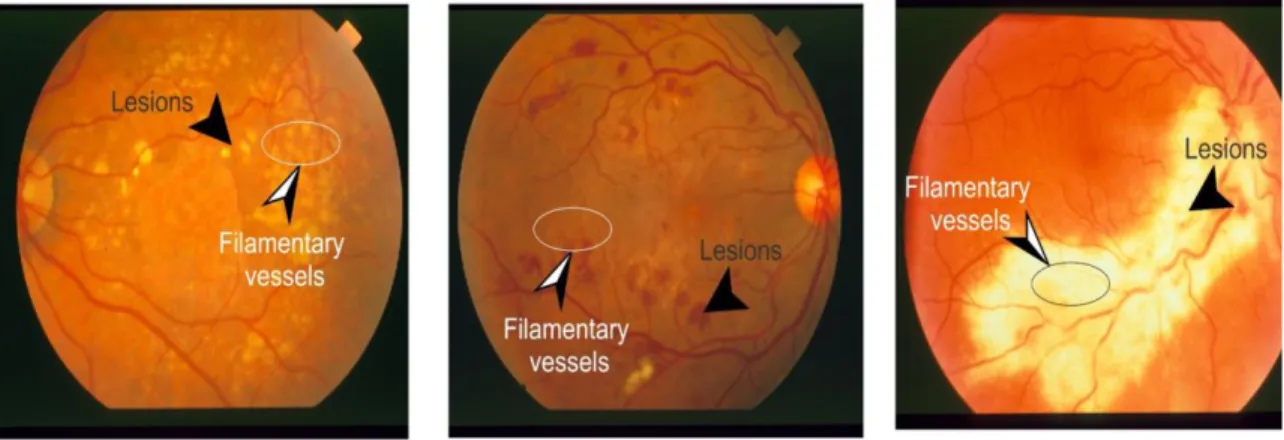
This challenge opens the room for a field of research specialized in detecting and segmenting thin (filamentary) retinal vascular structures as in [19-26]. (2) Vessels identification in pathological retinal images faces a tension between accurate vascular structure extraction and false responses near pathologies (such as hard and soft Exudates, Hemorrhages, Microaneuryms and cotton wool Spots) and other nonvascular structures (such as Optic disc and Fovea region). The retinal blood vasculature is a tree-like structure disperses across the fundus image surface including pathologies. Thin and filamentary retinal vessels melt in the retinal abnormal regions burden the task of accurate vessel segmentation as shown in Figure 2.8.
Figure 2.11 First challenge of retinal image segmentation. (a) Description of what is contained in the first panel. (b) Different sizes of retinal vessels.
Figure 2.12 First challenge of retinal image segmentation. (a) Description of what is contained in the first panel. (b) Different sizes of retinal vessels.
29
In summary, retinal vascular structure, either, inside normal or abnormal retina images has low contrast with respect to the retinal background. Whereas, other retinal anatomical structures have high contrast to other background tissues but with indistinct features in comparison with abnormal structures; optic disc and exudates lesions represent typical examples.
All these challenges, in terms of medical image processing, make the classical segmentation techniques such as Sobel operators[6], Prewitt operators[7], gradient operators[8], Robert and Krish differential operations [9] inefficient and inaccurate. As a consequence, a variety of algorithms and methodologies have been developed and implemented for sake of automatic identification, localization and extraction of retinal anatomical structures and can be broadly divided into: Rule-based and Machine learning techniques as elaborated as shown in Figure 2.9 and elaborated in subsequent sections.
Figure 2.13 Effect of retinal lesions on filamentary vessel structures appearance.
Figure 2.14 Effect of retinal lesions on filamentary vessel structures appearance.
30
In general, the capability of retinal segmentation algorithm to extract different retinal anatomical structures is evaluated in terms of many metrics. The most common ones are: average True Positive Rate (TPR), average False Positive Rate (FPR), average Sensitivity (recall, TPR), average Specificity(1-FPR), average Accuracy, average Precision. Sensitivity and specificity represent the most widely used metrics in medical researches; the higher the specificity and sensitivity values, the better diagnosis. The sensitivity reflects the capability of the algorithm to detect the vessels’ pixels whereas the specificity determines the ability of the algorithm to detect non-vessel pixels.
Sensitivity and Specificity represent the features of the algorithm and they associated with the accuracy metric in many medical image processing fields including retinal vessel segmentation [27] as given by the following equations [28] (2.1(2.4) :
Figure 2.15 Retinal segmentation techniques.
31
Sensitivity(Recall) = 𝑇𝑃/(𝑇𝑃 + 𝐹𝑁) (2.1)
Specificity = 𝑇𝑁/(𝑇𝑁 + 𝐹𝑃) (2.2)
Accuracy = (𝑇𝑃 + 𝑇𝑁)/(𝑇𝑃 + 𝐹𝑁 + 𝐹𝑃 + 𝑇𝑁) (2.3)
Precision = 𝑇𝑃/(𝑇𝑃 + 𝐹𝑃) (2.4)
Where TP (True Positives), FP (False Positives), FN (False Negatives), and TN (True Negatives).
On the other hand, many papers use the area under the Receiver Operating Characteristic (ROC) curve [29, 30] in order to evaluate their works especially for methods that highly depend on specific parameters during the segmentation execution. ROC curve is a non-linear function between TPR and FPR values. Optimal area under ROC is 1 for an optimal performance.
Most of retinal vessels segmentation techniques and algorithms used the most popular datasets in this field: (1) Digital Retinal Image for Vessel Extraction (DRIVE) [31, 32] and (2)Structuring Analysis of the Retina (STARE) [33]. Both datasets are well-considered and popular in the field of retinal vessels segmentation to the extent that almost every research performance involves vessels segmentation is evaluated via these datasets. The popularity of these datasets is due to the good resolution of the retinal fundus images and to the availability of manually labelled ground truth images prepared by two experts.
The DRIVE dataset consists of 40 retinal images were evenly divided into a training set and a test set whereas the STARE dataset consists of 20 images, 10 of which are normal retinal images and the other 10 images are abnormal ones. Nevertheless, many researchers use other datasets less common in contract to DRIVE and STARE datasets,
32
for sake of validation and performance evaluation, such as: Automated Retinal Image Analyzer (ARIA) dataset [34], DIAbietes RETina Data Base (DIARETDB) dataset [27], Methods for Evaluating Segmentation and Indexing techniques Dedicated to Retinal (Messidor) dataset [35, 36], High Resolution Fundus (HRF) [37].
2.4Kernel-based Techniques
This type of retinal vessels segmentation depends on the intensities distribution of vessel pixels in order to build a filter kernel, which in turn, can detect the retinal vasculature structure boundaries. The kernel can either follows a pre-specified form based on the cross-section profile of retinal vessel, or it can be deformable according to vessels boundaries especially when they lie in or in neighbor of hemorrhages, Microaneuryms lesions. Most often, kernel-based approaches are used as preprocessing image enhancement step for other retinal vessels segmentation methodologies, since it enhances the map for vessels boundaries.
The profile-based kernels use one of varieties of models that have been proposed and implemented in retinal vessels profiling that built based on the idea that intensity distribution of retinal vessel is capable to describe retinal vessels characteristics which can be turn into maps for sake of vessels detection. The basic idea of kernel-based techniques (or as called matched filtering-based) techniques is to compare the pixels’
intensity variations along with the cross-section profile of the retinal vessel with a prefigured template works as a kernel. Therefore, most of typical matched filter-based techniques detect retinal vessels by applying a matched filter kernel on the original gray retinal image followed by a thresholding step.
33
Retinal vessel profiling has many applications in the fields of vascular width measurement [38] or in the field of vessels type classification [39]. In case of vessels detection and extraction, it used to create the map for process of detection which pave the way for vessels extraction through region growing or filtering based approaches. Generally speaking, retinal vascular matched kernels can fall in one of two major categories : Gaussian-shaped or non-Gaussian shaped [40].
Early work in this direction was performed by Chaudhuri et al.[41] who observed the high similarity of the intensity variations of the cross-section profile of the retinal image with a Gaussian function as illustrated in Figure 2.10 Cross-section intensity profile of the region marked by a straight line between point A and point B on retina image.
Since first time when Chaudhuri et al. [41] published his well-known paper which stated that the cross section profile of retinal vascular structure has approximate Gaussian shape. Hence matched filters with Gaussian kernels are emerged and reported in literature later on for purpose of retinal vessel tree detection.
34
According to the fact that the cross section of retinal vessels can be modeled as a Gaussian function, a series of Gaussian shaped filters (different in Gaussian parameters values µ and σ) can be used in order to match different vessel sizes simply and efficiently. However, matched filters have strong response to both: vessels and non-vessels structures like red lesions and bright blobs which result in degradation in the performance in terms of false detection rate.
Three important aspects should be taken into consideration through designing a matched filter kernel: (1) limited curvature of retina vascular structure; where the curvature of vessel segments can be approximated by bell-shape piecewise linear segments. (2) vessels’ width: the width of the retinal vessels decreases in gradual way when one makes a move from optical disk towards Fovea region as shown in Figure 2.4 (3) Accurate cross-section profile of pixel intensities distribution of the retinal blood vessels [42].
Figure 2.17 Cross-section intensity profile of the region marked by a straight line between point A and point B on retina image.
Figure 2.18 Cross-section intensity profile of the region marked by a straight line between point A and point B on retina image.
35
The same idea of Chaudhuri et al. [41] was followed and re-implemented by [43] via DRIVE dataset. The regenerated segmentation results have reported an average accuracy of 0.9387 and 0.9647 and 0.6721 for average specificity and average sensitivity respectively. Zhu and Schaefer [44] proposed a profile kernel-based algorithm for retinal vessel extraction based on profiling the cross-section of retinal vessels using piece-wise Gaussian scaled model. Once the profile has been modeled, a phase alignment function based on data obtained from oriented log-Gabor wavelet was applied. After boundary areas map of retinal vascular structure has been produced, cross-sections were extracted by following an approach was proposed by same author in [45].
A notable vessel extraction performance has been achieved by Villalobos-Castaldi
et al. [46], where matched filter in a conjugation with entropy-based adaptive thresholding algorithm was employed. The methodology was applied on DRIVE dataset where it used matched filter in sake of piecewise linear segments enhancement of the retina vascular structure. Later, a co-occurrence matrix [47] that record the number of transitions between all pairs of gray-retinal levels was captured where the gray-level changes were depicted. Then, the entropy of the image gray levels distribution was exploited through second-entropy thresholding in order to segment the background pixels from the foreground (vessels) ones. The time consumed in the process of obtaining vascular structures approximated 3 seconds besides the high detection accuracy that has been achieved where it reached up to 0.9759, sensitivity and specificity of 0.9648 and 0.9480 respectively.
36
In comparing to performance that achieved in [46], Chanwimaluang and Fan [48] followed same procedure that was proposed in [46] in order to extract both : retinal vessel as well as the optic disk using STARE dataset. However, the time that consumed approximates 2.5 minutes per each retina image; most of it was consumed in matched filtering and local entropy thresholding steps. Moreover, it required post-processing steps were not required by [46] including long filtering stages for sake of isolated pixels removal. Then, filtering steps were followed by morphological thinning used to identify the retinal vascular intersection/crossovers. In the other hand, the optic disk identification proceeded into two major stages: (1) optic disk center identification through maximum local variance detection. (2) optic disk boundary identification through snake active contour. Even though the same methodology steps have been followed by both [46, 48]; they are extremely different in terms of achieved performance.
Singh et al. [43] have noted the important effect of Gaussian kernel parameters on the subsequent image processing stages. Singh et al. [43] followed same procedure that was proposed in [46, 48] as well. However, the parameters of Gaussian function have been modified in a way that enhances the overall performance that reached up to 0.9459 for accuracy and 0.9721, 0.6735 for specificity and sensitivity respectively using DRIVE dataset in comparison with average ROC area of 0.9352 was reported by Al-Rawi et al.
[49] applied on DRIVE dataset, where they used different set of modifications for Gaussian-kernel parameters.
On the same procedure that have been reported in [43, 46, 48], Kaur and Sinha [50] employed Gabor filter instead of Gaussian one in the early stages of vessel
37
extraction. The enhanced vessels were obtained via banks of 12 different oriented Gabor filters in range of 0 to 170 degree. Gabor-filter based approach outperforms the Gaussian one in terms of both area under ROC curve and in terms of specificity. The overall achieved sensitivity is less than that achieved by [43, 46] , on the other hand ; the performance of [43, 46] was evaluated via DRIVE dataset whereas the performance of [43] was evaluated on both DRIVE and the challengeable (pathologies bearing) STARE dataset where it shown a high specificity of 96% in the presence of lesions in abnormal retinal images.
Based on the fact that retinal vessels have symmetric Gaussian cross-section profile while the cross-section profile for the non-vessels is asymmetric one; a couple of matched filters one constructed with symmetric Gaussian (zero-mean) kernel and the other with first-Order Derivative Of Gaussian (FDOG) kernel were applied to retina images by Zhang et al. [51]. The response of matched filter that has Gaussian kernel was used to detect vessels while the local mean of the response of first-order derivative of Gaussian kernel was used to establish and adjusting a “dynamic threshold “which, in turn, was used in the thresholding phase that followed the matched filter phase. The proposed technique exploits the difference between FDOG kernel responses for both vessels and non-vessels regions (such as bright blobs, lesions, and optic disk) to vary thresholding level according to local mean signal. The experimental results that obtained via both DRIVE and STARE datasets, demonstrated that applying hybrid matched filtering kernels can reduce the false detection dramatically to less than 0.05 rather than that inherently generated with Gaussian kernel even for thin vessels with average accuracy of 0.9510 for normal cases retina images and 0.9439 for pathological ones.
38
According to techniques reported and discussed above, most of conventional matched filters-based approaches enhance the performance of matched filter-based methodology by enhancing the performance of the thresholding techniques rather than improving the matched filter kernel itself. Zolfagharnasab et al. [52], on the other hand, replaced the Gaussian kernel of matched filter by Caushy Probability Density Function (CPDF), where it has reported an overall accuracy of 0.9170 with 3.5% of false positive rate via DRIVE dataset.
The inherent zero-crossing property of Laplacian of Gaussin (LoG) filter was exploited in an algorithm was proposed by Kumar et al. [53] where two-dimensional matched filters with LoG kernel functions are applied to fundus retinal images in order to detect retinal vasculature structure which are firstly enhanced by Contrast Limited Adaptive Histogram Equalization (CLAHE) method. The proposed algorithm has achieved average accuracy of 0.9626, and sensitivity and specificity of 0.7006, and 0.9871 via DRIVE dataset and average accuracy of 0.9637 and 0.7675 and 0.9799 for sensitivity and specificity, respectively via STARE dataset in comparison with average accuracy of 0.9340 and 0.7060 and 0.9693 for sensitivity and specificity respectively on DRIVE dataset achieved by Odstrcilik et al. [37] using improved two dimensional matched filter with two-dimensional Gaussian kernel. The method was applied on STARE dataset as well, where it has achieved an overall accuracy of 0.9341 and 0.7847, 0.9512 for sensitivity and specificity respectively.
39
As a novel matched filter kernel improvement, Singh and Strivastava [42] suggested the Gumbel PDF as a kernel function, where they noted the slight skewness of vessel-cross section profile which is most likely approximate Gumble PDF with respect to Gaussian and Caushy PDF functions that proposed in [41] and [49]. In the thresholding phase, entropy-based optimal thresholding was used in a companion of length filtering as post-processing step in order to remove isolated pixels. The proposed technique shown an improved performance in terms of average detection accuracy 0.9522 for DRIVE dataset and 0.9270 for STARE dataset and the value of area under ROC curve was 0.9287 and 0.9140 for DRIVE and STARE datasets respectively. Since the performance metrics used in reported papers are not common, Figure 2.11and Figure 2.12illustrate a graphical comparison between some of reviewed kernel-based methodologies for DRIVE and STARE datasets based on accuracy, sensitivity and specificity metrics for retina vasculature segmentation.
Roychowdhury et al. [54] presented a novel classification-based optic disc segmentation algorithm that detects and extract the OD boundary as well as the location of vessel origin pixel. The proposed algorithm consists of three major stages. In the first stage, the green layer of each retina fundus image is extracted and resized. Then using a disc structuring element, the green layer is reconstructed morphologically where the bright islands of the optic disc that lie in the neighborhood of the major blood vessels are extracted. In the second stage, Gaussian mixture model classifier with six region-based features is used to classify the bright regions that obtained in first stage into bright probable OD regions and non-OD regions where the maximum vessel-sum and solidity factors are used to classify the probable OD-regions into best candidate OD regions and
40
remaining candidate OD regions. Convex hull transform was used to gather all candidates OD regions where a best-fit ellipse shape across the convex hull gives the final segmented OD region. The centroid of major blood vessels within the segmented OD boundary that obtained in previous stage is detected and assigned as the location of vessel origin.
The proposed algorithm has been validated using six public datasets of DRIVE, DIARETDB1, DIARETDB0, CHASE_DB1, MESSIDOR, and STARE where it showed high robustness against image illumination, imaging angles, and retinal abnormalities within competitive low computational time complexity (less than 2.14 s per image). The algorithm reported high segmentation performance reached up to 98.8%–100% for optic disc and overlap score lied in the range of 72%–84%.
Figure 2.19 Summarized graphical comparison between some of kernel-based methods performance (Accuracy, Sensitivity and Specificity) based on DRIVE dataset.
41
2.5Vessel Tracking/Tracing Techniques
The heart of vessel tracking algorithms is to trace the ridges of retina fundus image based on a set of starting points. Graphical representation of ridges of retina image can be noticed in Figure 2.13. Any tracking algorithm involves seeds selection as a preliminary step, where seeds can be defined either manually or automatically.
The ridges of vessels are detected by inspecting zero-crossing of the gradient and curvature. However, ‘clean-limbed’ ridges detection needs a pre-processing phase involves complicated steps of vessel enhancement for all vessels sizes and orientations. As a consequence, one of the major drawbacks of vessel tracking is the extreme dependency on the pre-processing steps that proceed the phase of tracing.
Figure 2.21 Summarized graphical comparison between some of kernel-based methods performance (Accuracy, Sensitivity and Specificity) based on STARE dataset.
Figure 2.22 Summarized graphical comparison between some of kernel-based methods performance (Accuracy, Sensitivity and Specificity) based on STARE dataset.
42
In tracing techniques, it is not an essence for seed points (starting points of tracking process) to be located at the center of retinal vessels, Chutatape et al. [55] ,for instance, have extracted seed points from the circumference of the optic disc, then the centers of vessels were traced using an extended Kalman filter. a semi-ellipse was defined around the optic disk as a searching region for starting points of vascular structure which was later used by [56]. As the candidate pixels locations for next vessel edge points were selected on the semi-ellipse, vessel tracking took place based on Bayesian theory.
Wu et al. [57] proposed a vessel tracking methodology for retinal vasculature structure extraction combines Hessian and matched filters and an idea of exploiting the edge information at the vessels parallel boundaries that first proposed by Sofka and Stewar [58] for retinal vessels extraction. Once the contrast between vessels and other retina tissues are enhanced and the information of sizes and the orientations of enhanced
Figure 2.23 Graphical representation of ridges along retinal vasculature tree.
43
vessels are available, the ridges are used to trace vessel via their center lines along ridge seeds that have been already selected automatically. The tracking performance was tested via DRIVE dataset, where 84.4% of retinal vasculature skeleton was successfully detected with 19.3% false positive rate, where the majority of false tracked vessels were the small ones and the researchers considered it as a subject of further ongoing research. In contrast to [57], Yedidya and Hartley [59] proposed a tracking methodology trace the retinal vessels centers through Kalman filter, where it has the capability to detect both wide and thin vessels even in noisy retinal images by defining a linear model. The proposed model proceeds into four stages: (1) firstly, set of seed points all over the image were found by convolving the whole retina image with a set of matched filters at different scales and orientations in aim of finding at least one seed point at each vessel which, in turn, remove the need to follow all branches. (2) secondly, Kalman filter was used to trace blood vessels’ centers starting from seed points that found in first stage. (3) thirdly, tracing process was ceases once the probability of vessel tracing is small for a number of back-to-back moves or once tracing hit previously segmented vessel. (4) finally, the segmentation results were traced in case of tracking failure in less than minimum number of steps. The proposed tracking methodology managed to detect retinal vessels with true positive rate reached up to 85.9% and false negative of 8.1% via DRIVE dataset.
Making use of mathematical graph theory, De et al. [24] designed a novel technique to extract the filamentary retinal structure. Their technique was built based on connecting the tracing problem and the digraph matrix-forest theorem in algebraic graph theory with a primary goal to address the vessel cross-over issue. The proposed technique composed of two main stages: (1) Segmentation step: the main skeleton of the retinal
44
vasculature structure was extracted. (2) Tracing step: the first step was used to construct the digraph representation which enabled tracing task to cast as digraph-based label propagation using Matrix-forest theorem. The proposed technique was used for both retinal and neural tracing where the empirical evaluation of the proposed technique showed high achievable performance in both cases.
Yin et al. [60] presented a statistical based tracking method as an improved version of a work suggested by [61]. This method detects edge points iteratively based on a Bayesian approach using local grey levels statistics and continuity properties of blood vessels. Then, it combines the grey level profile and vessel geometric properties for sake of both: accuracy improvement and tracking robustness. Experiments on both synthetic and real retinal images (DRIVE dataset) shown promising results where the true positive rate that obtained was 0.73 whereas the obtained false positive rate was 0.039. However, due to relatively low attained detection rate (TPR), a deeper evaluation on retinal images is needed to make the proposed method widely usable for vessel detection technique.
2.6Mathematical Morphology-based Techniques
Originally, mathematical morphology belongs to set theory of mathematics
science, where it is considered an application of lattice theory to spatial structures. Mathematical morphology concerns about the shapes that exists inside the image frame instead of pixels’ intensities. That means it ignores the details that regard image content where the pixel intensities are viewed as topographical highs as shown in Figure 2.14.
45
Typically, mathematical morphology was used to binary images, then it has been extended to gray and colored ones, as a general processing framework, through morphological operators. In terms of mathematical morphology, the image 𝐼 is represented as a set of 𝐼 ⊆ ℜ2where foreground pixels are the members that belong to
𝐼 whereas the background ones belong to the complement 𝐼𝑐. The image 𝐼 undergoes a transformation by another set known as structuring element. Typically, the morphological operations can be applied to binary images and then can be extended to gray images. Majorly, morphological operations can be divided into: erosion, dilation, opening and closing operations. Erosion operation is used to lessen the objects in the image whereas the dilation one is used to boost it.
Figure 2.25 Topographic highs of retinal vessels.
46
On the other hand, morphological openings are used to remove the unwanted structures in the image by applying an erosion followed by a dilation whereas in case of morphological closing, some of structures in image are filled or merged by applying dilation operation followed by erosion one.
In aim of retinal vessel segmentation, a Morphological Angular Scale-Space (MASS) technique was proposed by [62]. The basic idea of the proposed technique was to rotate a varying length (multiscale) linear structuring element at different angles in order to determine the connected components and assuring the connectivity across vessels where the scale-space created through the variation in the length of linear structuring elements. Gradual evolution to higher scales lessens the non-vessel like elements out of the processed retinal image where the extracted information from lower scales was used to build the retinal image of higher scales. At a certain scale (determined by authors experimentally) and using a vessel-ness measure was proposed by [63], the proposed method reported a lowest mean square error value of 0.0363 which have been averaged over 50 retinal images taken from DRIVE dataset.
In addition to morphological operations, morphological tools are used in retinal vessel segmentation tasks including: gradient, watershed transform, top-hat transform, distance function and geodesic distance. Watershed transform has been developed in the framework of mathematical morphology by Digabel and Lantu´ejoul [64]. The principal idea underlying this method was inspired from geography when a landscape is flooded by water, then watersheds appear as divide lines of the domains of rain falling over the entire region [65]. A watershed-based segmentation algorithm was used by Frucci et al.
47
The proposed algorithm combines watershed transform and both contrast and directional information extracted from retinal image. First, watershed transform was used to segment the image into multi-regions. Then, a unique gray-level value was assigned to each single region. A contrast value was computed for each region through calculating the difference in gray-level with respect to its adjacent regions. A 9 × 9window was applied to each pixel in order to attain the directional map that composed of 16 directions. The standard deviation of pixels’ gray levels is aligned along these directions. Then, based on the occurrences of directions within watershed region, pixels locating in same region are assigned same direction. Once the contrast and directional maps had been obtained for each watershed region, a precursory segmentation of retinal vascular structure was acquired where the regions with highest contrast (positive difference) were most likely considered as non-vessel regions. Otherwise, they were considered as vessel ones. The proposed algorithm has been developed using DRIVE dataset and has achieved a detection precision of 77% and accuracy of 95%.
Jiang et al. [67] presented a novel work to extract the retinal vasculature structure, by using global thresholding based on morphological operations. The proposed system was tested via DRIVE and STARE datasets and has achieved an average accuracy of 95.88% for single dataset test and 95.27% for the cross-dataset test. In terms of time and computational complexity, the system has been designed to minimize the computing complexity and processes multiple independent procedures in parallel, thus having an execution time of 1.677 seconds per each retinal image on CPU platform.
48
2.7Multi-scale Techniques
The core idea behind the multi-scale representation is to represent the image at multiple scales(levels) where the data contained in a given image is embedded into one-parameter family of derived images at multiple scales [68] as shown in Figure 2.15.
This representation is constructed provided that the structures at coarse scales (levels) are the simplified versions of the corresponding structures at fine scales by convoluting with smoothing kernels. The only possible smoothing kernels that meet the linearity and spatial shift invariance are the Gaussian and its derivatives kernels that have increasing widths (scales 𝜎) [69].
Originally, the scale-space is the framework of the multi-scale image representation [70], two widely-used types of multi-scale representation are : pyramid [71], [72] and Quad-tree [73]. Most of retinal vessels segmentation methodologies are built based on the pyramid multi-scale type, where the grey-level data is represented in
Figure 2.27 Level scaling idea of multi-scale method.
49
such a way that combines sampling operations with successive smoothing steps conducted by Gaussian kernels with different scales gives rise to a response that is represented by 2D Hessian matrix [74]. The eigen values of Hessian matrix determine the vessel-likeness which, in turn, result in retinal vasculature structure enhancement. Hessian matrix processing through eigen values analysis aims to obtain the principal directions of vessels where the decomposition of local second order structures in retinal image can be performed in order to attain the direction of the smallest curvature along the retinal vessels [75].
The retinal image size decreases exponentially with scale level as illustrated in Figure 2.15, as a consequent result, the amount of required computation too. However, it shows weakness in extracting fixed-size structures such as optic disc and nonuniform structures such as retinal lesions. Thus, multiscale approaches can be best suited for structures have varying width and length (coarse and fine) in the same image.
A typical multi-scale based technique for retinal vessel segmentation was proposed by Budai et al. [76]. The proposed technique composed of three major phases: (1) Gaussian pyramid generation, (2) Neighborhood analysis and (3) Images fusion. After the green channel of raw retinal image was extracted, Gaussian pyramid of resolution hierarchy was generated. The hierarchy composed of three levels (level 0, level 1, and level 2 as shown in Figure 2.15). The original retinal image (green channel) has the highest resolution (level 0), the width and height of image begin reducing as we move towards further levels (fine to coarse levels).
50
In the second phase, for each level, an 3 × 3 neighborhood window analysis for each pixel was analyzed by calculating Hessian matrix followed by calculation of a couple of eigenvalues 𝜆𝑙 𝑎𝑛𝑑 𝜆ℎof Hessian matrix which reflect the scale of lowest curvature 𝜆𝑙 and the highest one 𝜆ℎ in the neighborhood window of the target pixel. Then, the ratio of these values was used to calculate a vessel likeness measure 𝑃𝑣𝑒𝑠𝑠𝑒𝑙 = 1 −
𝜆𝑙
𝜆ℎ ; the value of 𝑃𝑣𝑒𝑠𝑠𝑒𝑙determines whether target pixel belongs to vessel tree or not. If
𝑃𝑣𝑒𝑠𝑠𝑒𝑙value is close to one, it means it most likely a vessel pixel since 𝜆𝑙 𝑎𝑛𝑑 𝜆ℎ are similar to each other. This analysis was applied to each pixel in every scale (level). At the final stage, segmentation results from different levels were undergone binarization using two hysteresis thresholds, then they merged together using pixel-wise OR operation, which yielded the final segmented image. The methodology has achieved an accuracy, specificity, and sensitivity of 93.8%, 97.5% and 65.1% on STARE dataset, and 94.9% ,96.8% and 75.9% on the DRIVE dataset.
Abdallah et al. [77] proposed a two-step multi-scale retinal vessel detection algorithm. As a first step, the noise-corrupted retinal image (gray layer) was denoised against the additive Gaussian noise by applying a flux based anisotropic diffusion technique; a multi-scale response of multi-level resolution of retinal image was computed. Then, as a second step, a vessel model was established in order to analyze the eigenvalues and the eigenvectors of Hessian matrix for each scale. Final result of multi-level analysis represents the pixel-wise maximum of the results were obtained over all scales. The proposed algorithm reported area under ROC curve of 0.94514 on STARE dataset.
51
Rattathanapad et al. [78] presented an algorithm to segment the blood vessel in retinal images based on multilevel line detection and connection of line primitives. Multilevel line detection is used for extracting the retinal vessels at multiple values of Gaussian smoothing parameters. Then the line primitives that extracted at different scales were merged into one single vessel extraction result. The proposed algorithm was validated using DRIVE dataset where it proved the capability to detect most of the major part of vessel skeleton with false positives.
A new approach based on a multi-scale method for segmentation of retinal vessel was proposed by Moghimirad et al. [79] where it used weighted Medialness function along with the eigenvalues of the Hessian matrix. The proposed approach consists of two phases. In the first phase, the medial axis of retinal vessels was extracted using a two-dimensional Medialness function in multiple scales and sum of smoothed eigenvalues of the image. The second phase is for vessel reconstruction where centerline of vessels was extracted and radius of vessels was estimated simultaneously in order to obtain the final segmented results. The proposed approach was validated using DRIVE and STARE datasets where it showed high performance in terms of accuracy and area under the ROC curve where it has achieved accuracy of 0.9659 with area under ROC of 0.9580 via DRIVE dataset and accuracy of 0.9756 with area under ROC curve of 0.9678.
52
2.8Model-based Techniques
The concept of deformable model is used to describe a set of computer vision techniques and algorithms that abstractly model the variability of a certain class of objects in an image (vessels in retina image). The most basic versions of these algorithms concern with shape variations modeling where the shape is represented as flexible curve or surface, then it can be deformed to match specific instance of the object class [80]. The deformation is not an arbitrary process, rather it is performed based on two powerful theories: Energy Minimization and Curve Evolution which have roots in physics ,geometry and approximation theories [81]. Deformable models can be divided into two main categories: parametric and geometric ones [82].
2.8.1 Parametric Deformable Models
Parametric deformable modeling or as it called snakes or active contours, are parametrized curves that depend inherently on particular parameter in order to create it. The major goal of active contour modeling is to segment objects in retinal images by fitting the curve to objects’ boundaries in the image. It is called dynamic contour modeling since it initialized at a place in the neighborhood of target object, then the model can evolve dynamically to fit the shape of object by an iterative adaption. The major idea of snakes is to represent a curve via parametric curve, however, since it depends on a parameter that control the movement of curves (when slithering as snakes) during fitting process, it is rigid topologically, namely, it has not the flexibility to represent objects that composed of variable number of independent parts [80]. Moreover, another widely-recognized issue associated with snake-based segmentation technique is the incapability