HAL Id: hal-02331050
https://hal-ifp.archives-ouvertes.fr/hal-02331050
Submitted on 24 Oct 2019HAL is a multi-disciplinary open access archive for the deposit and dissemination of sci-entific research documents, whether they are pub-lished or not. The documents may come from teaching and research institutions in France or abroad, or from public or private research centers.
L’archive ouverte pluridisciplinaire HAL, est destinée au dépôt et à la diffusion de documents scientifiques de niveau recherche, publiés ou non, émanant des établissements d’enseignement et de recherche français ou étrangers, des laboratoires publics ou privés.
Vandana Rawat, Suryakant Suryakant
To cite this version:
Vandana Rawat, Suryakant Suryakant. A Classification System for Diabetic Patients with Machine Learning Techniques. International Journal of Mathematical, Engineering and Management Sciences, 2019, 4 (3), pp.729 - 744. �10.33889/IJMEMS.2019.4.3-057�. �hal-02331050�
A Classification System for Diabetic Patients with Machine Learning
Techniques
Vandana Rawat
Department of Computer Applications
Graphic Era Deemed to be University, Dehradun, Uttarakhand, India
Corresponding author: [email protected]
Suryakant
IFP Energies Nouvelles (IFPEN) Lyon, France
E-mail: [email protected]
(Received September 21, 2018; Accepted April 4, 2019)
Abstract
Diabetes mellitus (DM) is a group of metallic disorder characterized by steep levels of blood glucose prolonged over a time. It results the defection in insulin production or improper action of the cells to the insulin produced. It is one of the significant public health care challenge worldwide. Diabetes exists in a body when pancreas does not construct enough hormone insulin or the human body is not being able to use the insulin properly. The diagnosis of diabetes (diagnosis, etiopathophysiology, therapy etc.) need to generate and process the vast amount of data. Data mining techniques have proven its usefulness and effectiveness in order to evaluate the unknown relationships or patterns if exists with such vast data. In the present work, five techniques based on machine learning namely, AdaBoost, LogicBoost, RobustBoost,
Naïve Bayes and Bagging have been proposed for the analysis and prediction of DM patients. The proposed techniques are employed on the data set of Pima Indians Diabetes patients. The results computed are found to be very accurate with classification accuracy of 81.77% and 79.69% by bagging and AdaBoost techniques, respectively. Hence, the proposed techniques employed here are highly adorable, effective and efficient in order to predict the DM.
Keywords- Bagging, Boosting techniques, Diabetes mellitus (DM), Machine learning techniques, Naive Bayes Classifier, RobustBoost techniques, Prediction.
1.
Introduction
Diabetes Mellitus (DM) is a chronic disorder resulting due to the deficiency of insulin or abnormality in the use of insulin of carbohydrate, protein and fat metabolism. Insulin is an energy transport. It brings the blood sugar (glucose) into body’s cells and therefore, makes it an important hormone. Excessive of thirst or urination, fatigue, weight loss or blurred vision are some symptom. It causes the risk of polyuria (frequent urination), polydipsia (increasingly thirsty) and polyphagia (hungry). DM is becoming a pre-eminent and foremost reason of death day by day, which is an ordinary non-communicable disease.
India is world second most populated country on the globe and DM has been severely approached epidemic proportions globally. The report of International Diabetes Federation (IDF) (2013), reveals that approximately 50% diabetes infected world populations resides in only three countries: China (98.4 million), India (65.1 million) and the USA (24.4 million) (Varma et al., 2014). Further, IDF reported that 387 million individuals has been severely affected by diabetes worldwide in 2014, and this number is expected to increase up to 300 million by 2025 and 592 million by the 2035 (King et al., 1998).
DM has been prolonged over a time that causes high blood sugar levels and it may be caused at any age. There are different forms of diabetes which depends upon the blood glucose values of the body (Alberti and Zimmet, 1998). So according to these values there are different categories of it like Type 1 diabetes mellitus (T1DM), Type 2 diabetes mellitus (T2DM), and Gestational diabetes, which can take place in any age of a person (Al-Goblan et al., 2014). T1DM is popularly known as juvenile diabetes, usually diagnosed in childhood caused by a DNA abnormality however, it can also occur in adults. T1DM damage the cells that produce insulin because of the autoimmune of the infected body. The infected body is unable to produce sufficient insulin. T1DM has been initiated when immune system destroyed the pancreatic beta cells. This cell is responsible for the generation of insulin hormone that regulates blood glucose.
T2DM is also named as “non-insulin-dependent” or “adult onset diabetes” characterized by hyperglycemia with resistance to ketosis (Xie et al., 2017). T2DM can occur in any stage of life. Most commonly, it takes place in overweight, older and middle-aged people. T2DM has been initiated with the improper consumption of energy in the liver cells, fat and muscles where the insulin resistance cells are incapable to pass on the glucose level inside the body cells. As the need of insulin increases, the ability to produce insulin has been lost by the pancreas gradually. Gestational diabetes occurred due to high blood sugar (glucose) usually found in pregnant females during pregnancy and get disappear after giving birth a baby. Hence, DM may affect the human body by heart disease, nerve damage, kidney diseases (Sharma and Virmani, 2017) and stroke problem. Type-1 and Type-2 DM are long lasting and incurable whereas, Gestational diabetes occurs due to changes in hormonal during the pregnancy period. Furthermore, DM increases the glucose/ sugar level in blood, which causes the disability of the small vessels and produces many of the disease in the body such as heart problems, damaging of nerve cells, affecting the kidney, stroke problems etc. It also increases the probability of sexual dysfunction (Cooper et al., 2003; Hoshi et al, 2005).
To avoid this situation, DM should be essentially recognized at earlier stage with the approach of some efficient and adorable techniques and methods for future outbreak. As per the reported cases of infected DM patients, only 5-6% has been suffered from T1DM and 94-95% of cases has been reported from T2DM. Reports reveals the common factors of T2DM are obesity, older age, family history and physical inactiveness (Wang et al., 2005). Hence, it is important to apply various techniques for predicting the Diabetes for future outbreak. So for predicting diabetes at initial level some of the techniques of machine learning and data mining have proven its usefulness, effectiveness with a high amount of contemplation in the scientific community (Polat and Güneş, 2007).
Since, the data collected from the medical healthcare system in Healthcare Centers or all other sources usually the diabetic data are unstructured in nature and therefore, it is necessary to structure, emphasis its size into nominal value with possible solution and process such a vast data from databases. Hence, conventional manual data analysis has become inadequate for the analysis and prediction. The acquired data doesn’t have any use except some useful information has not been derived from it. Therefore, it’s necessary to evolve the predictive algorithms for high accuracy and ease to approach for analyzing the huge data and convert it into the meaningful information (Acharjya and Anitha, 2017). Hence, to accomplish this goal, various machine learning based predictive analysis has been employed on diabetic patient’s dataset to increase the diagnostic test accuracy with low cost and few human resources. The various machine learning methods have been employed with hybridization of data mining techniques such as statistics, and
game theory. It utilizes the present and past data, process these data using the statistical or other analytical tools, and finally evaluating or predicting or classify certain future events. Machine learning techniques are most suitable techniques for the classification and prediction with high accuracy. Hence, to achieve high accuracy in the prediction of diabetes patients, it becomes necessary to approach these techniques for an appropriate protection. Therefore, the prediction accuracy have been accomplished in the present work and compared with the reported results of previous literature. The purpose of this effort is only to achieve high accuracy based on the proposed Machine Learning Techniques for the diagnosis of diseases such as heart disease and diabetic disease. Hence, these intelligent classification techniques conclusively proved the foremost functional estimation and creation methods to handle such type of diseases. The determination to check the ability and working of different machine learning techniques has been employed for the categorization of heart disease (Acharjya and Anitha, 2017). In context to this study, six machine learning techniques have been employed including Artificial Neural Network (ANN), Support Vector Machine (SVM), logistic regression, k-Nearest Neighbor (k-NN), classification tree and Naive Bayes. For comparison between performances with previous studies some Receiver Operative Characteristic (ROC) and Calibration Graph are also used. Machine learning may be used in different context depending upon the area of application (Kayaer and Yildirim, 2003; Thongkam et al., 2008; Temurtas et al., 2009; Parthibanand Srivatsa, 2012);
Machine learning techniques has been employed to predict and classify many of the biomedical diseases such as for the prediction of heart disease, liver disease, breast cancer survival and diabetes etc. (Tu et al., 2009; Zhang et al., 2009; Kalaiselvi and Nasira, 2015). There are various types of classification techniques, the most popular is neural network structure based general regression, multilayer neural network structure, decision tree C4.5 algorithm, bagging with decision tree C4.5 algorithm and bagging with Naïve Bayes algorithm, Support Vector Machines, Radial Basis Function (RBF), Multi-Layer Perceptron (MLP) and Multi Level Counter Propagation Network (MLCPN) for analysis and prediction of these diseases (Kukar et al., 1997; Hui et al., 2007; Velu and Kashwan, 2013).
Adaboost algorithm is the first real boosting machine learning technique developed for the binary classification. However, this algorithm has been first applied on the dataset in the area of health care for the classification and prediction of breast cancer survival patients to help the medical practitioner to take the decision (Thongkam et al., 2008). In the dataset of PIMA Indian Diabetic patients GRNN (general regression neural network structure) has been applied for better accuracy and for achieving this, ARTMAP-IC structured model is combined with this network structure (Kayaer and Yildirim, 2003). The study (Temurtas et al., 2009) presents the better accuracy on pima-diabetes disease dataset using multilayer neural network structure. In this structure Levenberg–Marquardt (LM) algorithm and a probabilistic neural network structure employed for computing the better accuracy, for diagnosing the Heart Disease for Diabetic Patients, Naïve Bayes and Support Vector Machine techniques have been employed. Since, Heart disease is the leading cause of death; therefore researchers have used several data mining techniques for diagnosing and predicting the heart disease in Diabetic Patients (Parthiban and Srivatsa, 2012).
Some classification techniques such as AdaBoost, LogitBoost and random forest have also been employed for the prediction of many diseases. However, these techniques have first applied to predict the breast cancer (Zhang et al., 2009). Firstly, a small group of sub networks have been created as disease markers and then after they have used for the classification of metastasis. Heart disease prediction is tendered through the medium of decision tree C4.5 algorithm (Farvaresh and
Sepehri, 2011), bagging with decision tree C4.5 algorithm and bagging with Naïve Bayes algorithm (Tu et al., 2009; Jiang et al., 2016; de Sá et al., 2018). These algorithms are spread upon “coronary artery disease” taken from UCI KDD Archive dataset and to build an assess model for the prediction of heart disease. Different metrics have been employed in machine learning and data mining. Some of the important performance parameters are precision, recall, F-measure and ROC space. These parameters have been used to evaluate the best accuracy. It is well known that diabetes and cancer both are the most chronic diseases which have a composite relationship as when the glucose level of human body increase up to the divergent level then it leads to diabetes (Kalaiselvi and Nasira, 2014). So for finding the classification accurately in this dataset, some of the recommender system has been proposed based on adaptive and personalized basal insulin on Kalman filter theory (Torrent-Fontbona, 2018). The proposed algorithm may use with or without continuous glucose monitoring systems.
For the prediction of diabetes and any other disease different number of classification techniques have been implemented such as Radial Basis Function (RBF), Multi-Layer Perceptron (MLP), Multi-Level Counter Propagation Network (MLCPN), Rotation Forest Algorithm, Bagging, Back Propagation Network (BPN), Generalized Discriminate Analysis (GDA) and Least Square Support Vector Machine (LS-SVM) (Polat et al., 2008; Karegowda et al., 2011; Palivela et al., 2013; Velu and Kashwan, 2013). However, some different types of classification techniques which have been introduced but due to some improper balance between datasets, their performance become worst because these have been represented by majority of classes. Hence, some balancing classification technique like RHS-Boost can be applied on them (Gong and Kim, 2017). This technique is applied on misbalancing datasets for finding out the best accuracy and prediction.
In order to achieve the better accuracy, some of the methods such as “modified spline smooth support vector machine (MS-SSVM)” have been employed with proper selection measure. The concentration has been made on the classification of diabetic patients and clubbed 10-fold cross validation method to this vector machine technique with accuracy, confusion matrix, sensitivity and specificity (Thongkam et al., 2008). By working in the field of prediction, some of the techniques may be combined together, for example, "principal component analysis (PCA) and ANFIS, combined together for diagnosing the diabetic patients (Dwivedi, 2018). In first part, 8 attributes of dataset has been divided into 4 attributes using PCA. Hence, diagnosis has done by ANFIS classifier. There are other classification techniques also like MS-SSVM (modified spline smooth support vector machine) which is used for diagnosing diabetic disease (Purnami et al., 2010) and used with the 10-fold cross validation with accuracy, confusion matrix, sensitivity and specificity.
2.
Classification Analysis System Architecture
2.1 Diabetes Dataset Attributes
Since 1965, Pima Indians have resided at the bank of Gila River of Indian Community in southern Arizona, USA. This tribe has involved in a longitudinal study of diabetes and its complications. This Indian community has the highest reported prevalence of infected diabetes on the globe (50% at 35 years of age) (Mercaldo et al., 2017). Since, “The Pima Indians Diabetes
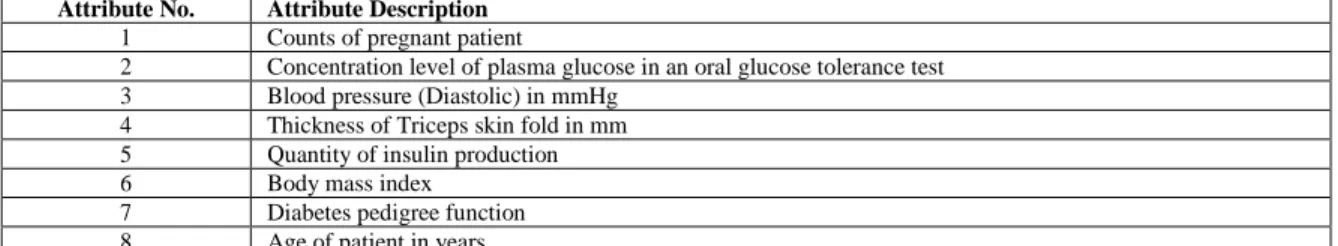
Dataset" includes highest recorded dataset worldwide for the diabetes patient. These datasets are officially maintained by NIDDK (National Institute of Diabetes and Digestive and Kidney Diseases) (Rasooly et al., 2015; Whetzel et al., 2015). A total number of 768 instances have used in dataset, every instance have 8 input attributes (from 1 to 8) and 1 output attribute (Y) as
presented in Table 1.
Table 1. Dataset attributes of PIMA Indian Diabetic patients Attribute No. Attribute Description
1 Counts of pregnant patient
2 Concentration level of plasma glucose in an oral glucose tolerance test 3 Blood pressure (Diastolic) in mmHg
4 Thickness of Triceps skin fold in mm 5 Quantity of insulin production 6 Body mass index
7 Diabetes pedigree function 8 Age of patient in years
All types of input attributes include the numeric data values only with 768 female samples and the very first attribute indicate the counts of the pregnant patient. The next attribute referred to concentration level of glucose in the human body. The third attribute symbolize the measurement of blood pressure (diastolic) in mmHg. The fourth attribute illustrates the thickness of skin fold measured in mm. The fifth, sixth and seventh attributes describes the total quantity of insulin production, body mass index [Body Mass Index (BMI) = (Patient’s weight in kg) / (Patient’s height in meter)] of the infected patients and dependence of diabetes family hierarchy respectively. The last attribute cited to the current age of patients. The proposed classification techniques namely Bagging, Boosting and Naive Bayes Classifier have been employed on the above data set to evaluate the efficient, adorable and fine accuracy.
3. Classification Methods
3.1 AdaBoost
AdaBoost is a type of boosting classification algorithm (Freund and Schapire, 1996; Freund et al., 1999). This algorithm is used to intensify the predictive performance of multiple “weak classifiers” into a single “strong classifier” by focusing on data points. This technique works on "training" and "weighting" of classifiers. It assigns particular weight value to each instance given in the training dataset then iteration applied on the given algorithm. According to iteration the incorrect instances are increased and correct instances are decreased. This iteration is done to get the accuracy over weak classifiers. AdaBoost technique minimizes the exponential loss (Baig et al., 2017) as follows:
The Adaboost Algorithms starts with the consideration of the training set form (a1,b1)...(an,bn), Where ai is the training set which belongs to the A (instance space) and bi belongs to B, where B = (-1,+1) (Li et al., 2008). Adaboost always assigns a weak learning algorithm constantly in a series of different rounds such as m = 1...M. The weight of the training example ‘i’ on round,
where‘t’ is denoted as 𝑇𝑛 (𝑖). The same weight has been set for the starting point (𝑇1(𝑖) = 1 𝑁, 𝑖 = 1 … … … … 𝑁, and the weight for the misclassification will be increased as described in the following seven steps:
(i)
Assign N examples as(ii)
Then,
initialize the weights of 𝑇1(𝑖) = 1𝑁, 𝑖 = 1 … … … . . … 𝑁 for
m=1…….………..M.
(iii)
Now using distribution 𝑇𝑛, Train the weak learner.(iv)
Get weak hypothesis ℎ𝑚∶ 𝐴 → 𝑅 with its error :ℇ𝑛 = ∑𝑖=ℎ𝑚 (𝑎𝑖)≠𝑏𝑖𝑇𝑚 (𝑖) (1)
(v)
Choose
ℇ𝑘𝑚= 𝑅 (2)(vi)
Update : 𝐷𝑚+1(i) = 𝐷𝑚 (𝑖)exp (−𝛼𝑚 𝑏𝑚 𝑀𝑚 (𝑎𝑚)) 𝑐𝑚 (3)where 𝑐𝑚 is a normalization factor which is chosen so that 𝐷𝑚+1 will be a distribution.
(vii)
Output the final hypothesis will be like as follows:𝐻(𝑎) = 𝑠𝑖𝑔𝑛(∑ 𝛼𝑚 ℎ𝑚 (𝑎) 𝑀
𝑚=1 (4)
On the basis of the above algorithm, different types of Adaboost algorithms have been developed such as ARTMAP-IC and GRNN (Kayaer and Yildirim, 2003). Some other Adaboost algorithms may also helped in the decision making of medical practitioners to reduce the cost of medicines etc. Therefore, data pre-processing relief attributes selection and modest Adaboost algorithms may be used for the better outcomes (Gong and Kim, 2017).
3.2 LogitBoost
LogitBoost is a type of binary classification technique. It is a pre-selection method used to perform the additive logistic regression for controlling the datasets with number of descriptive variables. It minimizes the logistic loss whereas the adaboost technique minimizes the exponential loss with training errors (Cusumano-Towner, 2012). It also minimizes the binomial deviance with the following formula:
∑ 𝑤𝑛 log (1 + exp(−2𝑏𝑛 𝑓(𝑎𝑛))) (5) 𝑁
𝑛=1
Here 𝑏𝑛 Є (−1, +1) and 𝑤𝑛 are observation weights normalized up to 1. 𝑓(𝑎𝑛)Є (−∞, +∞), which is the classification score (assumed).
The Binomial deviance allocate less weight to the inadequate misclassified observations means the observations with large negative values of 𝑏𝑛𝑓(𝑎𝑛). By applying LogitBoost, we can get better accuracy than AdaBoostM1.
3.3 RobustBoost
Robustboost boosting algorithm is a modified version of AdaBoost algorithm. It is used for the justification of robustness. As AdaBoost and LogitBoost algorithm increases the weight of incorrect instances by focusing on data points. Hence, weight can become very large due to this type of correlation. However, RobustBoost algorithm has been applied because it allocates the entire data weight to incorrect/misclassified instances (Pouya, 2016). This type of boosting technique is employed to number of application on various classification techniques. Robustboost algorithm doesn't allocate the entire data weights to the poorly misclassified observations. This algorithm may produce better average classification accuracy comparison to others. This algorithm does not minimize a specific loss function as occurred in AdaBoostM1 and LogitBoost. Robustboost algorithm exaggerates the sample number with distribution margin above a defined threshold (Venema, 2016).
The RobustBoost algorithm trains with time evolution. The algorithm initiate with t = 0 and after each iteration, it solves the formulated optimization problem in order to search in a direction of a positive step in interval of time Δt. A similar searching has been formulated to compute positive changes in the average margin for considered training data sample Δk. The algorithm stops and exits the training if any one of three logical conditions becomes positive. The algorithm failed to compute the optimization problem solution in direction of positive updates Δt and Δk, when time
t reaches up to 1. The algorithm is going to breed as many learners as request occurred. The results obtained from this algorithm may set at any of the termination condition. Hence, to achieve better classification accuracy using RobustBoost algorithm, fitc ensemble: Robust_Error_Goal, Robust_Max_Margin, and Robust_Margin_Sigma may set and it starts with the variation of the values for Robust_Error_Goal from 0 to 1.
3.4 Naïve Bayes
A Naïve Bayes classifier is a type of probabilistic classifier. It is usually used for medical diagnosis. This classifier has one of the significant advantage over the other, it require only a small scale of training dataset for estimation. This technique work with the assumption of the existence or existence of a specific feature of a class that is unrelated to the existence or non-existence of any other feature (Farid et al., 2014). Naive Bayes Classifier focuses only on the textual content of the messages. The working filters consider the information such as the existence of doubtful headers, which add the additional attributes in the message representation. For example, let us consider an experiment in which all messages are denoted such as vector vx1 .
. . . .vxn where, x1 ……….. xn are the values of attributes. All the attributes gives the
information of specific token of the messages. In the easiest case, every attributes are from Boolean:
𝑋𝑖 = 1 , (if the message holds the token); 𝑋𝑖 = 0 , (else).
From Bayes’ theorem, the probability that a message with vector x⃗ = 𝑥1… … … … . 𝑥𝑚 which
p(𝑐|𝑥 ) =p(𝑐). p(𝑥 |𝑐)
p(𝑥 ) (6)
3.5 Bagging
Bagging is one of an ensemble data mining techniques. It generates multiple classifier versions and aggregates the dataset predictions (Perveen et al., 2016). The numeric prediction works with the averaging the individual resultant prediction whereas, classifiers decide the prediction class by voting system of each predictors votes. However, for the better accuracy the requirement of bagging is instability of the underlying predictors. Instability of the predictor means significant changes in the predictor construction if any of perturbation of training set causes.
Bagging is also known as “bootstrap aggregation,” because of the ensemble learning properties. In this algorithm bagging of a weak learner on a dataset has been done by generation of many bootstrap replicas on this dataset and decision trees have been grown on these replicas. Each bootstrap replica has been obtained by selecting N observations randomly out of N with replacement, where N is the size of dataset. Finally, an average has been computed over predictions from individual trees to compute the predicted response of a trained ensemble. Equation (7) represents the formula to find the result for the assumed dataset.
𝑒𝑎𝑑𝑑𝑎𝑣𝑒 = 𝐸𝑇 {𝐸𝑡2𝑏 |𝑇= 𝑡𝜖 (𝑥𝑏(𝑡𝐵) + 1
𝑚 [𝑉𝑡𝐵|𝑇=𝑡 𝜖(𝑥𝑏(𝑡
𝐵); )𝑡𝐵])} (7)
In this equation eaddave is allocated by the same bias component of the prospect added error eadd
of a single bootstrap. Here 1
m is denoting the variance component. If the ensemble size m
increases than the 1
m (bagging expected error) decrease and will be equals to single bias
component of single bootstrap as ET {Et2b |T=tɛ (xb(tB); tB)}. This result holds a training set t,
without taking the expectation over T.
4. Measurement and Experimental Result
4.1 Gold Standards Test
Gold standards test refers to a diagnostic test that is the best available test under reasonable conditions. Following are some conditions with description, which are applied in gold standards which are tabulated in Table 2.
Table 2. Conditions for GOLD standards test
Sr. No Condition Description
1 True positive Sick people correctly diagnosed as sick 2 False positive Healthy people incorrectly identified as sick 3 True negative Healthy people correctly identified as healthy 4 False negative Sick people incorrectly identified as healthy
4.2 Sensitivity
In terms of Gold standard, sensitivity means the capacity to correctly choose the positive patients who are suffered with the disease. Basically, sensitivity has been used to determine any disease in
classification technique and therefore, sensitivity of the test is equal to the proportion of number of true positive patients and total number of sick individuals in population. Mathematically, it may be represented as Equation (8):
𝑆𝑒𝑛𝑠𝑖𝑡𝑖𝑣𝑖𝑡𝑦 = 𝑛𝑢𝑚𝑏𝑒𝑟 𝑜𝑓 𝑇𝑃
𝑇𝑃 + 𝐹𝑁 (8)
where TP represents True Positive and FN represents False Negative.
Sensitivity means the probability of positive test that patients have the disease.
4.3 Specificity
In terms of Gold standard, specificity relates to choose the patients correctly but without any condition. In classification technique, when we diagnose the disease by applying the classification technique then it is equal to the number of true negative patients divided by total number of individuals in dataset. It is formulated as in Equation (9):
𝑆𝑝𝑒𝑐𝑖𝑓𝑖𝑐𝑖𝑡𝑦 = 𝑛𝑢𝑚𝑏𝑒𝑟 𝑜𝑓 𝑇𝑁
𝑇𝑁 + 𝐹𝑃 (9)
where TN represents True Negative and FP represents False Positive.
A positive result in any classification test with high range of specificity is effective for taking any decision in any type of disease.
4.4 Positive Predictive Value
In terms of Gold Standard, the positive predictive value (PPV) is an event and it predict only the positive prediction. Positive prediction is done by false positive (FP) event. Mathematically, it is defined by Equation (10):
𝑃𝑜𝑠𝑖𝑡𝑖𝑣𝑒 𝑃𝑟𝑒𝑑𝑖𝑐𝑡𝑖𝑣𝑒 𝑉𝑎𝑙𝑢𝑒 = 𝑛𝑢𝑚𝑏𝑒𝑟 𝑜𝑓 𝑇𝑃
𝑇𝑃 + 𝐹𝑃 (10)
where TP represents True Positive and FP represents False Positive.
4.5 Negative Predictive Value
Negative predictive value (NPV) predicts the true negatives among the complete dataset by choosing negative test. It represents the negative result for statistics and diagnostic test with the defined mathematical equation. It is equal to probability of patient not having any disease when test is negative. This can be done with the following formula:
𝑁𝑒𝑔𝑎𝑡𝑖𝑣𝑒 𝑃𝑟𝑒𝑑𝑖𝑐𝑡𝑖𝑣𝑒 𝑉𝑎𝑙𝑢𝑒 = 𝑛𝑢𝑚𝑏𝑒𝑟 𝑜𝑓 𝑇𝑁
𝐹𝑁 + 𝑇𝑁 (11)
4.6 Accuracy
Accuracy of a measurement system represents number of correctly diagnosed patients in dataset weather it is positive or negative. This can be calculated with the following mathematical formula as shown in Equation (12):
𝐴𝑐𝑐𝑢𝑟𝑎𝑐𝑦 = 𝑇𝑃 + 𝑇𝑁
𝑇𝑃 + 𝑇𝑁 + 𝐹𝑃 + 𝐹𝑁 (12)
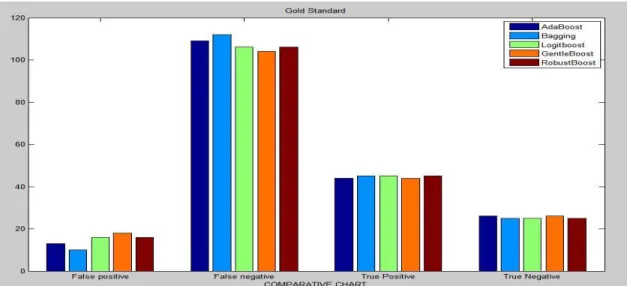
Figure 1. Comparison chart for GOLD standards
Figure 1 compare the performance of proposed machine learning techniques called as AdaBoost, LogitBoost, RobustBoost, Naïve Bayes and Bagging based on their GOLD standards. It is found that bagging algorithm is the most efficient predictive techniques compared to others.
5. Experimental Result
5.1 Results with Adaboost Technique
The Adaboost technique algorithm has been employed on the considered testing data sets and the overall accuracy has been found to 79.68%. However, this algorithm improves the accuracy marginally over the neural network techniques. The generated confusion matrix is illustrated by Table 3.
Table 3. Confusion matrix with Adaboost technique
Predicted -> False True
False 109 13
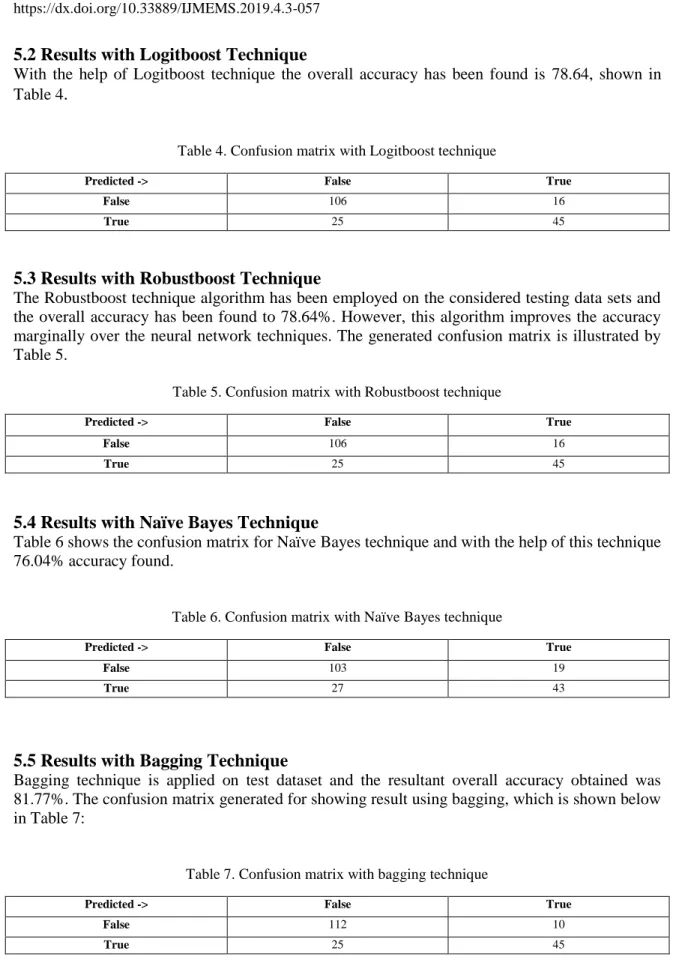
5.2 Results with Logitboost Technique
With the help of Logitboost technique the overall accuracy has been found is 78.64, shown in Table 4
.
Table 4. Confusion matrix with Logitboost technique
Predicted -> False True
False 106 16
True 25 45
5.3 Results with Robustboost Technique
The Robustboost technique algorithm has been employed on the considered testing data sets and the overall accuracy has been found to 78.64%. However, this algorithm improves the accuracy marginally over the neural network techniques. The generated confusion matrix is illustrated by Table 5.
Table 5. Confusion matrix with Robustboost technique
Predicted -> False True
False 106 16
True 25 45
5.4 Results with Naïve Bayes Technique
Table 6 shows the confusion matrix for Naïve Bayes technique and with the help of this technique 76.04% accuracy found.
Table 6. Confusion matrix with Naïve Bayes technique
Predicted -> False True
False 103 19
True 27 43
5.5 Results with Bagging Technique
Bagging technique is applied on test dataset and the resultant overall accuracy obtained was 81.77%. The confusion matrix generated for showing result using bagging, which is shown below in Table 7:
Table 7. Confusion matrix with bagging technique
Predicted -> False True
False 112 10
6.
Result and Comparison with Performance Measure
6.1 Result Analysis
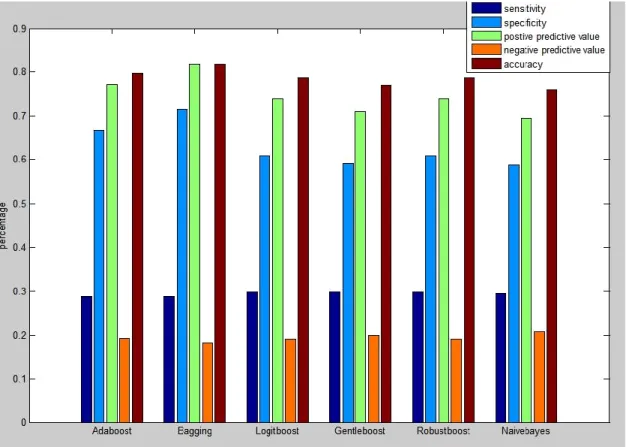
In this study, the prediction competences of six machine learning techniques have been employed for the classification of diabetes. Total number of 768 instances has been used in this dataset. Every instance has eight input attributes and one output attribute. The predicted results using the six proposed machine learning techniques with confusion matrix of Adaboost, Logitboost, Robustboost, Naive Bayes and Bagging have been presented in Tables 3 to 7 respectively. All the predicted results using the proposed techniques have been compared and plotted in Figure 2. The predicted results clearly reveal that bagging algorithm predicts highest accuracy as comparison to other technique.
Figure 2. Comparison Result with applied machine learning techniques
6.2 Comparison with Previous Techniques
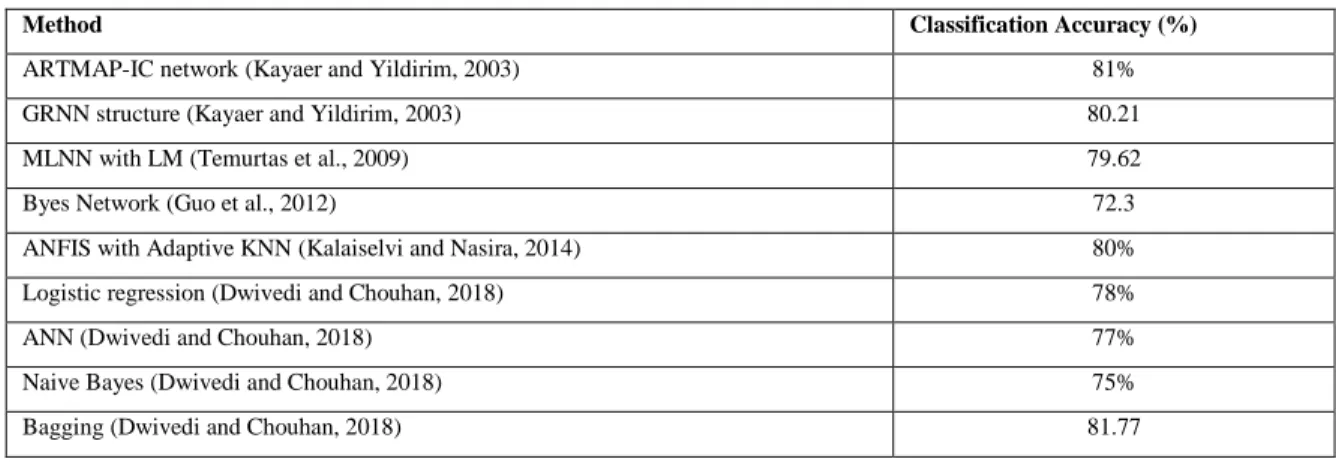
In this study, a comparative analysis has been made with proposed techniques and previous reported studies in the Table 8. The first comparison has been made with ARTMAP-IC network and GRNN structure (Kayaer and Yildirim, 2003) and is found the accuracy of 81% and 80.21% respectively. In second study, (Temurtas et al., 2009) MLNN with LM method (10*FC) has been used and results with classification accuracy of 79.62. The next algorithm has been considered to
compare the predicted results is Bayes Network (Guo et al., 2012). Bayes Network has been implemented for the classification and result yield with accuracy of 72.3%. The next study has been considered with the use of ANFIS with Adaptive kNN algorithm (Kalaiselvi and Nasira, 2014) and employed on the considered dataset with accuracy of 80%. The next algorithm has been implemented very recently in 2018 (Dwivedi and Chouhan, 2018). These algorithms are Logistic regression, ANN and Naive Bayes and its results revels the accuracy of 78%, 77% and 75% respectively. Finally, the proposed algorithm, Bagging has been implemented on the same database and generating the accuracy of 81.77%. The result clearly indicates that Bagging algorithm yield highest accuracy than others compared to others.
Table 8. Comparison with previous techniques
Method Classification Accuracy (%)
ARTMAP-IC network (Kayaer and Yildirim, 2003) 81%
GRNN structure (Kayaer and Yildirim, 2003) 80.21
MLNN with LM (Temurtas et al., 2009) 79.62
Byes Network (Guo et al., 2012) 72.3
ANFIS with Adaptive KNN (Kalaiselvi and Nasira, 2014) 80%
Logistic regression (Dwivedi and Chouhan, 2018) 78%
ANN (Dwivedi and Chouhan, 2018) 77%
Naive Bayes (Dwivedi and Chouhan, 2018) 75%
Bagging (Dwivedi and Chouhan, 2018) 81.77
7. Conclusion
Prediction of diabetes in the primary stage is better to cure. Therefore, some of the important Machine Learning Techniques have been applied to present work for the classification of "Diabetes Prediction" based on eight attributes. The considered machine learning techniques are
AdaBoost, LogitBoost, Robust Boost, Naïve Bayes and Bagging. The proposed algorithms have been employed on the database of PIMA Indian Diabetic patients for classification diabetic patients. Out of these techniques, Bagging performed the highest accuracy of 81.77% in comparison to other proposed techniques and previous reported studies. Hence, the proposed technique i.e. bagging implemented in the present work is highly adorable, effective and efficient in order to predict the diabetic patients. Additionally, this work can be considered for the functional diabetes prediction as it is generalizing the best accuracy.
Conflict of interest
The authors confirm that there is no conflict of interest to declare for this publication.
Acknowledgement
The authors would like to express their sincere thanks to the Graphic Era Deemed to be University for providing the resources and support to complete this paper.
References
Acharjya, D., & Anitha, A. (2017). A comparative study of statistical and rough computing models in predictive data analysis. International Journal of Ambient Computing and Intelligence, 8(2), 32-51. Alberti, K.G. M.M., & Zimmet, P.F. (1998). Definition, diagnosis and classification of diabetes mellitus
and its complications. Part 1: diagnosis and classification of diabetes mellitus. Provisional report of a WHO consultation. Diabetic Medicine, 15(7), 539-553.
Al-Goblan, A.S., Al-Alfi, M.A., & Khan, M.Z. (2014). Mechanism linking diabetes mellitus and obesity. Diabetes, Metabolic Syndrome and Obesity: Targets and Therapy, 7, 587-591
Baig, M.M., Awais, M.M., & El-Alfy, E.S.M. (2017). AdaBoost-based artificial neural network learning. Neurocomputing, 248, 120-126.
Cooper, H.C., Booth, K., & Gill, G. (2003). Patients’ perspectives on diabetes health care education. Health Education Research, 18(2), 191-206.
Cusumano-Towner, M. (2012). Boosting with log-loss. Link: https://pdfs.semanticscholar.org/1b3f/cf95f1f5450aa676bd6935851dd8dc121afd.pdf
de Sá, A.G., Pereira, A.C., & Pappa, G.L. (2018). A customized classification algorithm for credit card fraud detection. Engineering Applications of Artificial Intelligence, 72, 21-29.
Dwivedi, A.K. (2018). Analysis of computational intelligence techniques for diabetes mellitus prediction. Neural Computing and Applications, 30(12), 3837–3845.
Dwivedi, A.K., & Chouhan, U. (2018). Comparative study of artificial neural network for classification of hot and cold recombination regions in Saccharomyces cerevisiae. Neural Computing and Applications, 29(2), 529-535.
Farid, D.M., Zhang, L., Rahman, C.M., Hossain, M.A., & Strachan, R. (2014). Hybrid decision tree and naïve Bayes classifiers for multi-class classification tasks. Expert Systems with Applications, 41(4), 1937-1946.
Farvaresh, H., & Sepehri, M.M. (2011). A data mining framework for detecting subscription fraud in telecommunication. Engineering Applications of Artificial Intelligence, 24(1), 182-194.
Freund, Y., & Schapire, R.E. (1996, July). Experiments with a new boosting algorithm. In Machine Learning: Proceedings of the Thirteenth International Conference (Vol. 96, pp. 148-156).
Freund, Y., Schapire, R., & Abe, N. (1999). A short introduction to boosting. Journal-Japanese Society for Artificial Intelligence, 14(5) (771-780), 1612.
Gong, J., & Kim, H. (2017). RHSBoost: Improving classification performance in imbalance data. Computational Statistics & Data Analysis, 111, 1-13.
Guo, Y., Bai, G., & Hu, Y. (2012, December). Using Bayes network for prediction of type-2 diabetes. In 2012 International Conference for Internet Technology and Secured Transactions (pp. 471-472). IEEE.
Hoshi, K., Kawakami, J., Kumagai, M., Kasahara, S., Nishimura, N., Nakamura, H., & Sato, K. (2005). An analysis of thyroid function diagnosis using Bayesian-type and SOM-type neural networks. Chemical and Pharmaceutical Bulletin, 53(12), 1570-1574.
Hui, S.C., He, Y., & Thach, D.T.C. (2007, December). Machine learning for tongue diagnosis. In 2007 6th International Conference on Information, Communications & Signal Processing (pp. 1-5). IEEE. Jiang, L., Li, C., Wang, S., & Zhang, L. (2016). Deep feature weighting for naive Bayes and its application
Kalaiselvi, C., & Nasira, G.M. (2014, February). A new approach for diagnosis of diabetes and prediction of cancer using ANFIS. In 2014 World Congress on Computing and Communication Technologies (pp. 188-190). IEEE.
Kalaiselvi, C., & Nasira, G.M. (2015). Prediction of heart diseases and cancer in diabetic patients using data mining techniques. Indian Journal of Science and Technology, 8(14), 1-7
Karegowda, A.G., Manjunath, A.S., & Jayaram, M.A. (2011). Application of genetic algorithm optimized neural network connection weights for medical diagnosis of pima Indians diabetes. International Journal on Soft Computing, 2(2), 15-23.
Kayaer, K., & Yildirim, T. (2003, June). Medical diagnosis on Pima Indian diabetes using general regression neural networks. In Proceedings of the International Conference on Artificial Neural Networks and Neural Information Processing (ICANN/ICONIP) (pp. 181-184).
King, H., Aubert, R.E., & Herman, W.H. (1998). Global burden of diabetes, 1995–2025: prevalence, numerical estimates, and projections. Diabetes Care, 21(9), 1414-1431.
Kukar, M., Groselj, C., Kononenko, I., & Fettich, J.J. (1997, June). An application of machine learning in the diagnosis of ischaemic heart disease. In Proceedings of Computer Based Medical Systems (pp. 70-75). IEEE.
Li, X., Wang, L., & Sung, E. (2008). AdaBoost with SVM-based component classifiers. Engineering Applications of Artificial Intelligence, 21(5), 785-795.
Mercaldo, F., Nardone, V., & Santone, A. (2017). Diabetes mellitus affected patients classification and diagnosis through machine learning techniques. Procedia Computer Science, 112, 2519-2528.
Palivela, H., Yogish, H.K., Vijaykumar, S., & Patil, K. (2013, February). Survey on mining techniques for breast cancer related data. In 2013 International Conference on Information Communication and Embedded Systems (ICICES) (pp. 540-546). IEEE.
Parthiban, G., & Srivatsa, S.K. (2012). Applying machine learning methods in diagnosing heart disease for diabetic patients. International Journal of Applied Information Systems, 3(7), 2249-0868.
Perveen, S., Shahbaz, M., Guergachi, A., & Keshavjee, K. (2016). Performance analysis of data mining classification techniques to predict diabetes. Procedia Computer Science, 82, 115-121.
Polat, K., & Güneş, S. (2007). An expert system approach based on principal component analysis and adaptive neuro-fuzzy inference system to diagnosis of diabetes disease. Digital Signal Processing, 17(4), 702-710.
Polat, K., Güneş, S., & Arslan, A. (2008). A cascade learning system for classification of diabetes disease: Generalized discriminant analysis and least square support vector machine. Expert Systems with Applications, 34(1), 482-487.
Pouya, O.R. (2016, May). A new margin-based AdaBoost algorithm: Even more robust than RobustBoost to class-label noise. In 2016 IEEE Canadian Conference on Electrical and Computer Engineering (CCECE) (pp. 1-5). IEEE.
Purnami, S.W., Zain, J.M., & Embong, A. (2010, March). A new expert system for diabetes disease diagnosis using modified spline smooth support vector machine. In International Conference on Computational Science and Its Applications (pp. 83-92). Springer, Berlin, Heidelberg.
Rasooly, R.S., Akolkar, B., Spain, L.M., Guill, M.H., Del Vecchio, C.T., & Carroll, L.E. (2015). The national institute of diabetes and digestive and kidney diseases central repositories: a valuable resource for nephrology research. Clinical Journal of the American Society of Nephrology, 10(4), 710-715.
Sharma, K., & Virmani, J. (2017). A decision support system for classification of normal and medical renal disease using ultrasound images: A decision support system for medical renal diseases. International Journal of Ambient Computing and Intelligence, 8(2), 52-69.
Temurtas, H., Yumusak, N., & Temurtas, F. (2009). A comparative study on diabetes disease diagnosis using neural networks. Expert Systems with Applications, 36(4), 8610-8615.
Thongkam, J., Xu, G., & Zhang, Y. (2008, June). AdaBoost algorithm with random forests for predicting breast cancer survivability. In 2008 IEEE International Joint Conference on Neural Networks (IEEE World Congress on Computational Intelligence) (pp. 3062-3069). IEEE.
Thongkam, J., Xu, G., Zhang, Y., & Huang, F. (2008, January). Breast cancer survivability via AdaBoost algorithms. In Proceedings of the second Australasian workshop on Health data and knowledge management-Volume 80 (pp. 55-64). Australian Computer Society, Inc..
Torrent-Fontbona, F. (2018). Adaptive basal insulin recommender system based on Kalman filter for type 1 diabetes. Expert Systems with Applications, 101, 1-7.
Tu, M.C., Shin, D., & Shin, D. (2009, December). A comparative study of medical data classification methods based on decision tree and bagging algorithms. In 2009 Eighth IEEE International Conference on Dependable, Autonomic and Secure Computing (pp. 183-187). IEEE.
Varma, R., Bressler, N.M., Doan, Q.V., Gleeson, M., Danese, M., Bower, J.K., & Turpcu, A. (2014). Prevalence of and risk factors for diabetic macular edema in the United States. JAMA Ophthalmology, 132(11), 1334-1340.
Velu, C.M., & Kashwan, K.R. (2013, February). Multi-Level counter propagation network for diabetes classification. In 2013 International Conference on Signal Processing, Image Processing & Pattern Recognition (pp. 190-194). IEEE.
Venema, V. (2016). Non-Convex potential function boosting versus noise peeling:-a comparative study. (Dissertation). Retrieved from http://urn.kb.se/resolve?urn=urn:nbn:se:uu:diva-302289.
Wang, Y., Klijn, J.G., Zhang, Y., Sieuwerts, A.M., Look, M.P., Yang, F., & Jatkoe, T. (2005). Gene-expression profiles to predict distant metastasis of lymph-node-negative primary breast cancer. The Lancet, 365(9460), 671-679.
Whetzel, P.L., Grethe, J.S., Banks, D.E., & Martone, M.E. (2015). The NIDDK Information Network: a community portal for finding data, materials, and tools for researchers studying diabetes, digestive, and kidney diseases. PloS one, 10(9), e0136206.
Xie, J., Liu, Y., Zeng, X., Zhang, W., & Mei, Z. (2017). A Bayesian network model for predicting type 2 diabetes risk based on electronic health records. Modern Physics Letters B, 31(19-21), 1740055. Zhang, W., Zeng, F., Wu, X., Zhang, X., & Jiang, R. (2009, August). A comparative study of ensemble
learning approaches in the classification of breast cancer metastasis. In 2009 International Joint Conference on Bioinformatics, Systems Biology and Intelligent Computing (pp. 242-245). IEEE.
Original content of this work is copyright © International Journal of Mathematical, Engineering and Management Sciences. All rights reserved. Except of uses under a Creative Commons Attribution 4.0 International (CC BY 4.0) license at https://creativecommons.org/licenses/by/4.0/