Knowledge Management International Conference (KMICe) 2012, Johor Bahru, Malaysia, 4 – 6 July 2012 102
Prediction Accuracy Measurements for Ensemble Classifier
Abdullah
1and Ku Ruhana Ku-Mahamud
21Universitas Islam Indragiri, Indonesia, [email protected] 2Universiti Utara Malaysia, Malaysia, [email protected] ABSTRACT
Multiple classifier combination (or ensemble method) has been shown to be very helpful in improving the performance of classification over single classifier approach. The diversity among base classifiers (or ensemble members) is important when constructing a classifier ensemble. Although there have been several measures of diversity, but there is no reliable measure that can predict the ensemble accuracy. The base classifiers accuracy will increase when the diversity decreases and this is known as the accuracy-diversity dilemma. This paper presents a new method to measure diversity in classifier ensembles. Furthermore another parameter which based on this diversity measure is defined. It is hope that the new parameter will be able to predict the ensemble accuracy. Based on experimental results on classification of 84 samples of fruit images using nearest mean classifier ensembles, it has been shown that there is a positive linear relationship between the new parameter and the ensemble accuracy. This parameter is expected to assist in constructing diverse and accurate ensemble.
Keywords: Classification, multiple classifier
combination, diversity measure.
I INTRODUCTION
Multiple classifier combination aims to obtain the final classification decision by integrating the output of several individual classifiers (Xie et al., 2006; Han et al., 2007). The concept of multiple classifier combination was first proposed by Suen et al. (1990) in order to improve the results of character recognition (He & Suen, 2007). This research area is now defined by different names in the literature such as multiple classifier system, combining classifiers, classifier ensembles, committees of learner, mixtures of experts, the consensus theory, hybrid methods, decision combination, multiple experts, mixture of experts, classifier ensembles, cooperative agents, opinion pool, sensor fusion, and more (Parvin et al, 2009). Multiple classifier combination has been shown to be very helpful in improving the performance of classification over single classifier approach (Han & Yang, 2007; Du et al., 2009).
The ensembles construction is to construct a set of classifiers as a base classifier of multiple classifier combination. The construction of the classifier ensembles aimed to create a set of “complementary” classifiers. For this purpose, the classifier must be built as diverse as possible (Kuncheva & Whitaker, 2003). In an ensemble, the combination is only useful if they disagree about some inputs (Tumer & Ghosh, 1996). Several techniques have been proposed for constructing a set of diverse classifiers. Roli (2009) generally summarized several techniques to build a classifier ensemble as follows : (1) using different base classifiers (2) injecting randomness (3) manipulating training data (4) manipulating input features and (5) manipulating output labels. All these techniques try to induce classifier diversity, i.e. to create classifiers that make errors on different patterns, thus they can be combined effectively. There are some techniques that have been proposed to construct an ensemble classifier by considering both the accuracy of base classifiers and the diversity among them. However, there is no accepted formal definition about the diversity and how diversity can be used in designing the classifier ensembles (Kuncheva & Whitaker, 2003).
A. Input Features Manipulation
Input features are manipulated for the purpose of constructing accurate and diverse classifier ensemble. This approach assigns different subset of features among individual classifiers in the ensemble (usually, the same base classifier is used). The main method of this approach is the Random Subspace Method (Ho, 1998) which assigns a random subset of the original features to individual classifier (on the same training samples). Feature subsets can overlap, and their size is usually identical. Other methods that have similar idea with this method is the Multiple Feature Subsets (Bay, 1998) and Attributes Bagging (Bryll et al., 2002). All these methods are similar in the way they assign features randomly to individual classifier in ensemble. The only difference is in the determination of subset and ensemble size. A new method that uses this approach is the feature subset clustering. In this technique the feature set clusters into different feature subset. Ensembles constructed by assigning each individual classifier in the ensemble with a cluster of different feature subset
Knowledge Management International Conference (KMICe) 2012, Johor Bahru, Malaysia, 4 – 6 July 2012 103
from the pool of available features. The advantage of this method is that all information available on the training set is used. There is no irrelevant features are eliminated. Irrelevant feature does not need to be eliminated in multiple classifier combination, because these omitted features might contain valuable information. For this reason we chose this technique for constructing diverse classifier ensemble in this study.
B.Multiple Nearest Mean Classifiers
Multiple NMC combination includes NMC ensembles and a combination rule. The nearest mean classifier (NMC) was introduced by Fukunaga (1990) as a classifier which uses the similarity between patterns to determine the classification. For each class, NMC computes the class means (or centroid) of the training patterns. The similarity value is obtained by calculating the euclidean distance between feature vector of training pattern and feature vector of unknown pattern. NMC classifies each unknown pattern to the class whose class mean is closest to this pattern. The NMC has been successfully applied to many classification problems and has shown good performances and very robust (Shin & Kim, 2009). Furthermore NMC provides good performance for small sample (training) problem (Veenman & Tax, 2005). Small sample (training) problems are problems with number of samples smaller than the number of features (Jain & Chandrasekaran, 1982). In this study the nearest mean classifier combination is used. To induce the diverse in ensembles, manipulating input features approach is applied. This way is to partition the input features and assign them to the individual NMC in the ensemble. No information in the training set is discarded. For the combination rule we use normalized sum rule. This rule generates the combination distance which obtained by sum of euclidean on each individual NMC after distance normalization performed. The final decision of classification is done by classifying the unknown pattern into a class that is closest to the mean class based on the combination distance.
C.Diversity Measures in Classifier Ensembles
In recent years, there exist a number of measures of diversity which have been proposed. Most of them are adapted from existing statistical measures. In practice, measures of diversity can be categorized into two groups: pairwise (the Q statistic, the correlation, the disagreement and the double fault)
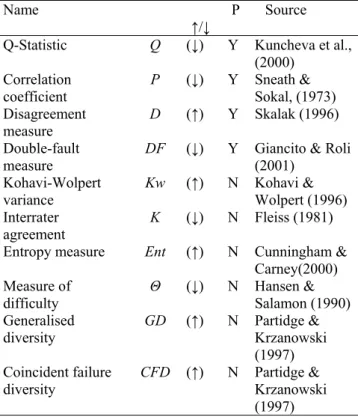
and non-pairwise non-pairwise diversity measures (the entropy of the votes, the difficulty index, the Kohavi-Wolpert variance, the interrater agreement, the generalized diversity, and the coincident failure diversity). Table 1 below shows several measures of diversity. The arrow specifies whether diversity is greater if the measure is lower (↓) or greater (↑). ‘P’ stands for ‘Pairwise’.
Table 1. Summary Of The 10 Measure Of Diversity (Kuncheva & Whitaker, 2003)
Name ↑/↓
P Source Q-Statistic Q (↓) Y Kuncheva et al.,
(2000) Correlation
coefficient Ρ (↓) Y Sneath Sokal, (1973) & Disagreement
measure D (↑) Y Skalak (1996) Double-fault
measure DF (↓) Y Giancito (2001) & Roli Kohavi-Wolpert
variance Kw (↑) N Kohavi Wolpert (1996) & Interrater
agreement K (↓) N Fleiss (1981) Entropy measure Ent (↑) N Cunningham &
Carney(2000) Measure of
difficulty Θ (↓) N Hansen Salamon (1990) & Generalised
diversity GD (↑) N Partidge Krzanowski & (1997) Coincident failure diversity CFD (↑) N Partidge & Krzanowski (1997)
Pairwise is calculated for each pair of classifier in the ensemble and then averaged, while the non-pairwise try to measure the diversity of a set of classifiers directly
Experimental studies have been conducted to compare several different measures of diversity, but the results are confusing. There was no clear relationship between the diversity and the accuracy of multiple classifier combination (Kuncheva & Whitaker, 2003). The main problem in performing measure of diversity is the accuracy-diversity (Li & Gao, 2010). When the base classifier approached the highest level of accuracy, diversity must decrease. It is expected that there will be a trade-off between diversity and accuracy. There has been no theoretical or experimental study that shows there is a reliable measure of diversity which is able to predict the accuracy of the classifier ensemble (Canuto et al., 2007). This study proposed a new measure of diversity and a parameter that can predict the accuracy of ensemble. This parameter is
Knowledge Management International Conference (KMICe) 2012, Johor Bahru, Malaysia, 4 – 6 July 2012 104
expected to assist in constructing of diverse and accurate ensemble.
II A NEW MEASURE OF DIVERSITY
In constructing the new measure of diversity, we let
D = {D1,…,DL } be a set of classifiers (pool,
committee, mixture, team, ensemble). In addition, let Ω= {ω1,…,ωc } be a set of class labels and x
∈ Rn= be a vector with n features to be labeled in Ω.Let Z = {z1,…,zN} be a labeled data set, zj∈Rn
be a feature vector with n features for data instance j. The output of a classifier Di can be represented as
an N-dimensional vector v=[ Di(z1),
Di(z2),…,Di(zN) ]T such that Di(zj) = 1 if Di
recognize correctly zj and 0 otherwise, i=1,…,L
and j=1,…,N. We denote ̅ to be the average
accuracy of base classifiers as follows:
̅ 1 1
Let Z = {z1,…,zN} be a labeled data set, zj∈Rn be a
feature vector with n features for data instance j and ωj ∈Ω is the label for data instance j. Each
classifier Di (i = 1, . . ., L) assigns an input feature vector z∈ Rn to one of the class label from Ω. i.e.,
Di : Rn Ω. The output of an ensemble of
classifiers isan L dimensional vector r = [D1(z), . . . , DL(z)]T containing the decisions of eachclassifier. The support value is proposed as a new measurement of diversity. It is the ratio between the number of observations on which all of classifier are correct to the total number of observations. In this way the diversity of a set of classifiers measured directly (non-pairwise). The new measure of diversity ( ) is given as:
1 2 where 1 ∶ if 1 2 ⋯ 0 ∶
Previous studies have shown that the success of ensemble method depends on diversity and accuracy of base classifiers. Based on these reasons, another parameter ( ), is defined for prediction of ensemble accuracy given as follows:
̅ 3
III EXPERIMENTAL RESULTS
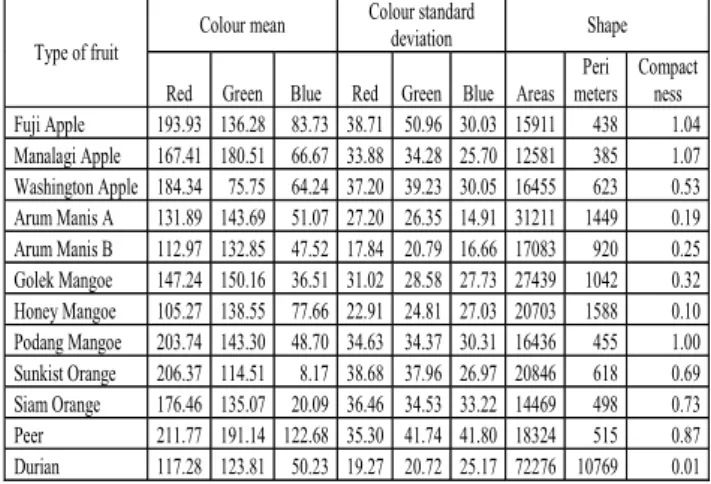
In this section, the results of experiment that describe the relationship between the new diversity and ensemble accuracy are presented. The dataset used for this study is from a sample of 84 fruits images that correspond to 12 categories have been used to form the reference values for each category. All images were of 640 x 480 pixels with 24-bit true colour, 256 levels of gray and RGB colour model. The types of fruits that were used are limited to variants of apples, mangoes, oranges, pears and durian. There are 9 features in the fruit’s image data set which consists of mean and standard deviation on each channel of RGB, area, perimeter and compactness. The reference of feature values as shown in Table 2 below.
Table 2. Reference Feature Values
Type of fruit Colour mean
Colour standard
deviation Shape Red Green Blue Red Green Blue Areas
Peri meters Compact ness Fuji Apple 193.93 136.28 83.73 38.71 50.96 30.03 15911 438 1.04 Manalagi Apple 167.41 180.51 66.67 33.88 34.28 25.70 12581 385 1.07 Washington Apple 184.34 75.75 64.24 37.20 39.23 30.05 16455 623 0.53 Arum Manis A 131.89 143.69 51.07 27.20 26.35 14.91 31211 1449 0.19 Arum Manis B 112.97 132.85 47.52 17.84 20.79 16.66 17083 920 0.25 Golek Mangoe 147.24 150.16 36.51 31.02 28.58 27.73 27439 1042 0.32 Honey Mangoe 105.27 138.55 77.66 22.91 24.81 27.03 20703 1588 0.10 Podang Mangoe 203.74 143.30 48.70 34.63 34.37 30.31 16436 455 1.00 Sunkist Orange 206.37 114.51 8.17 38.68 37.96 26.97 20846 618 0.69 Siam Orange 176.46 135.07 20.09 36.46 34.53 33.22 14469 498 0.73 Peer 211.77 191.14 122.68 35.30 41.74 41.80 18324 515 0.87 Durian 117.28 123.81 50.23 19.27 20.72 25.17 72276 10769 0.01
In this study, manipulating input features approach was used to construct diverse ensembles. A Matlab program was designed to construct the nearest mean classifier ensembles by manipulating all possible input feature subset. Nearest mean classifier was chosen with the consideration that the classifier is suitable for this approach. Every ensemble that has been constructed which consists of 2 to 4 groups of features. Nevertheless no information about features in the training set is discarded.
In this experiment, there are two independent variables, the new diversity measure namely support ( and the average measure of average
accuracy of base classifiers ( ̅), while the
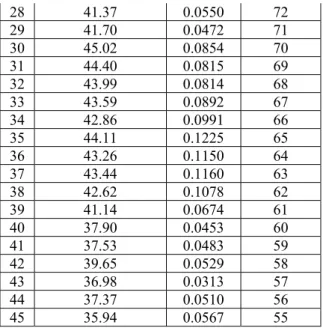
dependent variable is the ensemble accuracy (y). The diversity measure and the average of accuracy measure were calculated using equation (1) and (2), while the ensemble accuracy was evaluated using 10 k-fold validation method. Table 3 describes 45 pairs values of ̅ and and the ensemble accuracy (y) of the each pair. The value of ̅ describes the
Knowledge Management International Conference (KMICe) 2012, Johor Bahru, Malaysia, 4 – 6 July 2012 105
average base classifier and the value of describes the value of diversity. For ease of observation data in the table has been sorted according to the ensemble accuracy. It appears that small value of produces good ensemble accuracy, only if the average base classifier accuracy is high. It is clear that the value of s alone is not enough to predict the accuracy of the ensemble. Ensemble accuracy is affected by both of them. To investigate the effects of both base classifier accuracy and diversity value thus the multiple linear regression approach was used to determine the relationship between ̅ and with the ensemble accuracy (y). The result showed that there is a significant relationship among them. The linier relationship between ̅ and
with the ensemble accuracy (y) is shown in equation (4), where the correlation coefficient value (r) is 0.982 and p < 0.001.
2.757 ̅ 156.687 37.723 4
Table 3. The Values Of New Diversity By Ensemble Accuracy
No Avg of base classifiers accuracy ( ̅) Support ( Ensemble accuracy (y) (%) 1 56.83 0.0997 99 2 57.86 0.1281 98 3 54.69 0.0950 97 4 54.19 0.0987 96 5 51.08 0.0792 95 6 52.77 0.0758 94 7 53.48 0.0937 93 8 52.37 0.1010 92 9 50.75 0.0849 91 10 50.55 0.0895 90 11 49.80 0.0901 89 12 47.99 0.0674 88 13 48.64 0.0745 87 14 49.02 0.0797 86 15 48.57 0.0757 85 16 48.40 0.0909 84 17 48.33 0.1009 83 18 47.22 0.0817 82 19 46.07 0.0587 81 20 45.93 0.0598 80 21 46.67 0.0576 79 22 46.51 0.0618 78 23 45.83 0.0627 77 24 45.59 0.0687 76 25 45.30 0.0841 75 26 44.85 0.0803 74 27 43.32 0.0736 73 28 41.37 0.0550 72 29 41.70 0.0472 71 30 45.02 0.0854 70 31 44.40 0.0815 69 32 43.99 0.0814 68 33 43.59 0.0892 67 34 42.86 0.0991 66 35 44.11 0.1225 65 36 43.26 0.1150 64 37 43.44 0.1160 63 38 42.62 0.1078 62 39 41.14 0.0674 61 40 37.90 0.0453 60 41 37.53 0.0483 59 42 39.65 0.0529 58 43 36.98 0.0313 57 44 37.37 0.0510 56 45 35.94 0.0567 55
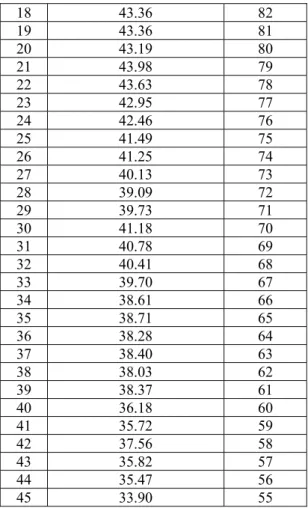
Experiments were also performed to study the new parameter ( ). This parameter which is based on observed diversity measure was calculated using equation (3). Evaluation of ensemble’s accuracy (y) was performed using a 10-fold cross validation method. Table 4 illustrates the values of 45 pairs of
and y. The value of describes the observed parameter while y describes the ensemble accuracy. Data in the table has been sorted by the ensemble accuracy for easy investigation. It appears that the high value of tends to produce high accuracy of ensemble accuracy (y).
Table 4. The Values Of New Parameter ( ) By Ensemble Accuracy (Y)
No
Avg of base classifiers accuracy-(Avg of base classifiers accuracy*support) ( Ensemble accuracy (y) (%) 1 51.17 99 2 50.45 98 3 49.49 97 4 48.84 96 5 47.03 95 6 48.78 94 7 48.47 93 8 47.09 92 9 46.44 91 10 46.02 90 11 45.31 89 12 44.76 88 13 45.01 87 14 45.11 86 15 44.89 85 16 44.00 84 17 43.46 83
Knowledge Management International Conference (KMICe) 2012, Johor Bahru, Malaysia, 4 – 6 July 2012 106 18 43.36 82 19 43.36 81 20 43.19 80 21 43.98 79 22 43.63 78 23 42.95 77 24 42.46 76 25 41.49 75 26 41.25 74 27 40.13 73 28 39.09 72 29 39.73 71 30 41.18 70 31 40.78 69 32 40.41 68 33 39.70 67 34 38.61 66 35 38.71 65 36 38.28 64 37 38.40 63 38 38.03 62 39 38.37 61 40 36.18 60 41 35.72 59 42 37.56 58 43 35.82 57 44 35.47 56 45 33.90 55
A simple linear regression test was performed to determine the ability of this parameter to predict accuracy of the ensemble. The scatter plot and regression of and y depicted in Figure 1. It is clear that the value of this parameter ( can predict the ensemble accuracy (y). There is also a strong positive relationship between them when correlation test and hypothesis test were performed with p < 0.001 and the correlation coefficient value (r) is 0.982. The linier relationship between y and is shown in equation (5) below
2.959υ 48.478 5
IV CONCLUSION
The new measure of diversity ( and the average of base classifiers accuracy ( ̅) have been shown to be the factors that can influence the accuracy of multiple classifier combination (y). There is a significant relationship among them but this measure of diversity alone is not able to predict the
ensemble accuracy. A new parameter ( based on this measure of diversity and average of base classifiers accuracy has been shown to be able to predict ensemble accuracy. Experiment results indicate that there is a strong positive relationship between this parameter and ensemble accuracy. This means the relationship is reliable and this parameter can be used to make predictions. However, further study is needed to ensure that this parameter can be generally accepted, in order to assist in constructing a set of diverse and accurate classifiers as a base classifier for multiple classifier combination.
Figure 1. Scatter Plot Of and Ensemble Accuracy
REFERENCES
Bay, S.,D. (1998) Combining nearest neighbor classifiers through multiple feature subsets. In Proceeding of the 17th International Conference on Machine Learning, pages 37–45 Bryll, R., Gutierrez, R., and Quek, F., (2002). Attribute bagging:
improving accuracy of classifier ensembles by using random feature subsets. Pattern Recognition 36, 1291 – 1302
Canuto, A.M.P., Abreu, M.C.C., Oliviera, L.d.M., Xavier, C.Jr., & Santos, A.d.M. (2007). Investigating the influence of the choice of the ensemble members in accuracy and diversity of selection-based and fusion-based methods for ensembles.
Pattern Recognition Letters 28, 472–486.
Cunningham, P.,& Carney, J. (2000). Diversity versus quality in classification ensembles based on feature selection. Technical Report TCD-CS-2000-02, Department of Computer Science, Trinity College Dublin.
Du, P., Sun, H., & Zhang, W. (2009). Target identification from high resolution remote sensing image by combining multiple classifiers. Proceedings of Multiple Classifier System 2009,
408–417.
Fleiss, J. (1981). Statistical methods for rates and proportions. John Wiley & Sons.
Fukunaga, K. (1990). Introduction to statistical pattern recognition
(2nd ed.). San Diego, CA, USA : Academic Press Professional
Inc.
Giacinto, G., Roli, F. (2001). Design of effective neural network ensembles for image classification processes, Image Vision and Computing Journal 19 (9–10) 699–707.
Han, D., Han, C., & Yang, Y. (2007). Multiple classifiers fusion based on weighted evidence combination. Proceedings of the IEEE
Knowledge Management International Conference (KMICe) 2012, Johor Bahru, Malaysia, 4 – 6 July 2012 107 International Conference on Automation and Logistics,
2138-2143.
Hansen, L.,&Salamon, P. (1990). Neural network ensembles. IEEE Transactions on Pattern Analysis and MachineIntelligence, 12:10, 993–1001.
He, C.L., & Suen, C.Y. (2007). A hybrid multiple classifier system of unconstrained handwritten numeral recognition. Pattern Recognition and Image Analysis, 17(4), 608-611.
Ho., T.K. (1998). The random subspace method for constructing decision forests. IEEE Transaction On Pattern Analysis And Machine Intelligence, 20(8):832–844.
Jain, A.K., & Chandrasekaran, B. (1982). Dimensionality and sample size consideration in pattern recognition practice. Handbook of Statistics, vol. 2, 835-855.
Kohavi, R., &Wolpert, D. (1996). Bias plus variance decomposition for zero-one loss functions. In L. Saitta (Ed.), Machine Learning: Proc. 13th International Conference (pp. 275–283). Morgan Kaufmann.
Kuncheva, L.I., & Whitaker, C.J. (2003). Measures of diversity in classifier ensembles and their relationship with the ensemble accuracy. Machine Learning 51, No. 2, 181-207.
Kuncheva, L.I., Whitaker, C.J., Shipp, C.A., Duin, R.P.W. (2000). Is independence good for combining classifiers? Proceeding of the 15th International Conference on Pattern Recognition 2. 168-171.
Li, K., & Gao, H. (2010). A Novel measure of Diversity for support vector machine ensemble. International Symposium on Intellegence Information Technology and Security Informatics,
3, 366-370.
Parvin, H., Alizadeh, H., & Bidgoli, B.M. (2009). A new method for constructing classifier ensembles. International Journal of Digital Content Technology and its Applications, 3(2), 62-66. Partridge, D., & Krzanowski, W. J. (1997). Software diversity:
Practical statistics for its measurement and exploitation.
Information & Software Technology, 39, 707–717.
Roli, F., (2009). Multiple classifier system. Encyclopedia of Biometrics, 981-986.
Shin, D., & Kim, S. (2009). Nearest mean classifier via-one class SVM, International Joint Conference on Computational Sciences and Optimization volume 01, 593-596.
Skalak, D. (1996). The sources of increased accuracy for two proposed boosting algorithms. In Proc. American Association for Artificial Intelligence, AAAI-96, Integrating Multiple Learned Models Workshop.
Sneath, P., & Sokal, R.(1973). Numerical Taxonomy.W.H.Freeman & Co.
Suen, C.Y., Nadal, C., Mai A., Legault R., & Lam, L. (1990). Recognition of totally unconstrained handwritten numerals based on the concept of multiple experts. Int. Workshop on Frontiers in Handwriting Recognition, 131-143.
Tumer, K. and Ghosh J., (1996). Error Correlation and Error Reduction in Ensemble Classifiers. Connection Science, Special issue on combining artificial neural networks: ensemble approaches, 8(3-4), 385-404.
Veenman, C.J., &Tax, D.M.J. (2005). A weighted nearest mean classifier for sparse subspaces. Proceedings of Computer Vision and Pattern Recognition (2), 1171-1176.
Xie Z. X., Yu D. R., & Hu Q. H. (2006). Study on sensor fault tolerance with multi-classifiers of SVM fusion. Journal of Harbin Engineering University, 27(Supp), 389-293.