Problem Solving or Problem
Searching — A Look at the Data
Process Hierarchy from Acquisition
to Decision Making
Tim Dobush, Tracey Minton, Greg Hollyer
Summary
Today’s exploration geochemist is faced with a twosided challenge of working with expanding volumes of multielement geochemical data and needing to effectively use computer software to extract meaningful information from this data. Data and information combined with expert knowledge --represent the key resources required to evaluate potential mineral exploration targets and reach a decision about the viability of these targets.
Increases in data volumes are related to developing mineral exploration techniques, where a
geochemical survey may be assayed for thirty elements or more. As more data has become available, there is also the sense that there is more information to be extracted – the question is how to effectively access and evaluate this information resource in a timely manner. Increasingly, the geochemist has turned to computerized techniques and software to provide answers to this question.
Historically, the application of computer software to geochemical problems has been fragmented. If a geochemist required a mapping tool, for example, the solution would typically be to implement a standalone DOS-based mapping package and continue working (until the next software need was recognized and resolved). In the short term, this approach enabled geochemists to continue working because each specific task was well defined and generally solved with a particular software solution. A major frustration in this environment, however, was in the lack of standard data formats -- resulting in wasted resources in moving data and information from one software system to another.
Contrary to expectations, operating systems like Windows 3.11/95/NT only amplified this frustration. The implementation of common Graphical User Interfaces (GUI) promoted the belief that software would converge and provide a quasi-single software solution – in which all tasks could be performed and information exchanged easily. What we actually experienced was a proliferation of generalized software “solutions” that represented “solutions trying to find a problem” – rather than systems that addressed the specific problems encountered by the geochemist.
To obtain meaningful geological information from multivariate data, geochemists must overcome a variety of specific problems -- related to data acquisition, import and quality control, processing, analysis, visualization and final presentation maps. In this paper, we first examine each of these and the basic needs that software must meet in order to be useful to the geochemist. We also introduce a model referred to as the Earth Science Information / Process (ESIP) model. This model is intended to provide a general framework for viewing the basic geochemical problem-solving process and the relationship of data, information and knowledge throughout this process. From this, we can clearly differentiate the approaches of the various software systems and the implications these software systems have on this data processing hierarchy. By looking at the way in which the geochemist extracts knowledge from data, we focus on how the geochemist can best select the systems that enable them to find “solutions to their specific problems and challenges."
T
echnical P
aper
1
Introduction
The Earth Science Information / Process (ESIP) model is proposed as a starting point for understanding the general exploration geochemical problem-solving process. Before proceeding further, we define the ESIP model and illustrate the model’s role in relating data, information and knowledge to the basic activities in the geochemist’s decision-making process.
As shown in Figure 1, the ESIP model uses a pyramid to express the relationship between data, information and knowledge (defined as “primary components”), and the acquisition and decision components.
At the base of the pyramid is an observation or measurement. The sources may be the in-field data collection and/or resultant laboratory analysis of rock chip, soil grab and water stream sediment samples (sampled population). In addition, the observations may be historical in nature residing in some computer database or non-electronic format (i.e., written notes). The acquisition component should consider all relevant constituents related to data gathering, such as survey design and sample collection.
Data comprise the next level in the hierarchy. Stated most simply, data represent unprocessed observations. For instance, data could refer to a single numerical value for a specific element in a geochemical dataset.
The next level in the hierarchy is information. Information contrasts with data in that it represents an order or pattern recognized in the data. Essentially, raw data has been transformed through some process (human or computer-based). Examples in the exploration geochemical context include observations that have been manipulated statistically or a geologic lithology map constructed from related geological observations.
The next level is knowledge. Knowledge represents organized information. Knowledge is the sum total of all experiences which combine the geochemist’s practical experiences, formal educational training, and the analysis and visualization of data or information. One recent example in the literature distinguishes this type of experiential, combined knowledge as the deeper workings of the “mind’s eye”. This concept contrasts with the task of “visualization” which can be thought of as one of the important “windows” to the mind’s eye.
At the top of the hierarchy lie decisions. The final outcome in any exploration investigation is to make a conclusion and act on this conclusion. In mineral exploration, the most common decision is whether to drill at a certain location.
General Implications of the ESIP Model
As embodied in the ESIP model, we can further recognize certain characteristics that reflect both the pyramidal representation and the levels of organization within the model:
• The data level is the most abundant component in the system followed by information and knowledge.
• Data must progress through one or more transformations to become information.
• Data transformations are focusing processes – in which scientific value is increased through the manipulation of large volumes of data into information, knowledge and finally, decisions.
Figure 1: THEEARTHSCIENCEINFORMATION/PROCESS MODEL(ESIP) IS A REPRESENTATION THAT DESCRIBES THE LIFE CYCLE OF DATA AS RAW DATA IS TRANSFORMED INTO INFORMATION AND KNOWLEDGE. WHEN KNOWLEDGE IS REALIZED, DATA COMPLETES ITS PRIMARY LIFE CYCLE OF USEFULNESS– AND A DECISION IS MADE. THIS
REPRESENTATION IS NOT NECESSARILY LINEAR AS TASKS CAN BE REPEATED AS REQUIRED.
T
echnical P
aper
• Decisions are ultimately based on data – when we break, forget or consciously choose to ignore this connection, we may be subject to a loss of “data context” and/or “data intimacy”. Later in this paper, we look at two software systems (DPA and GIS) that use different approaches to the ESIP model to assist geochemists to work with data, information and knowledge. In addition, we look at the way in which each system attempts to help geochemists augment their existing knowledge with new knowledge generated from data and information.
Relating the ESIP Model to the Exploration Geochemist’s Specific Tasks and Tools
As illustrated in the ESIP model, geological decisions depend on collecting and evaluating high-volume geochemical data along with supporting data or information from other fields (geophysics, remote sensing, etc).
Various software tools are available for working with data and information, and it is important the geochemist understands their roles and how each of these tools is used in the exploration programme. In performing this examination, the geochemist should understand their “point-of-entry” into the ESIP model. Each individual in the organization relies on data, information and knowledge in varying degrees and this has a significant impact on the choice of software tools.
For example, as geochemists navigate the hierarchy of their own organizations, they tend to become more isolated from data and rely more on information, knowledge and decision-making skills. On the other hand, a less senior geochemist may rely more initially on intimate knowledge of data, collecting and organizing data to a point at which resulting information may be passed to a senior geologist or geochemist. A geochemist involved in an integrated organization may be required to navigate all levels of the ESIP hierarchy and work with all primary components to reach a final decision. The identification of ESIP involvement, in turn, has significant outcomes in terms of evaluating and using specific classes of software tools. This exercise is nontrivial since many geochemists have come to rely on software as a key resource. If geochemists primarily work with data and information, they require different tools or different means of interacting with tools than geochemists who function at the decision-making level. A second implication of the ESIP model relates to the capabilities of today’s generation of software tools. Today’s emerging generation of PC-based systems are increasingly using interactive, visual implementations to add informational value and build knowledge. This approach mirrors the “mind’s eye” process described earlier in that these new implementations enable the user to interactively combine experience with point-andshoot” processing, analysis and visualization functions.
The Data Stream Process – Progressing from Acquisition to Decision Making
In progressing from acquisition to the decision-making steps, we need to understand the processes involved in augmenting existing knowledge with entirely new knowledge generated from data and information. The Data Stream process comprises all major activities (i.e. specific computer assisted tasks) required to transform raw observations into information, knowledge and decisions. The process comprises five major components:
• Import. Facilitates access to observations and supporting information.
• Process. Provides capabilities for converting raw data to information.
• Analyze/Model. Provides capabilities for converting processed data into geologically meaningful quantities and models.
• Visualize/Integrate. Provides capabilities for applying knowledge through the geochemist’s experience in extracting information from visual representations of data and information.
• Present/Act. Provides presentation facilities for creating maps and tables on which decisions are reached and actions recommended.
Throughout this process, it is important that the software tools allow you to interact with your data in an effort to insure that derived information and use of this information correlates with the original observations.
T
echnical P
aper
Laboratory and Field Data Import
Import is an area that is generally overlooked when evaluating software tools for the exploration programme. Although overlooked, it accounts for the largest portion of processing time, in some cases up to 80 percent. Traditionally, geochemical data import has been problematic due to a number of factors, including:
• Multiple data formats. As part of the quality control process, exploration geologists and geochemists typically use multiple labs for assaying. Each laboratory may report the results in a different data format.
• Below-detection limit (BLD) and specially coded values. The geochemist requires systematic methods for dealing with BLD values. These values have statistical significance and therefore cannot be eliminated from the dataset. Also laboratories often use special codes to indicate missing samples, etc.
• Lack of specialized data import and management software. A typical approach is to use a combination of off-the-shelf spreadsheet packages and editing software to work with laboratory and field data.
• Difficulty in working with standard laboratory values. As part of the due diligence process, standard samples are routinely sent to laboratories. Standards function as controls against which the accuracy of laboratory results can be evaluated. Because standards must be removed from assay results and managed and evaluated separately, they can complicate the data management process.
• Data maintenance requirements. Laboratory and field data is updated continuously and data maintenance can be time-consuming especially when multiple software packages are used for formating and quality control.
As outlined in Figure 2, the import process must consider a variety of subtasks including laboratory control, location merging and verification, and database management (editing, updating and retrieval). Ideally, these processes are implemented in a single software system to minimize data import
complexity and to facilitate quality control during data import.
Before data is merged into a master database for further processing, the observations should be verified and if necessary, corrected. These quality control procedures include correlating and removing standards, compensating for repeat duplicates, missing assay results or unmerged sample and for interactively editing data. The master database can be considered as a secure environment in which reliable data resides.
Geochemical Data Processing
At the processing stage, the geochemist’s objective is to convert raw data into information, such as classified and filtered data, or various types of grids so that the spatial relationship of data can be evaluated. From a data processing perspective, it is important that we are able to verify the information derived from the data -- recognizing that we are only working with the sampled population and not the target population. In considering the sampled population, we need to reflect on the variable nature of the sampling and assaying techniques and continuously question processing assumptions and methods. By extension, the geochemist’s software tools should allow for a choice in how detailed to process the data depending on how well the sampled population relates to the target population.
Figure 2. THE KEY SUBTASKS IN THE IMPORT PROCESS INCLUDE IMPORTING LABORATORY DATA, IMPORTING FIELD DATA(INCLUDING LOCATIONS, NOTES, LITHOLOGY CODES AND OTHER DATA), EXTRACTING STANDARDS AND VERIFYING THE DATA PRIOR TO CREATING A MASTER DATABASE. GEOCHEMISTS MAY ALSO REQUIRE TEMPLATE FUNCTIONALITY FOR MANAGING DATA SUPPLIED IN DIFFERENT FORMATS.
T
echnical P
aper
Some standard processing tools include:
• Basic and extended statistics
• Spatial filters
• Gridding
Some basic statistical capabilities include the ability to report the number of samples and missing values (dummies), minimum and maximum values, data range, mean and median. In addition, the geochemist may rely on extended statistical reporting, such as sum of squares, standard deviation, variance, standard error, mode, geometric mean, kurtosis and skewness.
Basic and extended statistics provide the geochemist with numerical means of determining how to process and evaluate data. As an aside, this numerical type of method represents an alternate window to the mind’s eye in which textual numerical representations – as opposed to visual representations – are used to augment the geochemist’s existing pool of knowledge and experience.
Because the geochemical data collected generally contains broadband information, data filtering may be used selectively to enhance the data. Certain filters (lowpass) may help to subdue “noisy” data or enhance regional trends. Conversely, other filters (high-pass) remove the long wavelength regional trends and may help to enhance local targets of interest that have short wavelengths.
With gridding, we have the necessary means to spatially relate our data. In doing so, we again need to remember that we are dealing with a sampled population and that our resultant grid is subject to missing values, strong gradients (adjacent high-low values), and values below the detection limit. Grid controls like log or log-linear (avoid negative grid values) and blanking distance (grid only a certain distance from valid data points) help to retain the original data integrity.
Gridding can be completed using various algorithms. The most commonly employed for geochemical data are the kriging and minimum curvature methods. Kriging is well suited for data that is variable or clustered, while minimum curvature lends itself to well sampled data.
Geochemical Analysis and Model Building
In this section, we discuss how specific analysis techniques can help enhance the geochemist’s existing knowledge. The purpose of analyzing or modeling data is to enhance information that improves your knowledge of the mineralization and geology within a specific exploration environment.
In exploration geochemical applications, there are two essential ingredients for success in locating and characterizing potentially economic mineralized targets. These are the ability to:
• Identify fundamental relationships within a suite of elemental data. Recognizing that certain elements exhibit bimodal or lognormal distributions, or that certain groups of elements are related statistically is a basic starting point in mineral exploration.
• Determine the spatial distribution of key elements or multiple elements that are either direct indicators of economic mineralization or characteristic of specific lithologic units.
There are many approaches to meeting these basic requirements, including statistical analysis and more complex forms of statistical analysis, such as various multivariate analysis techniques. Increasingly, approaches are becoming visual and interactive. This trend reflects the perspective that geochemical “patterns” must be recognizable in the original data. From a knowledge perspective, visual tools provide the geochemist with the ability to rapidly assimilate data and information and evaluate complex datasets. Histograms provide a visual means of identifying fundamental relationships in elemental datasets. Histograms are a familiar method for displaying numerical information and providing a visual representation of the data in which:
• The total range of data in a sample is apparent
• Modes can be easily recognized
• The range of greatest abundance of values can be estimated rapidly
• The general form of the density distribution of data is apparent
T
echnical P
aper
They are also useful for distinguishing between background and anomalous values (i.e. quality control), or for recognizing a bimodal data distribution (i.e. interpretation). In many cases the logarithmic transform of raw data is important because it provides a normal data distribution; in which case, the data is said to be lognormal.
In addition, the geochemist requires a variety of capabilities for examining spatial relationships. These include scatter analysis tools, classification techniques and subsetting capabilities combined with a range of data and image presentation methods.
Scatter analysis is a key interactive technique that can be used to:
• Evaluate data populations and subgroups that may be related to geology or other special features.
• Classify the selected data using spatial distributions. These classifications can be displayed on a map, or used to generate a new subsetted database that contains only the selected data population.
As shown in Figure 3, the scatter analysis tool provides a powerful means of rapidly evaluating and displaying spatial relationships in multivariate data.
In the context of developing geologic models based on geochemical data, one of the most effective methods is classification and subsetting. Some approaches include:
• Interactively using polygonal and rectangular masking areas
• By map region (based on an existing map, such as that shown in Figure 3)
• By map group (based on imported AutoCAD drawings containing various lithologic groups in separate layers)
• By lithology code (based on field notes)
These methods each enable the geochemist to subset data according to a different strategy. The type of information already available dictates the strategy.
For example, if you are in a new area and trying to build an initial understanding based on field observations and assay results, you could:
• Classify interactively based on scatter analysis
• Relate specific elements to certain geology units (using mapping tools)
• Classify based on a region to create your own geology map
If you have an existing set of lithology from a field exploration program, you could classify based on lithology code. Alternately, if you have an existing map and are re-examining a known mining area, you could classify based on the geology map (lithology units).
Geochemical Visualization and Integration
The visualization and integration process is a key component of the geochemical Data Stream because decisions to evaluate potential targets are based on the ability to visually communicate and justify results. From a knowledge perspective, the ability to extract information from visual
representations of data and information provides a key opportunity for the geochemist to apply and enhance her/his own training and intellect.
Figure 3. SCATTER PLOTS ARE A COMMON METHOD TO SHOW THE RELATIONSHIP BETWEEN TWO ELEMENTS. HERE WE SHOW THE RELATIONSHIP BETWEEN ZIRCONIUM AND NICKEL WITH THE LOWER POPULATION GROUP DEPICTED AS WHITE SYMBOLS ON THE CORRESPONDING GEOLOGY MAP.
T
echnical P
aper
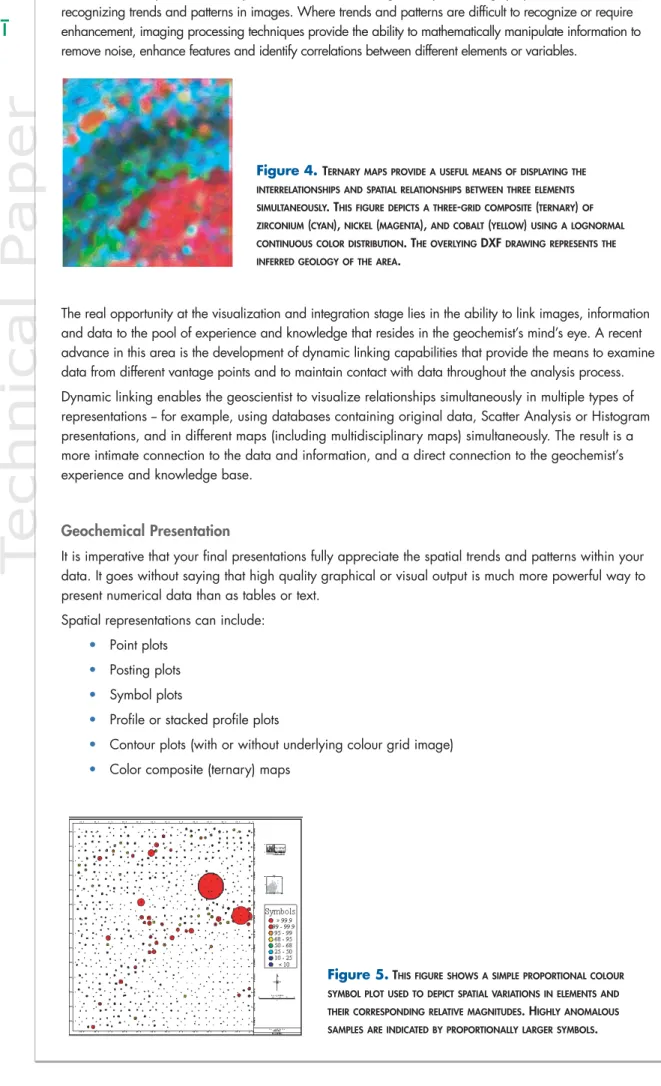
For the geochemist, imaging tools provide an excellent method for displaying geochemical data and evaluating multivariate and spatial relationships. The human brain, through our eyes, is a highly optimized device for recognizing trends and patterns in images. Where trends and patterns are difficult to recognize or require enhancement, imaging processing techniques provide the ability to mathematically manipulate information to remove noise, enhance features and identify correlations between different elements or variables.
The real opportunity at the visualization and integration stage lies in the ability to link images, information and data to the pool of experience and knowledge that resides in the geochemist’s mind’s eye. A recent advance in this area is the development of dynamic linking capabilities that provide the means to examine data from different vantage points and to maintain contact with data throughout the analysis process. Dynamic linking enables the geoscientist to visualize relationships simultaneously in multiple types of representations -- for example, using databases containing original data, Scatter Analysis or Histogram presentations, and in different maps (including multidisciplinary maps) simultaneously. The result is a more intimate connection to the data and information, and a direct connection to the geochemist’s experience and knowledge base.
Geochemical Presentation
It is imperative that your final presentations fully appreciate the spatial trends and patterns within your data. It goes without saying that high quality graphical or visual output is much more powerful way to present numerical data than as tables or text.
Spatial representations can include:
• Point plots
• Posting plots
• Symbol plots
• Profile or stacked profile plots
• Contour plots (with or without underlying colour grid image)
• Color composite (ternary) maps
Figure 5.THIS FIGURE SHOWS A SIMPLE PROPORTIONAL COLOUR SYMBOL PLOT USED TO DEPICT SPATIAL VARIATIONS IN ELEMENTS AND THEIR CORRESPONDING RELATIVE MAGNITUDES. HIGHLY ANOMALOUS SAMPLES ARE INDICATED BY PROPORTIONALLY LARGER SYMBOLS.
Figure 4. TERNARY MAPS PROVIDE A USEFUL MEANS OF DISPLAYING THE INTERRELATIONSHIPS AND SPATIAL RELATIONSHIPS BETWEEN THREE ELEMENTS SIMULTANEOUSLY. THIS FIGURE DEPICTS A THREE-GRID COMPOSITE(TERNARY) OF ZIRCONIUM(CYAN), NICKEL(MAGENTA), AND COBALT(YELLOW) USING A LOGNORMAL CONTINUOUS COLOR DISTRIBUTION. THE OVERLYINGDXF DRAWING REPRESENTS THE INFERRED GEOLOGY OF THE AREA.
T
echnical P
aper
With any of these types of maps or presentations, they should accurately reflect the original
observations from which these maps are derived. For example, contour maps, may be a better format to represent generalized geological trends while symbol plots are better suited for showing anomalous samples. In doing so, care should be taken in understanding how we derived these presentations. Contours, being a reflection of the related grid, should take into account variabilities like grid control values below detection limit (first contour on detection limit value) and strong gradients (ability to feather or suppress contour lines).
Geochemical Decision Making
At the decision-making stage, the reality is that no software system has been conceived to replace the expertise of the geochemist and/or decision-maker. Software systems remain tools that ease the job at hand by transforming data and information, and helping geoscientists develop and augment their knowledge base for decision making.
When making a decision, we can involve our software tools but the majority of that involvement should be in preparing final presentation materials on which decisions are based. In addition, the
geochemist’s software tools should be flexible enough to enable the geoscientist and/or decision-maker to answer the following questions:
• Do we have all of the information required to make a decision?
• Does our information correlate with our knowledge of the problem?
• Do we need to verify our information with the original data?
Discussion of Software Approaches and Roles
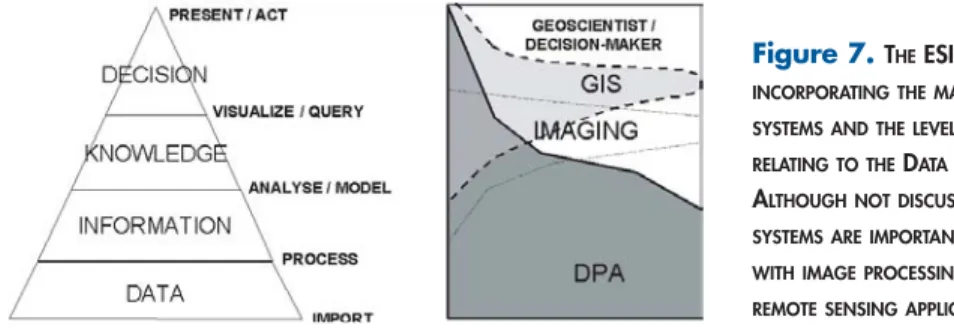
Although there exists a variety of software tools and systems to support the geochemist, the majority of processes can be grouped into two major categories – comprising Data Processing and Analysis (DPA) systems and Geographic Information Systems (GIS). Imaging systems are a specialized type of system that we refer to as a “helper” application.
The Data Processing and Analysis (DPA) system focuses explicitly on the data-information-knowledge spectrum of the ESIP model. DPA systems are developed specifically to assist geochemists in addressing problems related to data and information (such as removing cultural and geologic noise that obscures true geologic “signal” and manipulating high-volume datasets) and in providing capabilities for building knowledge from data and information.
The Geographic Information (GIS) system focuses explicitly on the information-knowledge spectrum of the ESIP model. GIS systems are developed specifically to assist geochemists in addressing problems relating to information and knowledge – such as performing query-and-answer tasks using processed and corrected information and data.
ESIP Description of DPA Systems
As shown in Figure 1 (starting from the Data level), DPA systems are designed for the geochemist who works with data, information and knowledge. The user can enter the system via any of these primary components, although the system is specially designed to provide powerful capabilities for manipulating high-volume data.
The orientation of a DPA system is process-based and comprises five major components as follows:
• Import (or Access). Facilitates import and export of raw data and information.
• Process. Provides capabilities for converting raw data to information.
• Analysis/Modeling. Provides capabilities for converting processed data (information) into knowledge complementary to the geochemist’s existing knowledge.
T
echnical P
aper
• Visualization/Integration. Provides capabilities for applying knowledge through the geochemist’s experience in extracting information from visual representations of data and information. Data and information can be integrated from multidisciplinary sources, including geophysical, geological, remote sensing and other sources.
• Present / Act.Provides presentation facilities for creating maps and tables on which decisions are reached and actions recommended.
Because the DPA approach is designed to work with data, it can be thought of as an Earth Science “Authoring” system in which the geochemist can start from the original data, process it to eliminate problems that occur in the data and ultimately transform the data into information and knowledge. The geochemist functions as the author, writing the book from start to finish and resolving one or more problems during the process.
In addition to providing an “Authoring” system, a DPA system provides the geochemist with a system in which:
• The original and processed data always remain in the system. The relevance is that the scientist can retain data context (i.e. contact with the data and the processes that have been applied to the data). When analyzing data and verifying results, the geochemist can relate processed data to other information as well as the original data.
• The system functions as an “Experiential” system. Experiential systems are geared for
individuals who “learn by doing”. DPA enables the geochemist to work with data from start to finish -- providing a broad window in which to increase their understanding of the data and ultimately, to gain knowledge about the specific problem at hand.
ESIP Description of GIS Systems
Currently there are many GIS systems available (from desktop mapping GIS to satellite imaging GIS). These are typically developed for applications other than the Earth Sciences and then applied to this field retroactively -- a software development approach that may be viewed in some sense as a “solution looking for a problem”.
Ultimately, the large number of GISs and the wide range of uses make exact definition of GISs difficult. For the purposes of this paper, therefore, we assume the model of an “idealized” GIS which is based on some of the commonalties between various GIS systems. These commonalties are defined through the ESIP model and functionality as detailed in subsequent sections.
As shown in Figure 6, GIS is a system designed for the geochemist who works with information and knowledge. The user can enter the system via any of these primary components, although the system is specially designed to provide powerful querying capabilities for manipulating already corrected and processed data (information).
The orientation of GIS is goal-based -- an approach that is defined in terms of a Query and Answer concept. The Query and Answer concept comprises four major components as follows:
• Access. Facilitates import and export of raw data and information.
Figure 6:THEGIS REPRESENTATION INCORPORATES BOTH THEEARTHSCIENCEINFORMATION/PROCESS(ESIP) MODEL AND THE MAJOR ACTIVITIES PERFORMED WITHIN A GIS SOFTWARE ENVIRONMENT. THE FOUR ACTIVITIES TO THE RIGHT OF THE FIGURE CONSTITUTE THEGIS QUERY ANDANSWER CONCEPT IN WHICH INFORMATION IS QUERIED AND TRANSFORMED TO KNOWLEDGE AND DECISIONS THROUGH SPECIFIC COMPUTER-ASSISTED TASKS.
T
echnical P
aper
• Query. Provides advanced querying capabilities for converting processed data (information) into knowledge complementary to the geochemist’s existing knowledge.
• Visualization / Integration. Provides capabilities for applying knowledge through the geochemist’s experience in extracting information from visual representations of data and information.
• Report / Action. Provides presentation facilities for creating maps and tables on which decisions are reached and actions recommended.
Because the GIS is not focused on data processing and is designed to work with processed data (classed as information under the ESIP model), the GIS can be thought of as a “Library” of information, that allows the geochemist to request information and then see the results of the request.
Essentially, the user enters the library and requests information from the library catalogue -- the system uses the resources of the microprocessor to search the catalogue and present the results of the search to the user.
As many users will attest, the benefits that GIS delivers are significant. A main advantage of the GIS approach is that the user can determine complex relationships between all of the stored information in the data space.
In addition, GIS provides “instant gratification” -- an important strength in a Geoscience environment that currently faces an “information crisis”. This crisis is most commonly seen in the form of steadily increasing volumes and sources of information.
The benefits to geochemists hinge on the GIS’s ability to work with information -- a fundamental strength of the relational database architecture on which GIS is based. As described in MacLeod and Hollyer (1996), relational database architectures were not originally intended for handling high-volume data, hence, the tendency is to rely on GIS systems for information management rather than data processing and analysis.
When using a GIS, the geochemist must be intimately familiar with the types of information at hand and must have a well-developed understanding of querying and what types of questions to ask. When working in a large and complex data space, the nature of query formulation typically requires the attention of a senior geoscientist.
Conclusions
In summary, this paper has organized the key components of exploration problem solving into its data, information and knowledge components, and its individual processes based on a generic Earth Science Information / Process model. The objective is to provide a model for streamlining exploration decision-making and to identify opportunities to enhance the quality of results.
The success of evaluating potential targets and the viability of these targets depends on data quality and the ability to access and compare original data with processed results (information) at any stage of the process.
Ultimate success, however, depends on geochemist’s ability in applying her/his knowledge and experience in the context of the high-quality data and information at hand.
Figure 7. THEESIP MODEL INCORPORATING THE MAJOR SOFTWARE SYSTEMS AND THE LEVEL OF FUNCTIONALITY RELATING TO THEDATASTREAM PROCESS. ALTHOUGH NOT DISCUSSED, IMAGING SYSTEMS ARE IMPORTANT WHEN DEALING WITH IMAGE PROCESSING REQUIREMENTS FOR REMOTE SENSING APPLICATIONS.
T
echnical P
aper
11
T
echnical P
aper
For more information on the software used in this paper, contact [email protected]. Visit www.geosoft.com.
Future Directions
As geochemists recognize that it is no longer necessary to work in a fragmented software environment and as they seek easier-to-use software capable of handling increasing volumes of data and
information, their requests for commercial software solutions will increase.
In future, the solutions that software developers create by request (or anticipate in advance of the market) will begin to take advantage of operating system convergence and technology integration. The resulting software should increase the rate of convergence of various commercial software packages into a relatively integrated solution.
Some of the innovations that software developers should consider in realizing this solution are:
• Closer integration of DPA, GIS and helper (specialized) software through strategic relationships and third-party relationships).
• ODBC-compliant links to link DPA to the outside world.
• Development of additional DPA applications to provide new sources of information that can be used in both DPA and GIS systems.
• Appreciation by commercial software companies of the need and benefit of being able to evaluate the geochemist’s task profile according to their position in the ESIP model. In addition, they must be able to recommend a “complete” solution that includes core software (DPA and GIS) and helper applications that are appropriate to solving the geochemist’s organizational and problem-solving requirements.
Acknowledgements
Special thanks to the Council for Geosciences in South Africa, (Private Bag X112,
Pretoria 0001 South Africa) for providing the regional reconnaissance data used in this paper.
References
Ferguson, E. S., 1992. Engineering and the Mind’s Eye. Cambridge, MA: The MIT Press, 194 pp. Hollyer, G. M.and Thorleifson, L. H., 1996. Personal Computer (PC) – Based Methods for Integrating, Processing and Visualizing Multivariate Data. EXPLORE Newsletter, October 1996, Number 93. Denver, U.S.A: Association of Exploration Geochemists.
Hollyer, G. M., Dobush, T. M.and MacLeod, I. N., 1996. Implementing Data Processing and Analysis (DPA) Software with GIS – Toward an Integrated PC-Based Commercial Software Solution for the Geoscientist. Toronto, Canada: Geosoft Inc. Internal Report.
Hollyer, G. M., Dobush, T. M.and MacLeod, I. N., 1997. Data Processing and Analysis (DPA) Software and Relevance in Terms of an Earth Science Information / Process (ESIP) Model. Toronto, Canada: Exploration ’97 Conference, In Press.
MacLeod, I. N.and Hollyer, G. M., 1996. Advances in Commercial Software for High-Volume Geophysical Data. Paper presented at Airborne Geophysics Workshop, Second International Seminar and Exhibition. Hyderabad, India: Association of Exploration Geophysicists.
Rutherford, N.F., 1982. Exploration Geochemical Data Processing: Developments in Geochemical Data Acquisition, Field Processing and Presentation Methods. Coogee N.S.W, Australia: Rutherford Mineral Resource Consultants.